Ultrasound Market

Ultrasound Market by Technology (2D, 3D, Doppler, Contrast-Enhanced, HIFU, ESWL), Component (Workstation, Probe), Type (Cart, Handheld, PoC), Application (OB/GYN, CVD, Urology, Ortho), End User (Hospitals, Clinics, ASCs) & Region - Global Forecast to 2028

Report Code: MD 2885 Aug, 2023, by marketsandmarkets.com

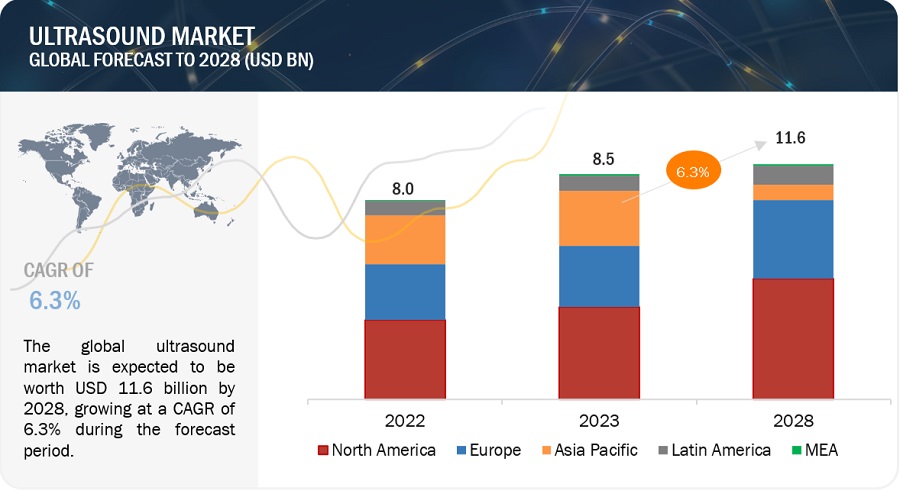
The global ultrasound market in terms of revenue was estimated to be worth $8.5 billion in 2023 and is poised to reach $11.6 billion by 2028, growing at a CAGR of 6.3% from 2023 to 2028. The new research study consists of an industry trend analysis of the market. The new research study consists of industry trends, pricing analysis, patent analysis, conference and webinar materials, key stakeholders, and buying behaviour in the market. The increasing patient population, rising prevalence of chronic diseases, and rising focus on non-invasive procedures are expected to drive the market during the forecast period.

Global Ultrasound Market
Ultrasound Market

To know about the assumptions considered for the study, Request for Free Sample Report
Ultrasound Market

e- Estimated; p- Projected

Ultrasound Market Dynamics

Driver: Increasing prevalence of target diseases

The burden of chronic and lifestyle diseases has increased in recent years. The burden of cancer, for example, is expected to increase from 14.1 million new cases to 19.3 million new cases during 2012– 2020 (Source: GLOBOCAN, 2020). The number of new cases reported annually in India and Africa is expected to increase from 1.0 million to 1.2 million and 0.84 million to 1.05 million, respectively, during 2012–2020. According to the American Cancer Society and the National Cancer Institute, in 2018, over 265,000 new cases of invasive breast cancer were diagnosed among women in the US, with 63,960 new cases of non-invasive (in situ) breast cancer (Source: Breastcancer.org). In Canada, as many as 26,900 women were diagnosed with breast cancer in 2019. Breast cancer accounted for around 25% of new cancer cases and 13% of cancer deaths in women (Source: Canadian Cancer Society).

The survival rate of breast cancer patients is six times higher if diagnosed in the early stage, as compared to the advanced stage. In the case of lung cancer patients, the survival rate is four times higher (Source: Cancer Research, UK). The possibility of quicker, easier treatment highlights the need for effective diagnostic modalities, such as ultrasound, in cancer treatment.

  • Cardiovascular disease (CVD) is the leading cause of death globally, with an estimated 17.9 million deaths yearly, representing 31% of all global deaths. According to the American Heart Association (AHA), in the US alone, more than 102.7 million adults had at least one cardiovascular condition as of 2020. This number is projected to rise to 131.2 million by 2035. Heart disease costs the US government about USD 219 billion each year.
  • Globally, ~12.8 million cosmetic procedures were performed in 2021, a 19.3% increase as compared to 2019, with more than 12.8 million surgical and 17.5 million non-surgical procedures performed worldwide. (Source: ISAPS)

Restraint: Unfavorable healthcare reforms in the US

In August 2012, the US government planned to reduce Medicare spending by USD 716 billion over the next 10 years (until 2022). As part of this, a 2% cut was announced in Critical Access Hospitals (CAH) Medicare payments (effective from April 2013). The government also imposed a 2.3% excise duty on the domestic sales of taxable medical devices effective from 2013 (under PPACA, 2010). Many industry participants expect that this health reform will negatively affect the cash flow for medical device companies operating in the US (including those involved in the manufacturing and marketing of ultrasound systems). This may limit the adoption of such devices in the US, as a number of healthcare facilities depend on government funds for purchasing high-end, highly expensive instruments.

Since the US accounts for the second-largest share in the global ultrasound industry, ongoing healthcare reforms in the US can be expected to affect the market as a whole.

Opportunity: Expanding applications of therapeutic ultrasound

Minimally invasive therapies and image-guided procedures are increasingly being adopted by healthcare professionals and patients across the world. The ultrasound industry has witnessed a significant shift from being a conventional diagnostic modality for OB/GYN imaging to a therapeutic technique for renal stones, cancers, and other clinical conditions. This trend is expected to be further propelled by ongoing clinical studies to establish the efficacy & safety profile for ultrasound in specific applications. A few of the major clinical studies in this field initiated during 2010–2019 are mentioned below:

In November 2021, Shantou Institute of Ultrasonic Instruments Co., Ltd. (China) has introduced Apogee 6 series of color doppler ultrasound imaging solutions. The series includes the Apogee 6200, Apogee 6300 and Apogee 6500 color Doppler ultrasound systems that provides comprehensive solution for cardiac, abdominal, vascular, musculoskeletal, urology, and OB/GYN clinical applications.

  • In March 2020, Philips Healthcare received 510(k) clearance from the FDA to market its ultrasound solutions portfolio for the management of lung and cardiac complications associated with COVID-19.
  • In October 2018, researchers at the University of Maryland Medical Center became the first team in the US to treat neuropathic pain using noninvasive focused ultrasound therapy.
  • In May 2018, Havard Dalen (from the Norwegian University of Science and Technology) initiated a study to evaluate the feasibility and reliability of implementing handheld focused cardiac ultrasound for the diagnosis of heart failure.

The expanding applications of ultrasound have allowed for newer advancements and the development of application-specific systems. It can be expected that such efforts will open up new avenues for revenue growth for manufacturers in this market.

Challenge: Growing end-user preference for refurbished equipment

Due to the high prices of novel ultrasound technologies (such as focused ultrasound) and budgetary constraints faced by small-sized healthcare providers, the preference for refurbished ultrasound equipment has grown. For instance, a typical 3D/4D ultrasound system costs USD 20,000–75,000 in North America, while a refurbished 3D/4D ultrasound system costs USD 5,000–40,000. The growing preference for refurbished systems is therefore expected to pose a significant challenge to market growth.

Several independent associations and government organizations (such as the US FDA and Japan Federation of Medical Devices Associations) are increasingly promulgating guidelines for the diagnostic use of refurbished ultrasound equipment. Several ultrasound product manufacturers (such as General Electric Company, Koninklijke Philips N.V., and Siemens AG) are also focusing on providing refurbished ultrasound equipment at affordable and competitive prices to cater to such end-user segments.

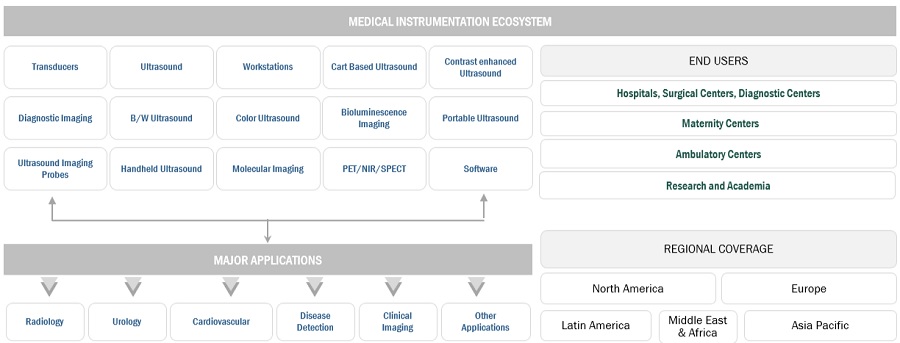
Ultrasound Market Ecosystem
Ultrasound Market Ecosystem

By technology, the NIR devices segment accounted for the largest share of the ultrasound industry in 2022

Based on technology, the global ultrasound market is segmented into therapeutic, diagnostic, and contrast enhanced ultrasound. In 2022, the diagnostic ultrasound segment accounted for the largest market share. The rising adoption for the non-invasive procedures and the need for better turnaround time, high-image resolution, real-time image guidance during surgeries and enhanced precision is driving the segment growth.

By application, the preclinical applications segment of the ultrasound industry to register significant growth in the near future

Based on application, the ultrasound market is divided into eight segments—radiology/general imaging applications, obstetrics/gynecology applications, cardiology applications, urological applications, vascular applications, orthopedic & musculoskeletal applications, pain management applications, and other applications. Major share of the segment is attributed to the increasing number of radiology centers and the growing use of ultrasound for general imaging and diagnosis purpose.

By end user, the hospitals and surgical centers companies segment accounted for the largest share of the ultrasound industry in 2022

On the basis of end user, the ultrasound market has been segmented into hospitals, surgical centers, and diagnostic centers; ambulatory care centers; maternity centers; research and academia; and other end users (including physiotherapy centers, independent industry associations, government organizations, and sports academies). However, the ambulatory care centers segment is estimated to grow at the highest CAGR during the forecast period.

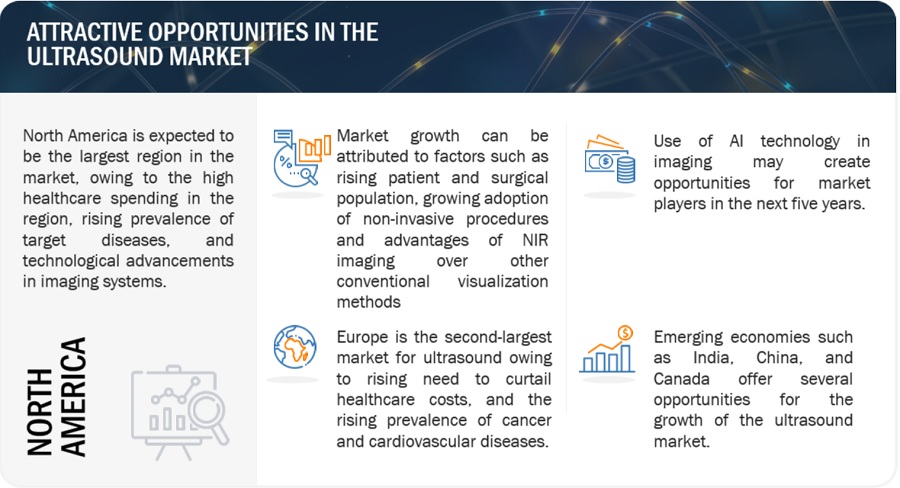
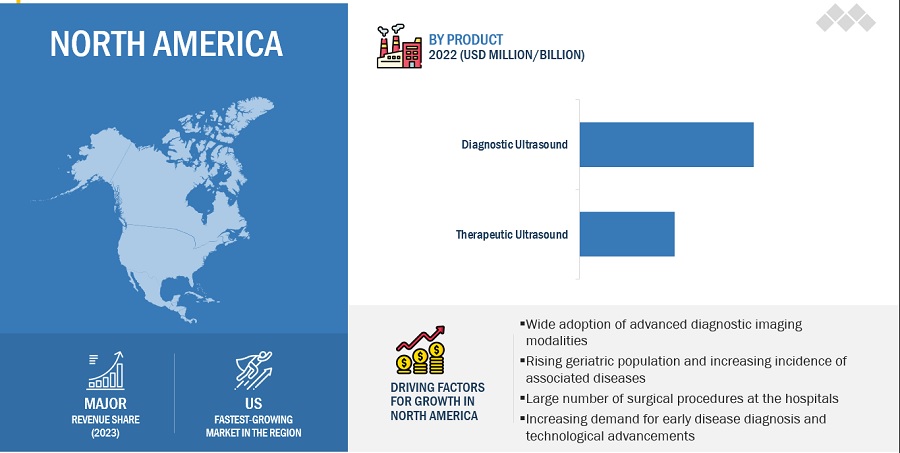
By region, North America is expected to be the largest region in the ultrasound industry during the forecast period

North America, comprising the US and Canada, accounted for the largest market share in 2022. The large share of ultrasound market can primarily be attributed to the high healthcare spending, rising geriatric population, the rising prevalence of target diseases, growing number of cosmetic surgeries, and rapid adoption of technologically advanced imaging systems.
Ultrasound Market by Region

To know about the assumptions considered for the study, download the pdf brochure

As of 2022, prominent players in the market are GE Healthcare (US), Koninklijke Philips N.V. (Netherlands), Canon Medical Systems Corporation (Japan), Siemens AG (Germany), Fujifilm Corporation (Japan), and Hologic, Inc. (US)

Scope of the Ultrasound Industry

Report Metric 

Details 

Market Revenue in 2023

$8.5 billion

Projected Revenue by 2028

$11.6 billion

Revenue Rate

Poised to Grow at a CAGR of 6.3%

Market Driver

Increasing prevalence of target diseases

Market Opportunity

Expanding applications of therapeutic ultrasound

This report has segmented the global ultrasound market to forecast revenue and analyze trends in each of the following submarkets:

By Technology

  • Diagnostic Ultrasound
    • 2D Ultrasound
    • 3D & 4D Ultrasound
    • Doppler Ultrasound
    • Contrast-Enhanced Ultrasound
  • Therapeutic Ultrasound
    • High-Intensity Focused Ultrasound (HIFU)
    • Extracorporeal Shockwave Lithotripsy (ESWL)

By Display

  • Color Ultrasound
  • Black and White Ultrasound

By Portability

  • Diagnostic Ultrasound
    • Trolly/ Cart based Ultrasound Systems
    • Compact/Handheld Ultrasound Systems
    • POC Ultrasound Systems

By Component

  • Transducers/Probes
    • Curvilinear/ Convex Array Probes
    • Linear Array Probes
    • Phased Array Probes
    • Other Probes
  • Workstations
  • Other Components

By Application

  • Radiology/General Imagin
  • OB/Gyn
  • Cardiology
  • Urology
  • Vascular
  • Orthopedic and Musculoskeletal
  • Pain Management
  • Other Applications

By End User

  • Hospital, Surgical Centers, Diagnostic Centers
  • Maternity Center
  • Ambulatory Centers
  • Research and Academia
  • Other End Users

By Region

  • North America
    • US
    • Canada
  • Europe
    • Germany
    • France
    • UK
    • Italy
    • Spain
    • Rest of Europe
  • Asia Pacific
    • Japan
    • China
    • India
    • Australia
    • South Korea
    • Rest of Asia Pacific
  • Latin America
    • Brazil
    • Mexico
    • Rest of Latin America
  • Middle East and Africa

Recent Developments of Ultrasound Industry

  • In February 2023, GE HealthCare has acquired Caption Health, thereby expanding the capabilities of ultrasound technology to assist new users through FDA-cleared, AI-powered image guidance. By leveraging Caption AI applications, ultrasound examinations can be streamlined, accelerating the process and empowering a wider range of healthcare professionals to perform fundamental echocardiogram exams.
  • In November 2022, Canon Inc. revealed its plans to form a new subsidiary called Canon Healthcare USA, Inc. With this strategic move, Canon intends to enhance its position within the influential American medical market and expedite the expansion of its medical business.
  • In April 2022, The enhanced partnership between GE HealthCare and Sinopharm focuses on the development and commercialization of medical equipment designed to meet the specific healthcare requirements of China.

Frequently Asked Questions (FAQ):

To speak to our analyst for a discussion on the above findings, click Speak to Analyst

TABLE OF CONTENTS
 
1 INTRODUCTION (Page No. - 20)
    1.1 STUDY OBJECTIVES 
    1.2 MARKET DEFINITION 
           1.2.1 INCLUSIONS AND EXCLUSIONS
    1.3 STUDY SCOPE 
           1.3.1 MARKETS COVERED
           1.3.2 REGIONS COVERED
           1.3.3 YEARS CONSIDERED
           1.3.4 CURRENCY CONSIDERED
    1.4 RESEARCH LIMITATIONS 
    1.5 STAKEHOLDERS 
    1.6 SUMMARY OF CHANGES 
 
2 RESEARCH METHODOLOGY (Page No. - 26)
    2.1 RESEARCH DATA 
          FIGURE 1 ULTRASOUND MARKET SIZE: RESEARCH DESIGN
           2.1.1 SECONDARY RESEARCH
           2.1.2 PRIMARY RESEARCH
                    2.1.2.1 Primary sources
                    2.1.2.2 Key industry insights
                    2.1.2.3 Breakdown of primaries
                                FIGURE 2 BREAKDOWN OF PRIMARY INTERVIEWS: SUPPLY- AND DEMAND-SIDE PARTICIPANTS
                                FIGURE 3 BREAKDOWN OF PRIMARY INTERVIEWS: BY COMPANY TYPE, DESIGNATION, AND REGION
    2.2 MARKET SIZE ESTIMATION 
          FIGURE 4 RESEARCH METHODOLOGY: HYPOTHESIS BUILDING
           2.2.1 BOTTOM-UP APPROACH
                    2.2.1.1 Approach 1: Company revenue estimation approach
                                FIGURE 5 MARKET SIZE ESTIMATION FOR ULTRASOUND INDUSTRY: APPROACH 1 (COMPANY REVENUE ESTIMATION)
                                FIGURE 6 REVENUE SHARE ANALYSIS: ILLUSTRATIVE EXAMPLE OF GE HEALTHCARE
                    2.2.1.2 Approach 2: Customer-based market estimation
                    2.2.1.3 market: Top-down approach
                    2.2.1.4 CAGR projection
                                FIGURE 7 CAGR PROJECTION: SUPPLY-SIDE ANALYSIS
    2.3 DATA VALIDATION APPROACH 
          FIGURE 8 DATA TRIANGULATION METHODOLOGY
    2.4 MARKET SHARE ASSESSMENT 
    2.5 STUDY ASSUMPTIONS 
    2.6 RISK ASSESSMENT 
           2.6.1 MARKET: RISK ASSESSMENT
    2.7 GROWTH RATE ASSUMPTIONS 
    2.8 MARKET: RECESSION IMPACT 
 
3 EXECUTIVE SUMMARY (Page No. - 39)
    FIGURE 9 ULTRASOUND MARKET SIZE, BY TECHNOLOGY, 2023 VS. 2028 (USD MILLION)
    FIGURE 10 ULTRASOUND INDUSTRY, BY APPLICATION, 2023 VS. 2028 (USD MILLION)
    FIGURE 11 MARKET, BY PORTABILITY, 2023 VS. 2028 (USD MILLION)
    FIGURE 12 MARKET, BY END USER, 2023 VS. 2028 (USD MILLION)
    FIGURE 13 GEOGRAPHICAL SNAPSHOT OF MARKET
 
4 PREMIUM INSIGHTS (Page No. - 43)
    4.1 ULTRASOUND MARKET OVERVIEW 
          FIGURE 14 INCREASING INCIDENCE OF TARGET DISEASES AND SUBSEQUENT RISE IN SURGICAL PROCEDURES TO DRIVE MARKET
    4.2 EUROPE: ULTRASOUND INDUSTRY, BY TECHNOLOGY (USD MILLION) 
          FIGURE 15 DIAGNOSTIC ULTRASOUND SEGMENT TO HOLD LARGEST SHARE
    4.3 ASIA PACIFIC: MARKET, BY END USER 
          FIGURE 16 HOSPITALS, SURGICAL CENTERS, AND DIAGNOSTIC CENTERS SEGMENT TO DOMINATE MARKET DURING FORECAST PERIOD
    4.4 MARKET, BY DISPLAY TYPE 
          FIGURE 17 COLOR ULTRASOUND SEGMENT TO COMMAND LARGEST SHARE TILL 2028
    4.5 GEOGRAPHIC SNAPSHOT OF MARKET 
          FIGURE 18 CHINA TO REGISTER HIGHEST GROWTH RATE DURING FORECAST PERIOD
 
5 MARKET OVERVIEW (Page No. - 46)
    5.1 INTRODUCTION 
    5.2 MARKET DYNAMICS 
          FIGURE 19 ULTRASOUND MARKET SIZE: DRIVERS, RESTRAINTS, OPPORTUNITIES,  AND CHALLENGES
           5.2.1 DRIVERS
                    5.2.1.1 Increasing incidence of target diseases and subsequent rise in surgical procedures
                    5.2.1.2 Growing patient preference for minimally invasive surgeries
                    5.2.1.3 Rising technological advancements in ultrasound devices
                    5.2.1.4 Growing public-private investments for product commercialization
                    5.2.1.5 Increasing establishment of hospitals and diagnostic centers
           5.2.2 RESTRAINTS
                    5.2.2.1 Unfavorable reimbursements
                    5.2.2.2 High operating costs
           5.2.3 OPPORTUNITIES
                    5.2.3.1 Growing applications of therapeutic ultrasound
                    5.2.3.2 High growth potential of emerging markets
                    5.2.3.3 Development of POC ultrasound systems
           5.2.4 CHALLENGES
                    5.2.4.1 Growing end-user preference for refurbished equipment
                    5.2.4.2 Shortage of skilled sonographers
    5.3 PORTER’S FIVE FORCES ANALYSIS 
          TABLE 1 ULTRASOUND INDUSTRY: PORTER’S FIVE FORCES ANALYSIS
           5.3.1 THREAT OF NEW ENTRANTS
           5.3.2 THREAT OF SUBSTITUTES
           5.3.3 BARGAINING POWER OF SUPPLIERS
           5.3.4 BARGAINING POWER OF BUYERS
           5.3.5 INTENSITY OF COMPETITIVE RIVALRY
    5.4 REGULATORY TRENDS 
    5.5 REGULATORY ANALYSIS 
           5.5.1 NORTH AMERICA
                    5.5.1.1 US
                                TABLE 2 US FDA: MEDICAL DEVICE CLASSIFICATION
                                TABLE 3 US: MEDICAL DEVICE REGULATORY APPROVAL PROCESS
                    5.5.1.2 Canada
                                TABLE 4 CANADA: MEDICAL DEVICE REGULATORY APPROVAL PROCESS
           5.5.2 EUROPE
           5.5.3 ASIA PACIFIC
                    5.5.3.1 Japan
                                TABLE 5 JAPAN: MEDICAL DEVICE CLASSIFICATION UNDER PMDA
                    5.5.3.2 China
                                TABLE 6 CHINA: CLASSIFICATION OF MEDICAL DEVICES
                    5.5.3.3 India
    5.6 REIMBURSEMENT SCENARIO 
          TABLE 7 MEDICAL REIMBURSEMENT CPT CODES FOR ULTRASOUND PROCEDURES IN US (AS OF 2021)
    5.7 ECOSYSTEM MAPPING 
    5.8 VALUE CHAIN ANALYSIS 
           5.8.1 RESEARCH & PRODUCT DEVELOPMENT
           5.8.2 RAW MATERIAL AND MANUFACTURING
           5.8.3 MARKETING & SALES, SHIPMENT, AND POST-SALES SERVICES
                    FIGURE 20 VALUE CHAIN ANALYSIS—MAXIMUM VALUE ADDED DURING MANUFACTURING PHASE
    5.9 SUPPLY CHAIN ANALYSIS 
           5.9.1 PROMINENT COMPANIES
           5.9.2 SMALL & MEDIUM-SIZED ENTERPRISES
           5.9.3 END USERS
                    TABLE 8 MARKET: SUPPLY CHAIN ECOSYSTEM
                    FIGURE 21 MARKET: SUPPLY CHAIN ANALYSIS
    5.10 PATENT ANALYSIS 
           FIGURE 22 PATENT DETAILS FOR ULTRASOUND (JANUARY 2013–JUNE 2023)
           FIGURE 23 PATENTS FOR DIAGNOSTIC ULTRASOUND SYSTEMS (JANUARY 2013–JUNE 2023)
           FIGURE 24 PATENTS FOR THERAPEUTIC ULTRASOUND SYSTEMS  (JANUARY 2013–JUNE 2023)
    5.11 TRADE ANALYSIS 
           5.11.1 MARKET: TRADE ANALYSIS
                     TABLE 9 IMPORT DATA FOR ULTRASOUND SYSTEMS (HS CODE 901812),  BY COUNTRY, 2018–2022 (USD)
                     TABLE 10 EXPORT DATA FOR ULTRASOUND SYSTEMS (HS CODE 901812),  BY COUNTRY, 2018–2022 (USD)
    5.12 KEY CONFERENCES AND EVENTS 
           TABLE 11 MARKET: LIST OF KEY CONFERENCES AND EVENTS (2023–2025)
    5.13 TECHNOLOGY ANALYSIS 
    5.14 CASE STUDY ANALYSIS 
           TABLE 12 CASE STUDY 1: MAINTAINING STRONG FOCUS ON TECHNOLOGICAL INNOVATION AND ADDRESSING REGULATORY COMPLIANCE
           TABLE 13 CASE STUDY 2: PROVIDING COMPREHENSIVE TRAINING PROGRAMS FOR EVOLVING ULTRASOUND TECHNIQUES
    5.15 PRICING ANALYSIS 
           TABLE 14 REGIONAL PRICE RANGE FOR ULTRASOUND SYSTEMS
 
6 ULTRASOUND MARKET SHARE, BY TECHNOLOGY (Page No. - 74)
    6.1 INTRODUCTION 
          TABLE 15 ULTRASOUND INDUSTRY, BY TECHNOLOGY, 2021–2028 (USD MILLION)
    6.2 DIAGNOSTIC ULTRASOUND 
          TABLE 16 DIAGNOSTIC ULTRASOUND MARKET SHARE, BY TYPE, 2021–2028 (USD MILLION)
          TABLE 17 DIAGNOSTIC MARKET, BY REGION, 2021–2028 (USD MILLION)
          TABLE 18 DIAGNOSTIC MARKET, BY DISPLAY TYPE, 2021–2028 (USD MILLION)
          TABLE 19 DIAGNOSTIC MARKET, BY PORTABILITY, 2021–2028 (USD MILLION)
          TABLE 20 DIAGNOSTIC MARKET, BY APPLICATION, 2021–2028 (USD MILLION)
          TABLE 21 DIAGNOSTIC ULTRASOUND INDUSTRY, BY END USER, 2021–2028 (USD MILLION)
           6.2.1 2D ULTRASOUND
                    6.2.1.1 Strong demand in emerging economies to drive market
                                TABLE 22 2D ULTRASOUND MARKET SHARE, BY REGION, 2021–2028 (USD MILLION)
           6.2.2 3D & 4D ULTRASOUND
                    6.2.2.1 Greater diagnostic accuracy and improved imaging capabilities to boost demand
                                TABLE 23 3D & 4D ULTRASOUND MARKETSHARE, BY REGION, 2021–2028 (USD MILLION)
           6.2.3 DOPPLER ULTRASOUND
                    6.2.3.1 Growing applications in pain management, cardiovascular imaging, and emergency care to drive market
                                TABLE 24 DOPPLER ULTRASOUND MARKETSHARE, BY REGION, 2021–2028 (USD MILLION)
           6.2.4 CONTRAST-ENHANCED ULTRASOUND
                    6.2.4.1 Availability of technologically advanced instruments to support growth
                                TABLE 25 CONTRAST-ENHANCED ULTRASOUND MARKET FORECAST, BY REGION, 2021–2028 (USD MILLION)
    6.3 THERAPEUTIC ULTRASOUND 
          TABLE 26 THERAPEUTIC ULTRASOUND MARKET FORECAST, BY TYPE, 2021–2028 (USD MILLION)
          TABLE 27 THERAPEUTIC MARKET, BY REGION, 2021–2028 (USD MILLION)
          TABLE 28 THERAPEUTIC MARKET, BY DISPLAY TYPE, 2021–2028 (USD MILLION)
          TABLE 29 THERAPEUTIC MARKET, BY PORTABILITY, 2021–2028 (USD MILLION)
          TABLE 30 THERAPEUTIC MARKET, BY APPLICATION, 2021–2028 (USD MILLION)
          TABLE 31 THERAPEUTIC ULTRASOUND INDUSTRY, BY END USER, 2021–2028 (USD MILLION)
           6.3.1 HIGH-INTENSITY FOCUSED ULTRASOUND
                    6.3.1.1 Promising results associated with HIFU in cancer treatment to drive market
                                TABLE 32 MARKET, BY REGION,  2021–2028 (USD MILLION)
           6.3.2 EXTRACORPOREAL SHOCKWAVE LITHOTRIPSY
                    6.3.2.1 Growing emphasis on minimally invasive treatment of kidney & gallbladder stones to drive demand for ESWL
                                TABLE 33 EXTRACORPOREAL SHOCKWAVE LITHOTRIPSY MARKET, BY REGION, 2021–2028 (USD MILLION)
 
7 ULTRASOUND MARKET FORECAST, BY DISPLAY (Page No. - 87)
    7.1 INTRODUCTION 
          TABLE 34 ULTRASOUND INDUSTRY, BY DISPLAY TYPE, 2021–2028 (USD MILLION)
    7.2 COLOR ULTRASOUND DEVICES 
           7.2.1 RISING AVAILABILITY OF ADVANCED COLOR ULTRASOUND DEVICES TO DRIVE MARKET
                    TABLE 35 COLOR ULTRASOUND DEVICES MARKET, BY REGION, 2021–2028 (USD MILLION)
    7.3 BLACK & WHITE ULTRASOUND DEVICES 
           7.3.1 ASIA PACIFIC REGION TO SHOW SUSTAINED DEMAND
                    TABLE 36 BLACK & WHITE ULTRASOUND DEVICES MARKET, BY REGION,  2021–2028 (USD MILLION)
 
8 ULTRASOUND MARKET FORECAST, BY PORTABILITY (Page No. - 91)
    8.1 INTRODUCTION 
          TABLE 37 ULTRASOUND INDUSTRY, BY PORTABILITY, 2021–2028 (USD MILLION)
    8.2 TROLLEY/CART-BASED ULTRASOUND SYSTEMS 
           8.2.1 RISING USAGE OF TROLLEY-BASED SYSTEMS IN ACUTE & EMERGENCY CARE TO DRIVE MARKET
                    TABLE 38 TROLLEY/CART-BASED ULTRASOUND SYSTEMS MARKET, BY REGION,  2021–2028 (USD MILLION)
    8.3 COMPACT/HANDHELD ULTRASOUND SYSTEMS 
           8.3.1 AFFORDABILITY AND PROCEDURAL & TECHNICAL BENEFITS TO DRIVE MARKET
                    TABLE 39 COMPACT/HANDHELD ULTRASOUND SYSTEMS MARKET, BY REGION, 2021–2028 (USD MILLION)
    8.4 POC ULTRASOUND SYSTEMS 
           8.4.1 IMPROVED OPERATIONAL AND CLINICAL EFFICACY TO BOOST DEMAND
                    TABLE 40 POC ULTRASOUND SYSTEMS MARKET, BY REGION, 2021–2028 (USD MILLION)
 
9 ULTRASOUND MARKET FORECAST, BY APPLICATION (Page No. - 96)
    9.1 INTRODUCTION 
          TABLE 41 ULTRASOUND INDUSTRY, BY APPLICATION, 2021–2028 (USD MILLION)
    9.2 RADIOLOGICAL/GENERAL IMAGING APPLICATIONS 
           9.2.1 GROWING NUMBER OF IMAGE-GUIDED SURGERIES TO DRIVE MARKET
                    TABLE 42 MARKET FOR RADIOLOGICAL/GENERAL IMAGING APPLICATIONS,  BY REGION, 2021–2028 (USD MILLION)
    9.3 CARDIOLOGICAL APPLICATIONS 
           9.3.1 RISING PREVALENCE OF CARDIAC DISORDERS TO DRIVE MARKET
                    TABLE 43 MARKET FOR CARDIOLOGICAL APPLICATIONS, BY REGION,  2021–2028 (USD MILLION)
    9.4 OBSTETRIC/GYNECOLOGICAL APPLICATIONS 
           9.4.1 WIDE USAGE IN OB/GYN APPLICATIONS TO BOOST GROWTH
                    TABLE 44 MARKET FOR OBSTETRIC/GYNECOLOGICAL APPLICATIONS, BY REGION,  2021–2028 (USD MILLION)
    9.5 UROLOGICAL APPLICATIONS 
           9.5.1 GROWING PREVALENCE OF UROLOGICAL DISORDERS TO SUPPORT MARKET
                    TABLE 45 MARKET FOR UROLOGICAL APPLICATIONS, BY REGION,  2021–2028 (USD MILLION)
    9.6 VASCULAR APPLICATIONS 
           9.6.1 VASCULAR APPLICATIONS TO WITNESS HIGH GROWTH
                    TABLE 46 MARKET FOR VASCULAR APPLICATIONS, BY REGION,  2021–2028 (USD MILLION)
    9.7 ORTHOPEDIC & MUSCULOSKELETAL APPLICATIONS 
           9.7.1 RISING PATIENT PREFERENCE FOR EARLY DIAGNOSIS TO DRIVE MARKET
                    TABLE 47 MARKET FOR ORTHOPEDIC & MUSCULOSKELETAL APPLICATIONS, BY REGION, 2021–2028 (USD MILLION)
    9.8 PAIN MANAGEMENT APPLICATIONS 
           9.8.1 INCREASING USE IN TRAUMA & EMERGENCY CARE TO SUPPORT MARKET GROWTH
                    TABLE 48 MARKET FOR PAIN MANAGEMENT APPLICATIONS, BY REGION,  2021–2028 (USD MILLION)
    9.9 OTHER APPLICATIONS 
          TABLE 49 MARKET FOR OTHER APPLICATIONS, BY REGION,  2021–2028 (USD MILLION)
 
10 ULTRASOUND MARKET SEGMENTATION, BY COMPONENT (Page No. - 105)
     10.1 INTRODUCTION 
             TABLE 50 ULTRASOUND INDUSTRY, BY COMPONENT, 2021–2028 (USD MILLION)
     10.2 TRANSDUCERS/PROBES 
             TABLE 51 ULTRASOUND TRANSDUCERS/PROBES MARKET, BY TYPE, 2021–2028 (USD MILLION)
             TABLE 52 ULTRASOUND TRANSDUCERS/PROBES MARKET, BY REGION,  2021–2028 (USD MILLION)
             10.2.1 CURVILINEAR/CONVEX ARRAYS
                        10.2.1.1 Growing adoption of POC ultrasound to support growth
                                      TABLE 53 CURVILINEAR/CONVEX ARRAYS MARKET, BY REGION, 2021–2028 (USD MILLION)
             10.2.2 LINEAR ARRAYS
                        10.2.2.1 Rising target patient population to drive market
                                      TABLE 54 LINEAR ARRAYS MARKET, BY REGION, 2021–2028 (USD MILLION)
             10.2.3 PHASED ARRAYS
                        10.2.3.1 Technological advancements to drive market
                                      TABLE 55 PHASED ARRAYS MARKET, BY REGION, 2021–2028 (USD MILLION)
             10.2.4 OTHER ARRAY TYPES
                        TABLE 56 OTHER ARRAY TYPES MARKET, BY REGION, 2021–2028 (USD MILLION)
     10.3 WORKSTATIONS 
             10.3.1 GROWING DIAGNOSTIC PROCEDURAL VOLUMES TO FUEL DEMAND FOR WORKSTATIONS
                        TABLE 57 ULTRASOUND WORKSTATIONS MARKET, BY REGION, 2021–2028 (USD MILLION)
     10.4 OTHER COMPONENTS 
             TABLE 58 OTHER ULTRASOUND COMPONENTS MARKET, BY TYPE, 2021–2028 (USD MILLION)
 
11 ULTRASOUND MARKET SEGMENTATION, BY END USER (Page No. - 112)
     11.1 INTRODUCTION 
             TABLE 59 ULTRASOUND INDUSTRY, BY END USER, 2021–2028 (USD MILLION)
     11.2 HOSPITALS, SURGICAL CENTERS, AND DIAGNOSTIC CENTERS 
             11.2.1 HIGH PROCEDURAL VOLUMES TO ENSURE SUSTAINED DEMAND FOR ULTRASOUND
                        TABLE 60 MARKET FOR HOSPITALS, SURGICAL CENTERS, AND DIAGNOSTIC CENTERS, BY REGION, 2021–2028 (USD MILLION)
     11.3 MATERNITY CENTERS 
             11.3.1 INCREASED ADOPTION OF ADVANCED ULTRASOUND FOR OB/GYN APPLICATIONS TO BOOST GROWTH
                        TABLE 61 MARKET FOR MATERNITY CENTERS, BY REGION,  2021–2028 (USD MILLION)
     11.4 AMBULATORY CARE CENTERS 
             11.4.1 INCREASING EMPHASIS ON AMBULATORY CARE TO SUPPORT MARKET GROWTH
                        TABLE 62 MARKET FOR AMBULATORY CARE CENTERS, BY REGION,  2021–2028 (USD MILLION)
     11.5 RESEARCH & ACADEMIA 
             11.5.1 GROWING AVAILABILITY OF RESEARCH GRANTS & FUNDING TO DRIVE GROWTH
                        TABLE 63 MARKET FOR RESEARCH & ACADEMIA, BY REGION,  2021–2028 (USD MILLION)
     11.6 OTHER END USERS 
             TABLE 64 MARKET FOR OTHER END USERS, BY REGION, 2021–2028 (USD MILLION)
 
12 ULTRASOUND MARKET SEGMENTATION, BY REGION (Page No. - 119)
     12.1 INTRODUCTION 
             TABLE 65 ULTRASOUND INDUSTRY, BY REGION, 2021–2028 (USD MILLION)
     12.2 NORTH AMERICA 
             FIGURE 25 NORTH AMERICA: ULTRASOUND MARKET SNAPSHOT
             TABLE 66 NORTH AMERICA: MARKET, BY COUNTRY, 2021–2028 (USD MILLION)
             TABLE 67 NORTH AMERICA: MARKET, BY TECHNOLOGY, 2021–2028 (USD MILLION)
             TABLE 68 NORTH AMERICA: DIAGNOSTIC-ULTRASOUND MARKET, BY TYPE,  2021–2028 (USD MILLION)
             TABLE 69 NORTH AMERICA: THERAPEUTIC-ULTRASOUND MARKET SEGMENTATION, BY TYPE,  2021–2028 (USD MILLION)
             TABLE 70 NORTH AMERICA: MARKET, BY DISPLAY TYPE, 2021–2028 (USD MILLION)
             TABLE 71 NORTH AMERICA: MARKET, BY PORTABILITY, 2021–2028 (USD MILLION)
             TABLE 72 NORTH AMERICA: MARKET, BY APPLICATION, 2021–2028 (USD MILLION)
             TABLE 73 NORTH AMERICA: MARKET, BY END USER, 2021–2028 (USD MILLION)
             12.2.1 US
                        12.2.1.1 Advanced healthcare infrastructure and favorable regulations to drive market
                                      TABLE 74 POCUS ULTRASOUND CPT CODES (2021)
                                      TABLE 75 US: ULTRASOUND MARKET, BY TECHNOLOGY, 2021–2028 (USD MILLION)
                                      TABLE 76 US: DIAGNOSTIC-ULTRASOUND MARKET, BY TYPE, 2021–2028 (USD MILLION)
                                      TABLE 77 US: THERAPEUTIC-ULTRASOUND MARKET, BY TYPE, 2021–2028 (USD MILLION)
             12.2.2 CANADA
                        12.2.2.1 Growing awareness about early disease diagnosis to drive market
                                      TABLE 78 CANADA: ULTRASOUND MARKET, BY TECHNOLOGY, 2021–2028 (USD MILLION)
                                      TABLE 79 CANADA: DIAGNOSTIC-ULTRASOUND MARKET, BY TYPE, 2021–2028 (USD MILLION)
                                      TABLE 80 CANADA: THERAPEUTIC-ULTRASOUND MARKET, BY TYPE, 2021–2028 (USD MILLION)
     12.3 EUROPE 
             TABLE 81 EUROPE: ULTRASOUND MARKET SEGMENTATION, BY COUNTRY, 2021–2028 (USD MILLION)
             TABLE 82 EUROPE: MARKET, BY TECHNOLOGY, 2021–2028 (USD MILLION)
             TABLE 83 EUROPE: DIAGNOSTIC-ULTRASOUND MARKET, BY TYPE, 2021–2028 (USD MILLION)
             TABLE 84 EUROPE: THERAPEUTIC-ULTRASOUND MARKET, BY TYPE, 2021–2028 (USD MILLION)
             TABLE 85 EUROPE: MARKET, BY DISPLAY TYPE, 2021–2028 (USD MILLION)
             TABLE 86 EUROPE: MARKET, BY PORTABILITY, 2021–2028 (USD MILLION)
             TABLE 87 EUROPE: MARKET, BY APPLICATION, 2021–2028 (USD MILLION)
             TABLE 88 EUROPE: ULTRASOUND INDUSTRY, BY END USER, 2021–2028 (USD MILLION)
             12.3.1 GERMANY
                        12.3.1.1 Increasing healthcare expenditure and government spending to drive market
                                      TABLE 89 GERMANY: ULTRASOUND MARKET PREDICTION, BY TECHNOLOGY, 2021–2028 (USD MILLION)
                                      TABLE 90 GERMANY: DIAGNOSTIC-ULTRASOUND MARKET, BY TYPE, 2021–2028 (USD MILLION)
                                      TABLE 91 GERMANY: THERAPEUTIC-ULTRASOUND MARKET, BY TYPE, 2021–2028 (USD MILLION)
             12.3.2 FRANCE
                        12.3.2.1 Increasing target patient population and rising number of diagnostic tests for chronic diseases to drive market
                                      TABLE 92 FRANCE: ULTRASOUND MARKET, BY TECHNOLOGY, 2021–2028 (USD MILLION)
                                      TABLE 93 FRANCE: DIAGNOSTIC-ULTRASOUND MARKET, BY TYPE, 2021–2028 (USD MILLION)
                                      TABLE 94 FRANCE: THERAPEUTIC-ULTRASOUND MARKET, BY TYPE, 2021–2028 (USD MILLION)
             12.3.3 UK
                        12.3.3.1 Growing government initiatives and increasing incidences of chronic diseases to drive market
                                      TABLE 95 UK: ULTRASOUND MARKET, BY TECHNOLOGY, 2021–2028 (USD MILLION)
                                      TABLE 96 UK: DIAGNOSTIC-ULTRASOUND MARKET, BY TYPE, 2021–2028 (USD MILLION)
                                      TABLE 97 UK: THERAPEUTIC-ULTRASOUND MARKET, BY TYPE, 2021–2028 (USD MILLION)
             12.3.4 ITALY
                        12.3.4.1 Increased availability of reimbursement coverage for diagnostic procedures to drive market
                                      TABLE 98 ITALY: ULTRASOUND MARKET PREDICTION, BY TECHNOLOGY, 2021–2028 (USD MILLION)
                                      TABLE 99 ITALY: DIAGNOSTIC-ULTRASOUND MARKET, BY TYPE, 2021–2028 (USD MILLION)
                                      TABLE 100 ITALY: THERAPEUTIC-ULTRASOUND MARKET, BY TYPE, 2021–2028 (USD MILLION)
             12.3.5 SPAIN
                        12.3.5.1 Increasing prevalence of cancer and growing private-public funding to drive market
                                      TABLE 101 SPAIN: ULTRASOUND MARKET, BY TECHNOLOGY, 2021–2028 (USD MILLION)
                                      TABLE 102 SPAIN: DIAGNOSTIC-ULTRASOUND MARKET, BY TYPE, 2021–2028 (USD MILLION)
                                      TABLE 103 SPAIN: THERAPEUTIC-ULTRASOUND MARKET, BY TYPE, 2021–2028 (USD MILLION)
             12.3.6 REST OF EUROPE
                        TABLE 104 REST OF EUROPE: ULTRASOUND MARKET, BY TECHNOLOGY, 2021–2028 (USD MILLION)
                        TABLE 105 REST OF EUROPE: DIAGNOSTIC-ULTRASOUND MARKET, BY TYPE,  2021–2028 (USD MILLION)
                        TABLE 106 REST OF EUROPE: THERAPEUTIC-ULTRASOUND MARKET, BY TYPE,  2021–2028 (USD MILLION)
     12.4 ASIA PACIFIC 
             FIGURE 26 ASIA PACIFIC: ULTRASOUND MARKET SNAPSHOT
             TABLE 107 ASIA PACIFIC: MARKET, BY COUNTRY, 2021–2028 (USD MILLION)
             TABLE 108 ASIA PACIFIC: MARKET, BY TECHNOLOGY, 2021–2028 (USD MILLION)
             TABLE 109 ASIA PACIFIC: DIAGNOSTIC-ULTRASOUND MARKET PREDICTION, BY TYPE, 2021–2028 (USD MILLION)
             TABLE 110 ASIA PACIFIC: THERAPEUTIC-ULTRASOUND MARKET, BY TYPE,  2021–2028 (USD MILLION)
             TABLE 111 ASIA PACIFIC: MARKET, BY DISPLAY TYPE, 2021–2028 (USD MILLION)
             TABLE 112 ASIA PACIFIC: MARKET, BY PORTABILITY, 2021–2028 (USD MILLION)
             TABLE 113 ASIA PACIFIC: MARKET, BY APPLICATION, 2021–2028 (USD MILLION)
             TABLE 114 ASIA PACIFIC: ULTRASOUND INDUSTRY, BY END USER, 2021–2028 (USD MILLION)
             12.4.1 CHINA
                        12.4.1.1 Increasing healthcare reforms and rising government investments to drive market
                                      TABLE 115 CHINA: ULTRASOUND MARKET, BY TECHNOLOGY, 2021–2028 (USD MILLION)
                                      TABLE 116 CHINA: DIAGNOSTIC-ULTRASOUND MARKET, BY TYPE, 2021–2028 (USD MILLION)
                                      TABLE 117 CHINA: THERAPEUTIC-ULTRASOUND MARKET, BY TYPE, 2021–2028 (USD MILLION)
             12.4.2 JAPAN
                        12.4.2.1 Fast adoption of advanced technologies and growth in geriatric population to drive market
                                      TABLE 118 JAPAN: ULTRASOUND MARKET, BY TECHNOLOGY, 2021–2028 (USD MILLION)
                                      TABLE 119 JAPAN: DIAGNOSTIC-ULTRASOUND MARKET, BY TYPE, 2021–2028 (USD MILLION)
                                      TABLE 120 JAPAN: THERAPEUTIC-ULTRASOUND MARKET, BY TYPE, 2021–2028 (USD MILLION)
             12.4.3 INDIA
                        12.4.3.1 Increasing number of diagnostic procedures and improving healthcare infrastructure to drive market
                                      TABLE 121 INDIA: ULTRASOUND MARKET PREDICTION, BY TECHNOLOGY, 2021–2028 (USD MILLION)
                                      TABLE 122 INDIA: DIAGNOSTIC-ULTRASOUND MARKET, BY TYPE, 2021–2028 (USD MILLION)
                                      TABLE 123 INDIA: THERAPEUTIC-ULTRASOUND MARKET, BY TYPE, 2021–2028 (USD MILLION)
             12.4.4 AUSTRALIA
                        12.4.4.1 Growing healthcare spending and increasing investments in research to drive market
                                      TABLE 124 AUSTRALIA: ULTRASOUND REIMBURSEMENT SCENARIO
                                      TABLE 125 AUSTRALIA: ULTRASOUND MARKET, BY TECHNOLOGY, 2021–2028 (USD MILLION)
                                      TABLE 126 AUSTRALIA: DIAGNOSTIC-ULTRASOUND MARKET, BY TYPE, 2021–2028 (USD MILLION)
                                      TABLE 127 AUSTRALIA: THERAPEUTIC-ULTRASOUND MARKET, BY TYPE, 2021–2028 (USD MILLION)
             12.4.5 SOUTH KOREA
                        12.4.5.1 Well-developed healthcare system and rising awareness of diseases to drive market
                                      TABLE 128 SOUTH KOREA: ULTRASOUND MARKET, BY TECHNOLOGY, 2021–2028 (USD MILLION)
                                      TABLE 129 SOUTH KOREA: DIAGNOSTIC-ULTRASOUND MARKET, BY TYPE,  2021–2028 (USD MILLION)
                                      TABLE 130 SOUTH KOREA: THERAPEUTIC-ULTRASOUND MARKET, BY TYPE,  2021–2028 (USD MILLION)
             12.4.6 REST OF ASIA PACIFIC
                        TABLE 131 REST OF ASIA PACIFIC: ULTRASOUND MARKET PREDICTION, BY TECHNOLOGY,  2021–2028 (USD MILLION)
                        TABLE 132 REST OF ASIA PACIFIC: DIAGNOSTIC-ULTRASOUND MARKET, BY TYPE,  2021–2028 (USD MILLION)
                        TABLE 133 REST OF ASIA PACIFIC: THERAPEUTIC-ULTRASOUND MARKET, BY TYPE,  2021–2028 (USD MILLION)
     12.5 LATIN AMERICA 
             TABLE 134 LATIN AMERICA: ULTRASOUND MARKET, BY COUNTRY, 2021–2028 (USD MILLION)
             TABLE 135 LATIN AMERICA: MARKET, BY TECHNOLOGY, 2021–2028 (USD MILLION)
             TABLE 136 LATIN AMERICA: DIAGNOSTIC ULTRASOUND MARKET, BY TYPE,  2021–2028 (USD MILLION)
             TABLE 137 LATIN AMERICA: THERAPEUTIC ULTRASOUND MARKET, BY TYPE,  2021–2028 (USD MILLION)
             TABLE 138 LATIN AMERICA: MARKET, BY DISPLAY TYPE, 2021–2028 (USD MILLION)
             TABLE 139 LATIN AMERICA: MARKET, BY PORTABILITY, 2021–2028 (USD MILLION)
             TABLE 140 LATIN AMERICA: MARKET, BY APPLICATION, 2021–2028 (USD MILLION)
             TABLE 141 LATIN AMERICA: ULTRASOUND INDUSTRY, BY END USER, 2021–2028 (USD MILLION)
             12.5.1 BRAZIL
                        12.5.1.1 Greater purchasing power and favorable demographic conditions to drive market
                                      TABLE 142 BRAZIL: ULTRASOUND MARKET, BY TECHNOLOGY, 2021–2028 (USD MILLION)
                                      TABLE 143 BRAZIL: DIAGNOSTIC-ULTRASOUND MARKET, BY TYPE, 2021–2028 (USD MILLION)
                                      TABLE 144 BRAZIL: THERAPEUTIC-ULTRASOUND MARKET, BY TYPE, 2021–2028 (USD MILLION)
             12.5.2 MEXICO
                        12.5.2.1 Increased medical tourism and better government healthcare initiatives to drive market
                                      TABLE 145 MEXICO: ULTRASOUND MARKET, BY TECHNOLOGY, 2021–2028 (USD MILLION)
                                      TABLE 146 MEXICO: DIAGNOSTIC-ULTRASOUND MARKET, BY TYPE, 2021–2028 (USD MILLION)
                                      TABLE 147 MEXICO: THERAPEUTIC-ULTRASOUND MARKET, BY TYPE, 2021–2028 (USD MILLION)
             12.5.3 REST OF LATIN AMERICA
                        TABLE 148 REST OF LATIN AMERICA: ULTRASOUND MARKET, BY TECHNOLOGY, 2021–2028 (USD MILLION)
                        TABLE 149 REST OF LATIN AMERICA: DIAGNOSTIC-ULTRASOUND MARKET, BY TYPE,  2021–2028 (USD MILLION)
                        TABLE 150 REST OF LATIN AMERICA: THERAPEUTIC-ULTRASOUND MARKET, BY TYPE,  2021–2028 (USD MILLION)
     12.6 MIDDLE EAST & AFRICA 
             12.6.1 GROWING MEDICAL TOURISM AND INCREASING QUALITY HEALTHCARE SYSTEMS TO DRIVE MARKET
                        TABLE 151 MIDDLE EAST & AFRICA: ULTRASOUND MARKET, BY TECHNOLOGY,  2021–2028 (USD MILLION)
                        TABLE 152 MIDDLE EAST & AFRICA: DIAGNOSTIC-ULTRASOUND MARKET, BY TYPE,  2021–2028 (USD MILLION)
                        TABLE 153 MIDDLE EAST & AFRICA: THERAPEUTIC-ULTRASOUND MARKET, BY TYPE,  2021–2028 (USD MILLION)
                        TABLE 154 MIDDLE EAST & AFRICA: MARKET, BY DISPLAY TYPE,  2021–2028 (USD MILLION)
                        TABLE 155 MIDDLE EAST & AFRICA: MARKET, BY PORTABILITY,  2021–2028 (USD MILLION)
                        TABLE 156 MIDDLE EAST & AFRICA: MARKET, BY APPLICATION,  2021–2028 (USD MILLION)
                        TABLE 157 MIDDLE EAST & AFRICA: ULTRASOUND INDUSTRY, BY END USER,  2021–2028 (USD MILLION)
 
13 COMPETITIVE LANDSCAPE (Page No. - 180)
     13.1 OVERVIEW 
     13.2 STRATEGIES ADOPTED BY KEY PLAYERS 
             13.2.1 OVERVIEW OF STRATEGIES ADOPTED BY PLAYERS IN ULTRASOUND MARKET
     13.3 REVENUE SHARE ANALYSIS 
             FIGURE 27 REVENUE SHARE ANALYSIS OF TOP PLAYERS IN ULTRASOUND INDUSTRY, 2022
     13.4 MARKET SHARE ANALYSIS 
             FIGURE 28 MARKET SHARE ANALYSIS OF TOP PLAYERS IN MARKET, 2022
             TABLE 158 MARKET: DEGREE OF COMPETITION
     13.5 COMPANY EVALUATION MATRIX FOR KEY PLAYERS (2022) 
             13.5.1 STARS
             13.5.2 EMERGING LEADERS
             13.5.3 PERVASIVE PLAYERS
             13.5.4 PARTICIPANTS
                        FIGURE 29 MARKET: COMPANY EVALUATION MATRIX  FOR KEY PLAYERS, 2022
     13.6 COMPANY EVALUATION MATRIX FOR START-UPS/SMES (2022) 
             13.6.1 PROGRESSIVE COMPANIES
             13.6.2 STARTING BLOCKS
             13.6.3 RESPONSIVE COMPANIES
             13.6.4 DYNAMIC COMPANIES
                        FIGURE 30 ULTRASOUND INDUSTRY: COMPANY EVALUATION MATRIX  FOR START-UPS/SMES, 2022
     13.7 COMPETITIVE BENCHMARKING 
             TABLE 159 PRODUCT AND REGIONAL FOOTPRINT ANALYSIS OF TOP PLAYERS
             TABLE 160 PRODUCT FOOTPRINT ANALYSIS
             TABLE 161 REGIONAL FOOTPRINT ANALYSIS
     13.8 COMPETITIVE SCENARIO AND TRENDS 
             TABLE 162 PRODUCT LAUNCHES, JANUARY 2020–JUNE 2023
             TABLE 163 DEALS, JANUARY 2020–JUNE 2023
             TABLE 164 OTHER DEVELOPMENTS, JANUARY 2020–JUNE 2023
 
14 COMPANY PROFILES (Page No. - 193)
     14.1 KEY PLAYERS 
(Business Overview, Products/Solutions/Services offered, Recent Developments, MnM View)*
             14.1.1 GE HEALTHCARE
                        TABLE 165 GE HEALTHCARE: COMPANY OVERVIEW
                        FIGURE 31 GE HEALTHCARE: COMPANY SNAPSHOT (2022)
             14.1.2 KONINKLIJKE PHILIPS N.V.
                        TABLE 166 KONINKLIJKE PHILIPS N.V.: COMPANY OVERVIEW
                        FIGURE 32 KONINKLIJKE PHILIPS N.V.: COMPANY SNAPSHOT (2022)
             14.1.3 CANON MEDICAL SYSTEMS CORPORATION
                        TABLE 167 CANON MEDICAL SYSTEMS CORPORATION: COMPANY OVERVIEW
                        FIGURE 33 CANON MEDICAL SYSTEMS CORPORATION: COMPANY SNAPSHOT (2022)
             14.1.4 SIEMENS AG
                        TABLE 168 SIEMENS AG: COMPANY OVERVIEW
                        FIGURE 34 SIEMENS AG: COMPANY SNAPSHOT (2022)
             14.1.5 FUJIFILM CORPORATION
                        TABLE 169 FUJIFILM CORPORATION: COMPANY OVERVIEW
                        FIGURE 35 FUJIFILM CORPORATION: COMPANY SNAPSHOT (2022)
             14.1.6 HOLOGIC, INC.
                        TABLE 170 HOLOGIC, INC.: COMPANY OVERVIEW
                        FIGURE 36 HOLOGIC, INC.: COMPANY SNAPSHOT (2022)
             14.1.7 SAMSUNG ELECTRONICS CO., LTD.
                        TABLE 171 SAMSUNG ELECTRONICS CO., LTD.: COMPANY OVERVIEW
                        FIGURE 37 SAMSUNG ELECTRONICS CO., LTD.: COMPANY SNAPSHOT (2021)
             14.1.8 MINDRAY BIO-MEDICAL ELECTRONICS CO., LTD.
                        TABLE 172 MINDRAY BIO-MEDICAL ELECTRONICS CO., LTD.: COMPANY OVERVIEW
                        FIGURE 38 MINDRAY BIO-MEDICAL ELECTRONICS CO., LTD.: COMPANY SNAPSHOT (2021)
             14.1.9 ESAOTE SPA
                        TABLE 173 ESAOTE SPA: COMPANY OVERVIEW
             14.1.10 CHISON MEDICAL TECHNOLOGIES CO., LTD.
                        TABLE 174 CHISON MEDICAL TECHNOLOGIES CO., LTD.: COMPANY OVERVIEW
             14.1.11 NEUSOFT CORPORATION
                        TABLE 175 NEUSOFT CORPORATION: COMPANY OVERVIEW
                        FIGURE 39 NEUSOFT CORPORATION: COMPANY SNAPSHOT (2022)
             14.1.12 MOBISANTE, INC.
                        TABLE 176 MOBISANTE, INC.: COMPANY OVERVIEW
             14.1.13 CLARIUS
                        TABLE 177 CLARIUS: COMPANY OVERVIEW
             14.1.14 MEDGYN PRODUCTS, INC.
                        TABLE 178 MEDGYN PRODUCTS, INC.: COMPANY OVERVIEW
             14.1.15 PROMED TECHNOLOGY CO., LTD.
                        TABLE 179 PROMED TECHNOLOGY CO., LTD.: COMPANY OVERVIEW
*Details on Business Overview, Products/Solutions/Services offered, Recent Developments, MnM View might not be captured in case of unlisted companies.
     14.2 OTHER COMPANIES 
             14.2.1 WHITE EAGLE SONIC TECHNOLOGIES, INC.
             14.2.2 TELEMED ULTRASOUND
             14.2.3 SHENZHEN RICSO TECHNOLOGY CO., LTD.
             14.2.4 GUANGDONG YOUKEY MEDICAL CO., LTD.
             14.2.5 ECHONOUS INC.
             14.2.6 SHENZHEN BIOCARE BIO-MEDICAL EQUIPMENT CO., LTD.
             14.2.7 SHANTOU INSTITUTE OF ULTRASONIC INSTRUMENTS CO., LTD. (SIUI)
             14.2.8 BUTTERFLY NETWORK, INC.
             14.2.9 ALPINION MEDICAL SYSTEMS CO., LTD.
             14.2.10 EDAN INSTRUMENTS, INC.
 
15 APPENDIX (Page No. - 251)
     15.1 DISCUSSION GUIDE 
     15.2 KNOWLEDGESTORE: MARKETSANDMARKETS’  SUBSCRIPTION PORTAL 
     15.3 CUSTOMIZATION OPTIONS 
     15.4 RELATED REPORTS 
     15.5 AUTHOR DETAILS 

The study involved four major activities in estimating the current size of the ultrasound market. Exhaustive secondary research was done to collect information on the market, peer, and parent markets. The next step was to validate these findings, assumptions, and sizing with industry experts across the value chain through primary research. Both top-down and bottom-up approaches were employed to estimate the complete market size. After that, market breakdown and data triangulation were used to estimate the market size of segments and subsegments.

Secondary Research

The secondary research process involves the widespread use of secondary sources, directories, databases (such as Bloomberg Businessweek, Factiva, and D&B Hoovers), white papers, annual reports, company house documents, investor presentations, and SEC filings of companies. Secondary research was used to identify and collect information useful for the extensive, technical, market-oriented, and commercial ultrasound market study. It was also used to obtain important information about the key players and market classification & segmentation according to industry trends to the bottom-most level, and key developments related to market and technology perspectives. A database of the key industry leaders was also prepared using secondary research.

Primary Research

In the primary research process, various supply and demand sources were interviewed to obtain qualitative and quantitative information for this report. The primary sources from the supply side include industry experts such as CEOs, vice presidents, marketing and sales directors, technology & innovation directors, and related key executives from various key companies and organizations in the ultrasound market. The primary sources from the demand side include hospitals, clinics, research labs, and pharmaceutical and biotechnology companies. Primary research was conducted to validate the market segmentation, identify key players, and gather insights on key industry trends & key market dynamics.

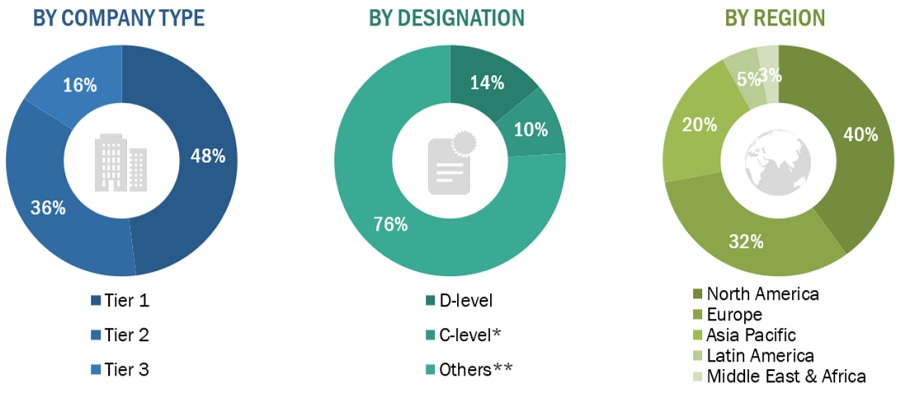
A breakdown of the primary respondents is provided below:
Ultrasound Market Size, and Share

*Others include sales managers, marketing managers, business development managers, product managers, distributors, and suppliers.

The tiers of the companies are defined based on their total revenue. As of 2022: Tier 1 => USD 1 billion, Tier 2 = USD 500 million to USD 1 billion, and Tier 3 =< USD 500 million

To know about the assumptions considered for the study, download the pdf brochure

Market Estimation Methodology

In this report, the ultrasound market’s size was determined using the revenue share analysis of leading players. For this purpose, key players in the market were identified, and their revenues from the market business were determined through various insights gathered during the primary and secondary research phases. Secondary research included the study of the annual and financial reports of the top market players. In contrast, primary research included extensive interviews with key opinion leaders, such as CEOs, directors, and key marketing executives.

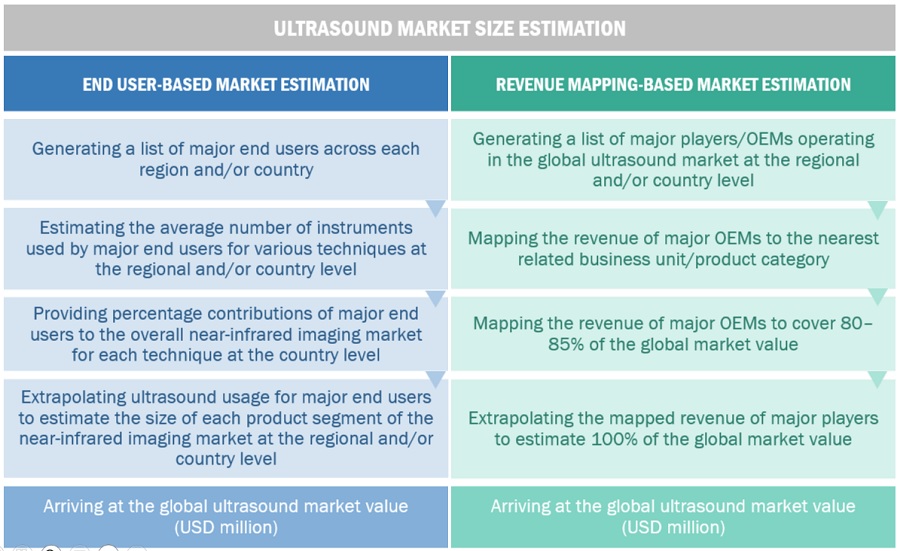
Segmental revenues were calculated based on the revenue mapping of major solution/service providers to calculate the global market value. This process involved the following steps:

  • Generating a list of major global players operating in the market.
  • Mapping annual revenues generated by major global players from the product segment (or nearest reported business unit/product category)
  • Revenue mapping of major players to cover a major share of the global market share, as of 2022
  • Extrapolating the global value of the market industry

Bottom-up approach

In this report, the size of the global ultrasound market was determined using the revenue share analysis of leading players. For this purpose, key players in the market were identified, and their revenues from the ultrasound business were determined through various insights gathered during the primary and secondary research phases. Secondary research included the study of the annual and financial reports of the top market players. In contrast, primary research included extensive interviews with key opinion leaders, such as CEOs, directors, and marketing executives.

Approach 1: Company revenue estimation approach

To calculate the global market value, segmental revenues were calculated based on the revenue mapping of major solution/product providers. This process involved the following steps:

  • Generating a list of major global players operating in the ultrasound market
  • Mapping the annual revenues generated by major global players from the ultrasound segment (or the nearest reported business unit/product category)
  • Mapping the revenues of major players to cover at least 80–85% of the global market share as of 2022
  • Extrapolating the global value of the ultrasound industry

Approach 2: Customer-based market estimation

During preliminary secondary research, the total sales revenue of ultrasound was estimated and validated at the regional and country level, triangulated, and validated to estimate the global market value. This process involved the following steps:

  • Generating a list of major customer facilities across each region and country
  • Identifying the average number of ultrasound product supplies used by major customer facilities across each product type at the regional/country level, annually
  • Identifying the percentage contribution of major customer facilities to the overall ultrasound expenditure and usage at the regional/country level, annually
  • Extrapolating the annual usage patterns for various products across major customer facilities to estimate the size of each product segment at the regional/country level, annually
  • Identifying the percentage contributions of individual market segments and subsegments to the overall ultrasound market at the regional/country level

Ultrasound Market Size Estimation: Bottom-Up Approach
Ultrasound Market Size, and Share

Source: MarketsandMarkets Analysis

To know about the assumptions considered for the study, Request for Free Sample Report

Data Triangulation

After arriving at the overall market size from the market size estimation process explained above, the global ultrasound market was split into segments and subsegments. Data triangulation and market breakdown procedures were employed to complete the overall market engineering process and arrive at the exact statistics for all segments and subsegments. The data was triangulated by studying various factors and trends from both the demand and supply sides. Additionally, the market was validated using top-down and bottom-up approaches.

Market Definition

Ultrasound, also known as sonography, is a medical imaging technique that utilizes high-frequency sound waves to produce real-time images of the internal structures of the body. It has become an essential diagnostic tool in healthcare due to its non-invasive nature, safety, versatility, and ability to provide real-time imaging. Ultrasound is widely used in obstetrics and gynecology for monitoring fetal development, assessing reproductive health, and guiding procedures such as amniocentesis. In addition, it plays a crucial role in cardiology for evaluating heart function and detecting abnormalities, in radiology for visualizing organs and tissues, and in emergency medicine for rapid assessment and guidance of interventions. The portability of ultrasound machines has further expanded its utility, allowing healthcare professionals to perform examinations at the patient's bedside, in rural areas, and in disaster response situations. With continuous technological advancements, including improved image quality, 3D/4D imaging, and advanced ultrasound-guided interventions, ultrasound has revolutionized medical practice, enabling accurate diagnoses, guiding interventions, and improving patient care across various medical disciplines.

Key Stakeholders

  • Ultrasound product manufacturers
  • Original equipment manufacturers (OEMs)
  • Suppliers, distributors, and channel partners
  • Healthcare service providers
  • Hospitals and academic medical centers
  • Radiologists
  • Research laboratories
  • Health insurance providers
  • Government bodies/organizations
  • Regulatory bodies
  • Medical research institutes
  • Business research and consulting service providers
  • Venture capitalists and other public-private funding agencies
  • Market research and consulting firms

Objectives of the Study

  • To define, describe, and forecast the ultrasound market based on technology, display, component, portability, application, end user, and region
  • To provide detailed information regarding the major factors influencing the growth of the market (drivers, restraints, opportunities, and challenges)
  • To strategically analyze micro markets with respect to individual growth trends, prospects, and contributions to the total market
  • To analyze opportunities in the market for stakeholders and provide details of the competitive landscape for market leaders
  • To forecast the revenue of the market segments with respect to four regions, namely, North America, Europe, the Asia Pacific, Latin America, Middle East and Africa
  • To profile the key players and comprehensively analyze their market ranking and core competencies
  • To benchmark players within the market using a proprietary competitive leadership mapping framework, which analyzes market players on various parameters within the broad categories of  market share and product footprint

Available Customizations

With the given market data, MarketsandMarkets offers customizations per the company’s specific needs. The following customization options are available for the present global ultrasound market report:

Product Analysis

  • Product matrix, which gives a detailed comparison of the product portfolios of the top five companies

Company Information

  • Detailed analysis and profiling of additional market players (up to five)

Geographic Analysis

  • Further breakdown of the Rest of Europe ultrasound market into Russia, Belgium, the Netherlands, Switzerland, Austria, Finland, Sweden, Poland, and Portugal, among others
  • Further breakdown of the Rest of Asia Pacific ultrasound market into Singapore, Taiwan, New Zealand, Philippines, Malaysia, and other APAC countries
  • Further breakdown of the Rest of Latin America (RoLATAM), which comprises Argentina, Chile, Peru, Colombia, and Cuba
  • Further breakdown of the RoW market into Latin America and MEA regions
Custom Market Research Services

We will customize the research for you, in case the report listed above does not meet with your exact requirements. Our custom research will comprehensively cover the business information you require to help you arrive at strategic and profitable business decisions.

Request Customization

Instant Answers with GPT - Ask Now!

Ask real questions. Get complete answers !
Report Code
MD 2885
Published ON
Aug, 2023
Choose License Type
BUY NOW
  • SHARE
X
Request Customization
Speak to Analyst
Speak to Analyst
OR FACE-TO-FACE MEETING
PERSONALIZE THIS RESEARCH
  • Triangulate with your Own Data
  • Get Data as per your Format and Definition
  • Gain a Deeper Dive on a Specific Application, Geography, Customer or Competitor
  • Any level of Personalization
REQUEST A FREE CUSTOMIZATION
LET US HELP YOU!
  • What are the Known and Unknown Adjacencies Impacting the Ultrasound Market
  • What will your New Revenue Sources be?
  • Who will be your Top Customer; what will make them switch?
  • Defend your Market Share or Win Competitors
  • Get a Scorecard for Target Partners
CUSTOMIZED WORKSHOP REQUEST
  • Call Us
  • +1-888-600-6441 (Corporate office hours)
  • +1-888-600-6441 (US/Can toll free)
  • +44-800-368-9399 (UK office hours)
CONNECT WITH US
ABOUT TRUST ONLINE
©2024 MarketsandMarkets Research Private Ltd. All rights reserved
DMCA.com Protection Status
Website Feedback