Wellness Supplements Market by Product (Dietary Supplements (Vitamin, Mineral, Protein, Herbal), Functional/Fortified Food & Beverages, Food Intolerance (Gluten-Free, Lactose-Free), Dermo-Cosmetic Skin Essentials (Anti-Acne)) - Global Forecast to 2020


The global Wellness Supplements market is expected to reach USD 249.4 Billion by 2020 from USD 183.1 Billion in 2015, at a CAGR of 6.4% during the forecast period. The growth of wellness supplement market is mainly driven by factors such as rising geriatric population, growing prevalence of chronic diseases, rising awareness about benefits of wellness supplements, rising healthcare costs, and shift of consumers from care to preventive. However, regulatory compliance is likely to restrain the growth of wellness supplement market to a certain extent.
The report segments the wellness supplements market based on products and region.
Based on products, the wellness supplements market is segmented into dietary supplements, functional/fortified food & beverages, food intolerance products and dermo-cosmetic essentials. The dietary supplements segment is expected to account for the largest share of the Wellness Supplements market, by product, in 2015. Factors driving growth in this segment rising geriatric population, include growing incidence of chronic diseases and increasing focus of consumers towards healthy lifestyles.
North America is expected to dominate the wellness supplements Market market in 2015, followed by Europe. However, Asia and the RoW regions are expected to grow at the highest CAGRs of 7.5% each during the forecast period. Factors such as rising aging population, growing cognizance and acceptance of wellness products, increasing disposable income levels, increasing focus towards healthier living, expansion of wellness supplement companies in these regions are likely to propel growth of this wellness supplements market.
The wellness supplements market is fragmented in nature, with several big and emerging players. Prominent players in the wellness supplements market include Nestle S.A. (Switzerland), Abbott Laboratories (U.S.), Amway (U.S.), Otsuka Holdings Co., Ltd. (Japan), Herbalife Ltd. (U.S.), Archer Daniels Midland Company (U.S.), Glanbia plc (Ireland), NBTY, Inc. (U.S.), GNC Holdings Inc. (U.S.), and Nu Skin Enterprises, Inc. (U.S.). Other players in the market include Grupo Omnilife (Mexico), Forever Living (U.S.), Pola, Inc. (Japan), Shaklee Corporation (U.S.), and Usana Health Sciences Inc. (U.S.).
Scope of the Report : Wellness Supplements Market
This report categorizes the wellness Supplements market into the following segments and sub-segments.
Wellness Supplements Market, by Product
-
Dietary Supplements
- Vitamin Supplements
- Mineral Supplements
- Protein Supplements
- Herbal Supplements
-
Fortified/Functional Food & Beverages
- Omega Fatty Acids Fortified Food
- Probiotic Fortified Food
- Branded Iodinated Salt
- Branded Wheat Flour
- Energy Drinks
- Sports Drinks
- Fortified Juices
-
Food Intolerance products
- Gluten-free Foods
- Lactose-free Foods
- Diabetic Foods
- Other Special Milk Formula
-
Dermo-Cosmetic Skin Essentials
- Anti-Aging Supplements
- Anti-Cellulite Supplements
- Anti-Acne Supplements
Wellness Supplements Market, by Region
-
North America Wellness Supplements Market
- U.S.
- Canada
-
Europe Wellness Supplements Market
- Germany Wellness Supplements Market
- France Wellness Supplements Market
- U.K. Wellness Supplements Market
- Italy Wellness Supplements Market
- Spain Wellness Supplements Market
-
Asia Wellness Supplements Market
- Japan Wellness Supplements Market
- China Wellness Supplements Market
- India Wellness Supplements Market
- Rest of the World (RoW) Wellness Supplements Market
Wellness Supplements Market Stakeholders:
- Wellness supplements manufacturers
- Wellness supplements vendors/providers
- Sports clubs, gyms, and fitness centers
- Research and development (R&D) companies
- Business research and consulting service providers
- Medical research laboratories
- Hospitals and dietetic associations
- Venture capitalists
- Research and consulting firms
Available Customizations
With the given market data, MarketsandMarkets offers customizations as per the company’s specific needs. The following customization options are available for the report:
Company Information
Detailed analysis and profiling of additional market players (up to 5)
Detailed Regulatory Landscape
Detailed regulatory landscape for any country included in this wellness supplements market report
Pricing Analysis
Pricing analysis for wellness supplement products such as dietary supplements, functional/fortified food & beverages, food intolerance products, and dermo-cosmetic skin essentials
The wellness supplements category is an aggregate of wellness food & beverage products and supplements. These supplements are taken in addition to a regular diet for enhanced nutrition and improved health. Wellness supplements market is experiencing remarkable growth due to growing aging population and related health concerns which propels the demand for nutritional supplements with proven health benefits. The growth of wellness supplements market is majorly driven by factors such as increasing focus on healthy lifestyles, increasing disposable incomes in emerging economies, and rising awareness about wellness products and shift from care to preventive health. However, high costs associated with wellness supplement products, lack of distinction from traditional food categories and changing regulatory policies are the factors limiting the growth of the wellness supplements market.
The global wellness supplements market is expected to reach USD 249.4 Billion by 2020 from USD 183.1 Billion in 2015 at a CAGR of 6.4% during the forecast period. The Wellness Supplements market is segmented based on products and region. Based on products, the wellness supplements market is segmented into dietary supplements, functional/fortified food & beverages, food intolerance products and dermo-cosmetic essentials.
The dietary supplements segment is expected to grow at the highest rate in the forecast period. The dietary supplements segment is further segmented into herbal supplements, vitamin supplements, protein supplements and mineral supplements. The herbal supplements market is estimated to hold largest share in the dietary supplements market in 2015. The growth in this segment can primarily be attributed to the increasing demand and acceptance of natural and organic products. However, protein supplements are expected to grow at the highest CAGR of 10.4% during the forecast period, owing to their rising demand among consumers belonging to all age groups.
The wellness supplements market is fragmented in nature, with several big and emerging players. There is no distinct leader in wellness supplement market as each product segment is dominated by a bunch of players. Thus, market players are focusing on adopting novel techniques to distinguish their products from those of their competitors, which makes the wellness supplements market highly competitive. Players are focusing on innovation in order to differentiate their product offerings in the market. Companies are also focusing on adopting various organic and inorganic strategies such as new product launches; expansions; acquisitions; and partnerships, agreements, and joint ventures to develop novel wellness supplement products, in order to improve their product offerings, satisfy customers’ needs, increase their profitability, and expand their market presence.
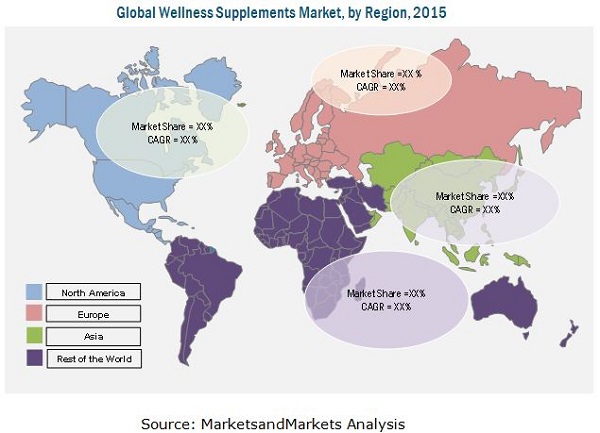
The wellness supplements market is dominated by North America, followed by Europe, Asia, and the Rest of the World. While North America is expected to dominate the market in 2015, Asia and Rest of the World are expected to grow at the highest CAGR during the forecast period. Factors such as rising aging population, growing cognizance and acceptance of wellness products, increasing disposable income levels, increasing focus towards healthy lifestyles, expansion of wellness supplement companies in these regions are likely to propel growth of wellness supplements market.
Prominent players in the wellness supplements market include Nestle S.A. (Switzerland), Abbott Laboratories (U.S.), Amway (U.S.), Otsuka Holdings Co., Ltd. (Japan), Herbalife Ltd. (U.S.), Archer Daniels Midland Company (U.S.), Glanbia plc (Ireland), NBTY, Inc. (U.S.), GNC Holdings Inc. (U.S.), and Nu Skin Enterprises, Inc. (U.S.). Other players in the market include Grupo Omnilife (Mexico), Forever Living (U.S.), Pola, Inc. (Japan), Shaklee Corporation (U.S.), and Usana Health Sciences Inc. (U.S.).
 Exclusive indicates content/data unique to MarketsandMarkets and not available with any competitors.
Table of Contents
1 Introduction (Page No. - 16)
1.1 Objectives of the Study
1.2 Market Definition
1.3 Market Scope
1.3.1 Markets Covered
1.3.2 Years Considered for the Study
1.4 Currency
1.5 Limitations
1.6 Stakeholders
2 Research Methodology (Page No. - 20)
2.1 Market Size Estimation
2.2 Market Breakdown and Data Triangulation
2.3 Primary Research
2.4 Secondary Research
2.4.1 Key Industry Insights
2.5 Assumptions for the Study
3 Executive Summary (Page No. - 28)
4 Premium Insights (Page No. - 31)
4.1 Wellness Supplements Market
4.2 Wellness Supplements Market, By Product
4.3 Geographical Snapshot of the Wellness Supplements Market
5 Market Overview (Page No. - 33)
5.1 Introduction
5.2 Wellness Supplements Market Segmentation
5.3 Wellness Supplements Market Dynamics
5.3.1 Drivers
5.3.1.1 Increasing Focus on Healthy Lifestyles
5.3.1.2 Growing Aging Population
5.3.1.3 Increasing Disposable Incomes in Developing Countries
5.3.1.4 Rising Awareness About Wellness Products and Shift From Care to Preventive Health
5.3.2 Market Restraints
5.3.2.1 Lack of Distinction From Traditional Food Categories
5.3.2.2 High Costs Associated With Wellness Supplements
5.3.3 Opportunities
5.3.3.1 Growth Potential Offered By Emerging Markets
5.3.3.2 Gradual Shift Towards Newer Technologies and Natural Products
5.3.3.3 Increasing Incidences of Health Disorders
5.3.4 Challenges
5.3.4.1 Regulatory Compliance Issues
6 Wellness Supplements Market, By Product (Page No. - 43)
6.1 Introduction
6.2 Dietary Supplements
6.2.1 Vitamin Supplements
6.2.2 Mineral Supplements
6.2.3 Protein Supplements
6.2.4 Herbal Supplements
6.3 Functional/Fortified Food & Beverages
6.3.1 Omega Fatty Acid Fortified Foods
6.3.2 Probiotic Fortified Food
6.3.3 Branded Iodinated Salt
6.3.4 Branded Wheat Flour
6.3.5 Energy Drinks
6.3.6 Sports Drinks
6.3.7 Fortified Juices
6.4 Food Intolerance Products
6.4.1 Gluten-Free Food
6.4.2 Lactose-Free Food
6.4.3 Diabetic Food
6.4.4 Other Special Milk Formulas
6.5 Dermo-Cosmetic Skin Essentials
6.5.1 Anti-Aging Supplements
6.5.2 Anti-Cellulite Supplements
6.5.3 Anti-Acne Supplements
7 Wellness Supplements Market, By Region (Page No. - 94)
7.1 Introduction
7.2 North America Wellness Supplements Market
7.2.1 U.S.
7.2.2 Canada
7.3 Europe Wellness Supplements Market
7.3.1 Germany
7.3.2 France
7.3.3 U.K.
7.3.4 Italy
7.3.5 Spain
7.4 Asia Wellness Supplements Market
7.4.1 Japan
7.4.2 China
7.4.3 India
7.5 RoW Wellness Supplements Market
8 Competitive Landscape (Page No. - 142)
8.1 Overview
8.2 Competitive Situation and Trends
8.2.1 New Product Launches
8.2.2 Expansions
8.2.3 Acquisitions
8.2.4 Partnerships, Agreements, and Joint Ventures
8.2.5 Other Developments
9 Company Profiles (Page No. - 148)
9.1 Introduction
(Business Overview, Products & Services, Key Insights, Recent Developments, SWOT Analysis, MnM View)*
9.2 Nestlé S.A.
9.3 Archer Daniels Midland Company
9.4 Abbott Laboratories
9.5 Otsuka Holdings Co. Ltd.
9.6 Amway
9.7 Glanbia PLC
9.8 Herbalife Ltd.
9.9 Nbty, Inc.
9.10 GNC Holdings Inc.
9.11 NU Skin Enterprises, Inc.
*Details on Business Overview, Products & Services, Key Insights, Recent Developments, SWOT Analysis, MnM View Might Not Be Captured in Case of Unlisted Companies.
10 Appendix (Page No. - 178)
10.1 Insights From Industry Experts
10.2 Discussion Guide
10.3 Other Developments, By Company, 2012-2014
10.4 Introducing RT: Real-Time Market Intelligence
10.5 Available Customizations
10.6 Related Reports
List of Tables (185 Tables)
Table 1 Increasing Focus on Healthy Lifestyles to Drive the Market Growth
Table 2 Lack of Distinction From Traditional Food Categories to Restrict the Growth of the Wellness Supplements Market
Table 3 Growth Potential Offered By Emerging Markets Will Provide Significant Growth Opportunities for the Players in Wellness Supplements Market
Table 4 Regulatory Compliance, A Major Challenge to the Growth of Wellness Supplements Market
Table 5 Wellness Supplements Market Size, By Product, 2013-2020 (USD Billion)
Table 6 Wellness Supplements Products Market Size, By Region, 2013-2020 (USD Billion)
Table 7 North America: Wellness Supplements Market, By Country, 2013-2020 (USD Billion)
Table 8 Europe: Wellness Supplements Market Size, By Country, 2013-2020 (USD Billion)
Table 9 Asia: Wellness Supplements Market Size, By Country, 2013-2020 (USD Billion)
Table 10 Dietary Supplements Market Size, By Type, 2013-2020 (USD Billion)
Table 11 Dietary Supplements Market Size, By Region, 2013-2020 (USD Billion)
Table 12 North America: Dietary Supplements Market Size, By Country, 2013-2020 (USD Billion)
Table 13 Europe: Dietary Supplements Market Size, By Country, 2013-2020 (USD Billion)
Table 14 Asia: Dietary Supplements Market Size, By Country, 2013-2020 (USD Billion)
Table 15 Vitamin Supplements Market Size, By Region, 2013-2020 (USD Billion)
Table 16 North America: Vitamin Supplements Market Size, By Country, 2013-2020 (USD Billion)
Table 17 Europe: Vitamin Supplements Market Size, By Country, 2013-2020 (USD Billion)
Table 18 Asia: Vitamin Supplements Market Size, By Country, 2013-2020 (USD Billion)
Table 19 Mineral Supplements Market Size, By Region, 2013-2020 (USD Billion)
Table 20 North America: Mineral Supplements Market Size, By Country, 2013-2020 (USD Billion)
Table 21 Europe: Mineral Supplements Market Size, By Country, 2013-2020 (USD Billion)
Table 22 Asia: Mineral Supplements Market Size, By Country, 2013-2020 (USD Billion)
Table 23 Protein Supplements Market Size, By Region, 2013-2020 (USD Billion)
Table 24 North America: Protein Supplements Market Size, By Country, 2013-2020 (USD Billion)
Table 25 Europe: Protein Supplements Market Size, By Country, 2013-2020 (USD Billion)
Table 26 Asia: Protein Supplements Market Size, By Country, 2013-2020 (USD Billion)
Table 27 Herbal Supplements Market Size, By Region, 2013-2020 (USD Billion)
Table 28 North America: Herbal Supplements Market Size, By Country, 2013-2020 (USD Billion)
Table 29 Europe: Herbal Supplements Market Size, By Country, 2013-2020 (USD Billion)
Table 30 Asia: Herbal Supplements Market Size, By Country, 2013-2020 (USD Billion)
Table 31 Functional/Fortified Food & Beverages Market Size, By Type, 2013-2020 (USD Billion)
Table 32 Functional/Fortified Food & Beverages Market Size, By Region, 2013-2020 (USD Billion)
Table 33 North America: Functional/Fortified Food & Beverages Market Size, By Country, 2013-2020 (USD Billion)
Table 34 Europe: Functional/Fortified Food & Beverages Market Size, By Country, 2013-2020 (USD Billion)
Table 35 Asia: Functional/Fortified Food & Beverages Market Size, By Country, 2013-2020 (USD Billion)
Table 36 Omega Fatty Acid Fortified Foods Market Size, By Region, 2013-2020 (USD Billion)
Table 37 North America: Omega Fatty Acid Fortified Foods Market Size, By Country, 2013-2020 (USD Billion)
Table 38 Europe: Omega Fatty Acid Fortified Foods Market Size, By Country, 2013-2020 (USD Billion)
Table 39 Asia: Omega Fatty Acid Fortified Foods Market Size, By Country, 2013-2020 (USD Billion)
Table 40 Probiotic Fortified Food Market Size, By Region, 2013-2020 (USD Billion)
Table 41 North America: Probiotic Fortified Food Market Size, By Country, 2013-2020 (USD Billion)
Table 42 Europe: Probiotic Fortified Food Market Size, By Country, 2013-2020 (USD Billion)
Table 43 Asia: Probiotic Fortified Food Market Size, By Country, 2013-2020 (USD Billion)
Table 44 Branded Iodinated Salt Market Size, By Region, 2013-2020 (USD Billion)
Table 45 North America: Branded Iodinated Salt Market Size, By Country, 2013-2020 (USD Billion)
Table 46 Europe: Branded Iodinated Salt Market Size, By Country, 2013-2020 (USD Billion)
Table 47 Asia: Branded Iodinated Salt Market Size, By Country, 2013-2020 (USD Billion)
Table 48 Branded Wheat Flour Market Size, By Region, 2013-2020 (USD Billion)
Table 49 North America: Branded Wheat Flour Market Size, By Country, 2013-2020 (USD Billion)
Table 50 Europe: Branded Wheat Flour Market Size, By Country, 2013-2020 (USD Billion)
Table 51 Asia: Branded Wheat Flour Market Size, By Country, 2013-2020 (USD Billion)
Table 52 Energy Drinks Market Size, By Region, 2013-2020 (USD Billion)
Table 53 North America: Energy Drinks Market Size, By Country, 2013-2020 (USD Billion)
Table 54 Europe: Energy Drinks Market Size, By Country, 2013-2020 (USD Billion)
Table 55 Asia: Energy Drinks Market Size, By Country, 2013-2020 (USD Billion)
Table 56 Sports Drinks Market Size, By Region, 2013-2020 (USD Billion)
Table 57 North America: Sports Drinks Market Size, By Country, 2013-2020 (USD Billion)
Table 58 Europe: Sports Drinks Market Size, By Country, 2013-2020 (USD Billion)
Table 59 Asia: Sports Drinks Market Size, By Country, 2013-2020 (USD Billion)
Table 60 Fortified Juices Market Size, By Region, 2013-2020 (USD Billion)
Table 61 Europe: Fortified Juices Market Size, By Country, 2013-2020 (USD Billion)
Table 62 Asia: Fortified Juices Market Size, By Country, 2013-2020 (USD Billion)
Table 63 Food Intolerance Products Market Size, By Type, 2013-2020 (USD Billion)
Table 64 Food Intolerance Products Market Size, By Region, 2013-2020 (USD Billion)
Table 65 North America: Food Intolerance Products Market Size, By Country, 2013-2020 (USD Billion)
Table 66 Europe: Food Intolerance Products Market Size, By Country, 2013-2020 (USD Billion)
Table 67 Asia: Food Intolerance Products Market Size, By Country, 2013-2020 (USD Billion)
Table 68 Gluten-Free Food Market Size, By Region, 2013-2020 (USD Billion)
Table 69 North America: Gluten-Free Food Market Size, By Country, 2013-2020 (USD Billion)
Table 70 Europe: Gluten-Free Food Market Size, By Country, 2013-2020 (USD Billion)
Table 71 Asia: Gluten-Free Food Market Size, By Country, 2013-2020 (USD Billion)
Table 72 Lactose -Free Food Size, By Region, 2013-2020 (USD Billion)
Table 73 North America: Lactose -Free Food Market Size, By Country, 2013-2020 (USD Billion)
Table 74 Europe: Lactose -Free Food Market Size, By Country, 2013-2020 (USD Billion)
Table 75 Asia: Lactose -Free Food Market Size, By Country, 2013-2020 (USD Billion)
Table 76 Diabetic Food Market Size, By Region, 2013-2020 (USD Billion)
Table 77 North America: Diabetic Food Market Size, By Country, 2013-2020 (USD Billion)
Table 78 Europe: Diabetic Food Market Size, By Country, 2013-2020 (USD Billion)
Table 79 Asia: Diabetic Food Market Size, By Country, 2013-2020 (USD Billion)
Table 80 Other Special Milk Formulas Market Size, By Region, 2013-2020 (USD Billion)
Table 81 North America: Other Special Milk Formulas Market Size, By Country, 2013-2020 (USD Billion)
Table 82 Europe: Other Special Milk Formulas Market Size, By Country, 2013-2020 (USD Billion)
Table 83 Asia: Other Special Milk Formulas Market Size, By Country, 2013-2020 (USD Billion)
Table 84 Dermo-Cosmetic Skin Essentials Market Size, By Type,2013-2020 (USD Billion)
Table 85 Dermo-Cosmetic Skin Essentials Market Size, By Region, 2013-2020 (USD Billion)
Table 86 North America: Dermo-Cosmetic Skin Essentials Market Size, By Country, 2013-2020 (USD Billion)
Table 87 Europe: Dermo-Cosmetic Skin Essentials Market Size, By Country, 2013-2020 (USD Billion)
Table 88 Asia: Dermo-Cosmetic Skin Essentials Market Size, By Country, 2013-2020 (USD Billion)
Table 89 Anti-Aging Supplements Market Size, By Region, 2013-2020 (USD Billion)
Table 90 North America: Anti-Aging Supplements Market Size, By Country, 2013-2020 (USD Billion)
Table 91 Europe: Anti-Aging Supplements Market Size, By Country, 2013-2020 (USD Billion)
Table 92 Asia: Anti-Aging Supplements Market Size, By Country, 2013-2020 (USD Billion)
Table 93 Anti-Cellulite Supplements Size, By Region, 2013-2020 (USD Billion)
Table 94 North America: Anti-Cellulite Supplements Market Size, By Country, 2013-2020 (USD Billion)
Table 95 Europe: Anti-Cellulite Supplements Market Size, By Country, 2013-2020 (USD Billion)
Table 96 Asia: Anti-Cellulite Supplements Market Size, By Country, 2013-2020 (USD Billion)
Table 97 Anti-Acne Supplements Market Size, By Region, 2013-2020 (USD Billion)
Table 98 North America: Anti-Acne Supplements Market Size, By Country,2013-2020 (USD Billion)
Table 99 Europe: Anti-Acne Supplements Market Size, By Country, 2013-2020 (USD Billion)
Table 100 Asia: Anti-Acne Supplements Market Size, By Country, 2013-2020 (USD Billion)
Table 101 Wellness Supplements Market Size, By Product, 2013-2020 (USD Billion)
Table 102 Wellness Supplements Market Size, By Region, 2013-2020 (USD Billion)
Table 103 North America: Wellness Supplements Market, By Country, 2013-2020 (USD Billion)
Table 104 Europe: Wellness Supplements Market Size, By Country,2013-2020 (USD Billion)
Table 105 Asia: Wellness Supplements Market, By Country, 2013-2020 (USD Billion)
Table 106 North America: Wellness Supplements Market Size, By Product, 2013-2020 (USD Billion)
Table 107 North America: Dietary Supplements Market Size, By Type, 2013-2020 (USD Billion)
Table 108 North America: Functional/Fortified Food & Beverages Market Size, By Type, 2013-2020 (USD Billion)
Table 109 North America: Food Intolerance Products Market Size, By Type, 2013-2020 (USD Billion)
Table 110 North America: Dermo-Cosmetic Skin Essentials Market Size, By Type, 2013-2020 (USD Billion)
Table 111 U.S.: Wellness Supplements Market Size, By Product,2013-2020 (USD Billion)
Table 112 U.S.: Dietary Supplements Market Size, By Type, 2013-2020 (USD Billion)
Table 113 U.S. Functional/Fortified Food & Beverages Market Size, By Type, 2013-2020 (USD Billion)
Table 114 U.S.: Food Intolerance Products Market Size, By Type, 2013-2020 (USD Billion)
Table 115 U.S.: Dermo-Cosmetic Skin Essentials Market Size, By Type, 2013-2020 (USD Billion)
Table 116 Canada: Wellness Supplements Market Size, By Product, 2013-2020 (USD Billion)
Table 117 Canada: Dietary Supplements Market Size, By Type, 2013-2020 (USD Billion)
Table 118 Canada: Functional/Fortified Food & Beverages Market Size, By Type, 2013-2020 (USD Billion)
Table 119 Canada: Food Intolerance Products Market Size, By Type, 2013-2020 (USD Billion)
Table 120 Canada: Dermo-Cosmetic Skin Essentials Market Size, By Type, 2013-2020 (USD Billion)
Table 121 Europe: Wellness Supplements Market Size, By Product, 2013-2020 (USD Billion)
Table 122 Europe: Dietary Supplements Market Size, By Type, 2013-2020 (USD Billion)
Table 123 Europe: Functional/Fortified Food & Beverages Market Size, By Type, 2013-2020 (USD Billion)
Table 124 Europe: Food Intolerance Products Market Size, By Type, 2013-2020 (USD Billion)
Table 125 Europe: Dermo-Cosmetic Skin Essentials Market Size, By Type, 2013-2020 (USD Billion)
Table 126 Germany: Wellness Supplements Product Market Size, By Product, 2013-2020 (USD Billion)
Table 127 Germany: Dietary Supplements Market Size, By Type, 2013-2020 (USD Billion)
Table 128 Germany: Functional/Fortified Food & Beverages Market Size, By Type, 2013-2020 (USD Billion)
Table 129 Germany: Food Intolerance Products Market Size, By Type, 2013-2020 (USD Billion)
Table 130 Germany: Dermo-Cosmetic Skin Essentials Market Size, By Type, 2013-2020 (USD Billion)
Table 131 France: Wellness Supplements Market Size, By Product, 2013-2020 (USD Billion)
Table 132 France: Dietary Supplements Market Size, By Type,2013-2020 (USD Billion)
Table 133 France: Functional/Fortified Food & Beverages Market Size, By Type, 2013-2020 (USD Billion)
Table 134 France: Food Intolerance Products Market Size, By Type, 2013-2020 (USD Billion)
Table 135 France: Dermo-Cosmetic Skin Essentials Market Size, By Type, 2013-2020 (USD Billion)
Table 136 U.K.: Wellness Supplements Product Market Size, By Product,2013-2020 (USD Billion)
Table 137 U.K.: Dietary Supplements Market Size, By Type, 2013-2020 (USD Billion)
Table 138 U.K.: Functional/Fortified Food & Beverages Market Size, By Type, 2013-2020 (USD Billion)
Table 139 U.K.: Food Intolerance Products Market Size, By Type, 2013-2020 (USD Billion)
Table 140 U.K.: Dermo-Cosmetic Skin Essentials Market Size, By Type, 2013-2020 (USD Billion)
Table 141 Italy: Wellness Supplements Product Market Size, By Product, 2013-2020 (USD Billion)
Table 142 Italy: Dietary Supplements Market Size, By Type, 2013-2020 (USD Billion)
Table 143 Italy: Functional/Fortified Food & Beverages Market Size, By Type, 2013-2020 (USD Billion)
Table 144 Italy: Food Intolerance Products Market Size, By Type, 2013-2020 (USD Billion)
Table 145 Italy: Dermo-Cosmetic Skin Essentials Market Size, By Type, 2013-2020 (USD Billion)
Table 146 Spain: Wellness Supplements Product Market Size, By Product, 2013-2020 (USD Billion)
Table 147 Spain: Dietary Supplements Market Size, By Type, 2013-2020 (USD Billion)
Table 148 Spain: Functional/Fortified Food & Beverages Market Size, By Type, 2013-2020 (USD Billion)
Table 149 Spain: Food Intolerance Products Market Size, By Type, 2013-2020 (USD Billion)
Table 150 Spain: Dermo-Cosmetic Skin Essentials Market Size, By Type, 2013-2020 (USD Billion)
Table 151 Asia: Wellness Supplements Product Market Size, By Product, 2013-2020 (USD Billion)
Table 152 Asia: Dietary Supplements Market Size, By Type, 2013-2020 (USD Billion)
Table 153 Asia: Functional/Fortified Food & Beverages Market Size, By Type, 2013-2020 (USD Billion)
Table 154 Asia: Food Intolerance Products Market Size, By Type, 2013-2020 (USD Billion)
Table 155 Asia: Dermo-Cosmetic Skin Essentials Market Size, By Type, 2013-2020 (USD Billion)
Table 156 Japan: Wellness Supplements Product Market Size, By Product, 2013-2020 (USD Billion)
Table 157 Japan: Dietary Supplements Market Size, By Type, 2013-2020 (USD Billion)
Table 158 Japan: Functional/Fortified Food & Beverages Market Size, By Type, 2013-2020 (USD Billion)
Table 159 Japan: Food Intolerance Products Market Size, By Type, 2013-2020 (USD Billion)
Table 160 Japan: Dermo-Cosmetic Skin Essentials Market Size, By Type, 2013-2020 (USD Billion)
Table 161 China: Wellness Supplements Product Market Size, By Product, 2013-2020 (USD Billion)
Table 162 China: Dietary Supplements Market Size, By Type, 2013-2020 (USD Billion)
Table 163 China: Functional/Fortified Food & Beverages Market Size, By Type, 2013-2020 (USD Billion)
Table 164 China: Food Intolerance Products Market Size, By Type, 2013-2020 (USD Billion)
Table 165 China: Dermo-Cosmetic Skin Essentials Market Size, By Type, 2013-2020 (USD Billion)
Table 166 India: Wellness Supplements Product Market Size, By Product, 2013-2020 (USD Billion)
Table 167 India: Dietary Supplements Market Size, By Type, 2013-2020 (USD Billion)
Table 168 India: Functional/Fortified Food & Beverages Market Size, By Type, 2013-2020 (USD Billion)
Table 169 India: Food Intolerance Products Market Size, By Type, 2013-2020 (USD Billion)
Table 170 India: Dermo-Cosmetic Skin Essentials Market Size, By Type, 2013-2020 (USD Billion)
Table 171 Rest of the World: Wellness Supplements Product Market Size,By Product, 2013-2020 (USD Billion)
Table 172 Rest of the World: Dietary Supplements Market Size, By Type, 2013-2020 (USD Billion)
Table 173 Rest of the World: Functional/Fortified Food & Beverages Market Size, By Type, 2013-2020 (USD Billion)
Table 174 Rest of the World: Food Intolerance Products Market Size, By Type, 2013-2020 (USD Billion)
Table 175 Rest of the World: Dermo-Cosmetic Skin Essentials Market Size, By Type, 2013-2020 (USD Billion)
Table 176 New Product Launches, 2010–2015
Table 177 Expansions, 2010–2015
Table 178 Acquisitions, 2010–2015
Table 179 Partnerships, Agreements, and Joint Ventures, 2010–2015
Table 180 Other Developments, 2010–2015
Table 181 Nestle S.A.
Table 182 Abbott Laboratories
Table 183 Otsuka Pharmaceutical Co. Ltd.
Table 184 Herbalife, Ltd
Table 185 Nbty, Inc.
List of Figures (40 Figures)
Figure 1 Research Design
Figure 2 Wellness Supplements Market Size Estimation: Bottom-Up Approach
Figure 3 Wellness Supplements Market Size Estimation: Top-Down Approach
Figure 4 Data Triangulation Methodology
Figure 5 Key Data From Primary Sources
Figure 6 Breakdown of Primary Interviews: By Company Type, Designation, and Region
Figure 7 Key Data From Secondary Sources
Figure 8 Dietary Supplements Segment to Dominate the Global Wellness Supplements Market in 2015
Figure 9 Protein Supplements to Grow at the Highest CAGR During the Forecast Period
Figure 10 North America is Expected to Hold the Largest Share in 2015, While Asia & RoW Poised to Witness Highest Growth Rate Between 2015 & 2020
Figure 11 Rising Awareness of Wellness Supplements to Boost Market Growth During the Forecast Period
Figure 12 Herbal Supplements Segment to Account for the Largest Share of the Dietary Supplements Market in 2015
Figure 13 Omega Fatty Acids Fortified Food Segment to Command the Largest Share of the Functional/Fortified Food & Beverages Market in 2015
Figure 14 Asia & RoW Regions to Witness Higher Growth Rate in the Forecast Period
Figure 15 Wellness Supplements Market Segmentation, By Product
Figure 16 Wellness Supplements Market Segmentation, By Region
Figure 17 Wellness Supplements Market: Drivers, Restraints, Opportunities, and Challenges
Figure 18 Dietary Supplements Segment to Grow at Highest CAGR During the Forecast Period
Figure 19 Wellness Supplements Products Market, By Region: Asia and RoW to Grow Faster Than North America and Europe (2015-2020)
Figure 20 Herbal Supplements to Dominate the Dietary Supplements Market in 2015
Figure 21 Omega Fatty Acid Fortified Food to Witness Highest Growth During Forecast Period
Figure 22 Gluten-Free Foods to Dominate the Food Intolerance Products Market in 2015
Figure 23 Anti - Acne Supplements is the Fastest Growing Market in Forecast Period
Figure 24 North America to Hold the Largest Share of the Global Wellness Supplements Market (2015)
Figure 25 European Wellness Supplements Market Snapshot (2015)
Figure 26 Asia to Grow at the Highest CAGR During the Forecast Period
Figure 27 RoW Wellness Supplements Market Snapshot (2015)
Figure 28 Key Players Adopted Organic as Well as Inorganic Growth Strategies Between 2010 and 2015
Figure 29 Wellness Supplements Market Evolution Framework
Figure 30 Battle for Wellness Supplements Market Share: New Product Launches Was the Key Strategy Adopted By Market Players Between 2010 to 2015
Figure 31 Geographic Revenue Mix for the Top 5 Players in the Wellness Supplements Market
Figure 32 Nestlé S.A.: Company Snapshot
Figure 33 Archer Daniels Midland Company: Company Snapshot
Figure 34 Abbott Laboratories: Company Snapshot
Figure 35 Otsuka Holdings Co. Ltd.: Company Snapshot
Figure 36 Glanbia PLC: Company Snapshot
Figure 37 Herbalife Ltd.: Company Snapshot
Figure 38 Nbty, Inc.: Company Snapshot
Figure 39 GNC Holdings Inc.: Company Snapshot
Figure 40 NU Skin Enterprises, Inc.: Company Snapshot

 Generating Response ...


Growth opportunities and latent adjacency in Wellness Supplements Market