Transparent Display Market by Product (HUD, HMD, Digital Signage, Smart Appliance), Vertical (Retail & Hospitality, Industrial, Aerospace & Defense, Automotive & Transportation), Display Size, Resolution, Technology, and Geography - Global Forecast to 2025-2035


The transparent display market was valued at USD 3.30 billion in 2024 and is estimated to reach USD 65.00 billion by 2035, at a CAGR of 31.1% between 2025 and 2035.
The global transparent display market is driven by the increasing integration of advanced visualization technologies across various applications, including retail, automotive, and industrial sectors. The rising demand for transparent OLED and LCD panels in digital signage, head-up displays (HUDs), and smart consumer devices is driving market expansion. The technology’s ability to deliver interactive, see-through visuals without obstructing background visibility is enabling new design possibilities in advertising, augmented reality interfaces, and next-generation vehicle dashboards. Advancements in materials, brightness control, and touch-enabled transparency are further enhancing product performance and user engagement. Overall, the market is experiencing strong innovation momentum, with manufacturers emphasizing energy-efficient designs, scalability, and cost optimization to support broader adoption across commercial and consumer environments.

Transparent display technology is increasingly utilized across sectors such as retail, automotive, aerospace, and healthcare, where its see-through visualization capabilities enhance information display and user interaction. The technology enables dynamic content integration without obstructing background visibility, supporting applications like digital signage, head-up displays, and smart glass systems. Manufacturers are advancing transparent OLED and LCD technologies, focusing on improved brightness, color accuracy, and durability to expand adoption across commercial and industrial environments.
Market by Technology
LCD
LCD-based transparent displays account for the largest share of the transparent display market, primarily due to their cost-effectiveness, scalability, and compatibility with existing display manufacturing infrastructure. These displays are widely used in retail showcases, digital signage, and industrial control systems, offering reliable brightness and transparency levels. Continuous improvements in backlighting and contrast performance further support their dominance across commercial applications.
OLED
OLED-based transparent displays are expected to witness the fastest growth, driven by their superior image quality, flexibility, and self-emissive characteristics that eliminate the need for backlighting. These displays deliver enhanced color accuracy, higher contrast ratios, and thinner form factors, making them ideal for automotive head-up displays, augmented reality devices, and smart retail applications. Ongoing advancements in transparent OLED materials and energy efficiency are accelerating their market penetration.
Market by Vertical
Automotive & Transportation
The automotive and transportation sector holds the largest share of the transparent display market, driven by increasing integration of head-up displays (HUDs) and smart windows in vehicles. Transparent displays enhance driver safety and user experience by projecting real-time navigation, speed, and hazard information onto the windshield. Rising adoption in premium and electric vehicles further strengthens this segment’s market dominance.
Consumer
The consumer segment is projected to record the fastest growth, supported by rising use of transparent displays in smart home devices, augmented reality (AR) gadgets, and next-generation televisions. Consumers are increasingly drawn to the technology’s aesthetic appeal and interactive capabilities. Expanding applications in wearables, gaming, and smart appliances are expected to accelerate adoption across the consumer electronics market.
Market by Geography
Geographically, the transparent display market spans North America, Europe, Asia Pacific, and the Rest of the World. Asia Pacific dominates the market, driven by strong demand from retail, automotive, and consumer electronics industries, alongside rapid technological advancements in countries such as Japan, South Korea, and China. Major display manufacturers and expanding smart infrastructure initiatives further reinforce the region’s leadership. North America is expected to witness the fastest growth, fueled by increasing adoption in automotive head-up displays, smart signage, and augmented reality applications, supported by robust R&D activities and high consumer technology uptake. Europe and other regions are gradually expanding, with rising use in retail and industrial automation.
Market Dynamics
Driver: Growing adoption in automotive head-up displays (HUDs)
The transparent display market is primarily driven by increasing integration of head-up displays in vehicles. Rising demand for enhanced driver safety, real-time navigation, and immersive dashboards is encouraging the adoption of transparent OLED and LCD panels in automotive applications. Advanced features such as high brightness, wide viewing angles, and dynamic content projection enhance usability, supporting premium vehicle segments and fostering growth in both passenger and commercial transportation markets globally.
Restraint: Limited brightness in high-ambient environments
A major restraint for the transparent display market is limited visibility under high-ambient lighting conditions. Transparent panels often struggle to maintain sufficient brightness and contrast when exposed to sunlight or brightly lit environments, which can reduce readability and user experience. This limitation constrains deployment in outdoor signage, automotive HUDs, and retail storefronts, slowing adoption despite technological advancements and premium pricing strategies.
Opportunity: Integration in smart retail and experiential advertising
Smart retail and experiential advertising present significant opportunities for the transparent display market. Retailers are increasingly deploying interactive see-through displays to showcase products while delivering dynamic digital content. This trend enables enhanced customer engagement, personalized promotions, and immersive brand experiences, creating potential for manufacturers to develop specialized transparent display solutions tailored for commercial and consumer-facing applications.
Challenge: Lack of standardized content and software ecosystem
A key challenge facing the transparent display market is the limited availability of optimized content and software solutions. The absence of standardized platforms for creating and managing transparent visuals restricts effective deployment across industries. Content developers and system integrators must often customize software and applications for each installation, increasing complexity, costs, and time-to-market, thereby slowing broader adoption of transparent display technology.
Future Outlook
Between 2025 and 2035, the transparent display market is expected to experience robust growth as demand rises across automotive & transportation, retail & hospitality, consumer, and industrial verticals. Advancements in transparent OLED and LCD technologies, coupled with improved brightness, energy efficiency, and touch-enabled interactivity, will enhance visual performance and user engagement. Expanding adoption in head-up displays, smart retail signage, augmented reality interfaces, and smart home devices will further accelerate market penetration. As the ecosystem matures, transparent displays are poised to drive innovation, enable immersive experiences, and redefine interactive visualization across commercial and industrial sectors.
Key Market Players
Leading companies in the global transparent display market include Samsung Electronics (South Korea), LG Display Co., Ltd. (South Korea), Panasonic Corporation (Japan), BOE Technology Group Co., Ltd. (China), and Pro Display (UK).
Key Questions addressed in this report:
- What are the global trends in demand for the market?
- What are the upcoming product areas that will have a significant impact on the market in the future?
- What will be the revenue pockets for the market players in the next 6 years?
- What are the prime strategies followed by key players in the market?
 Exclusive indicates content/data unique to MarketsandMarkets and not available with any competitors.
Table of Contents
1 Introduction (Page No. - 15)
1.1 Objectives of the Study
1.2 Definition
1.3 Study Scope
1.3.1 Markets Covered
1.3.2 Years Considered for the Study
1.4 Currency
1.5 Stakeholders
2 Research Methodology (Page No. - 18)
2.1 Research Data
2.1.1 Secondary Data
2.1.1.1 Major Secondary Sources
2.1.1.2 Key Data From Secondary Sources
2.1.2 Primary Data
2.1.2.1 Primary Interviews With Experts
2.1.2.2 Key Data From Primary Sources
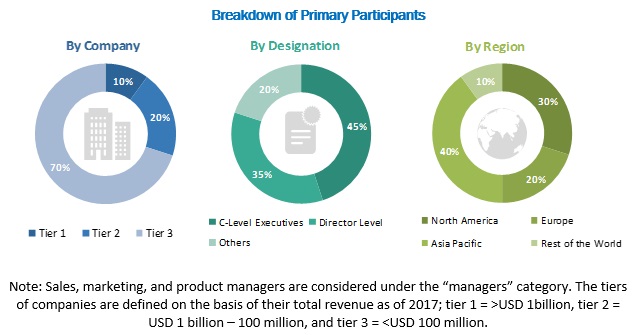
2.1.2.3 Breakdown of Primaries
2.1.2.4 Key Industry Insights
2.2 Market Size Estimation
2.2.1 Bottom-Up Approach
2.2.1.1 Approach for Capturing Market Size By Bottom-Up Analysis (Demand Side)
2.2.2 Top-Down Approach
2.2.2.1 Approach for Capturing Market Size By Top-Down Analysis (Supply Side)
2.3 Market Breakdown and Data Triangulation
2.4 Research Assumptions
3 Executive Summary (Page No. - 28)
4 Premium Insights (Page No. - 33)
4.1 Transparent Display Market (2018–2023)
4.2 Market, By Product
4.3 Market, By Verticals and Countries
4.4 Market Geographic Snapshot
5 Market Overview (Page No. - 36)
5.1 Introduction
5.1.1 Drivers
5.1.1.1 Growing Demand for LCD Based Transparent Displays for Various Verticals
5.1.1.2 Increasing Use of Transparent Displays for HMD and HUD Products
5.1.2 Restraints
5.1.2.1 High Cost Associated With Transparent Display Products
5.1.3 Opportunities
5.1.3.1 High Growth for OLED Based Transparent Display Devices
5.1.3.2 High Adoption of Transparent Display for Digital Signage Products
5.1.4 Challenges
5.1.4.1 Fluctuation Average Selling Price of Display Panels
6 Transparent Display Market, By Display Size (Page No. - 39)
6.1 Introduction
6.2 Small and Medium-Sized
6.2.1 Small and Medium-Sized Display to Account for Largest Share of market
6.3 Large
6.3.1 Demand for Large-Size Displays Expected to Increase Rapidly for Digital Signage and Smart Appliance During Forecast Period
7 Transparent Display Market, By Resolution (Page No. - 42)
7.1 Introduction
7.2 Ultra-High Definition (UHD)
7.2.1 Ultra-High Definition Resolution Segment to Witness Highest CAGR for Market During Forecast Period
7.3 Full HD
7.3.1 Full-HD Resolution to Lead Market During Forecast Period
7.4 HD
7.4.1 HD Resolution to Lead Market
7.5 Others
8 Transparent Display Market, By Technology (Page No. - 46)
8.1 Introduction
8.2 LCD
8.2.1 LCD Display Technology to Account for Large Share of market
8.3 OLED
8.3.1 HMD to Account for Largest Share of OLED Transparent Display Market
8.4 Others
9 Transparent Display Market, By Vertical (Page No. - 53)
9.1 Introduction
9.2 Consumer
9.2.1 HMD to Account for Largest Share of Market for Consumer Segment
9.3 Retail & Hospitality
9.3.1 Smart Appliance to Witness Highest CAGR for Market in Retail & Hospitality Segment
9.4 Sports and Entertainment
9.4.1 HMD to Witness High Growth in Sports & Entertainment Segment During Forecast Period
9.5 Healthcare
9.5.1 HMD to Dominate Market in Healthcare Segment During Forecast Period
9.6 Aerospace & Defense
9.6.1 HUD and HMD Products to Drive Market Growth in Aerospace & Defense Segment
9.7 Automotive & Transportation
9.7.1 HUD to Lead Market in Automotive & Transportation Segment
9.8 Industrial
9.8.1 Increasing Adoption of HMDs to Drive Market Growth in Industrial Segment
9.9 Others
9.9.1 HMDs to Lead market in Other Verticals
10 Market, By Product (Page No. - 63)
10.1 Introduction
10.2 Head-Mounted Display (HMD)
10.2.1 Industrial Segment to Capture Considerably Large Share of HMD Transparent Display Market
10.3 Head-Up Display (HUD)
10.3.1 Automotive & Transportation Segment to Dominate HUD Transparent Display Market During Forecast Period
10.4 Digital Signage
10.4.1 LCD Display Technology to Account for Largest Share of Digital Signage Transparent Display Market
10.5 Smart Appliance
10.5.1 LCD Display Technology Expected to Continue Its Dominance in Smart Appliance Transparent Display Market During Forecast Period
11 Geographic Analysis (Page No. - 76)
11.1 Introduction
11.2 North America
11.2.1 US
11.2.1.1 Market for HMD to Witness High Growth in the Us
11.2.2 Canada and Mexico
11.2.2.1 Consumer, Automotive, Retail, Healthcare, and Industrial Sectors Expected to Be Major End Users of Transparent Display Devices in Canada and Mexico
11.3 Europe
11.3.1 Germany
11.3.1.1 Germany to Lead Market in Europe During Forecast Period
11.3.2 UK
11.3.2.1 UK to Witness Increasing Demand for Market During Forecast Period
11.3.3 France
11.3.3.1 Increasing Use of HMD Devices in France is Expected to Create Significant Demand for Transparent Displays in the Near Future
11.3.4 Rest of Europe
11.3.4.1 Aerospace & Defense is the Major Segment in the Market in Rest of Europe
11.4 Asia Pacific
11.4.1 China
11.4.1.1 China to Witness Rapid Growth in Global Market
11.4.2 Japan
11.4.2.1 Japan Accounts for Highest Demand for HMD and HUDs in Global Market
11.4.3 India
11.4.3.1 India Expected to Lead Market During Forecast Period
11.4.4 South Korea
11.4.4.1 South Korea to Account for Major Demand for OLED Display Panels During Forecast Period
11.4.5 Rest of APAC
11.4.5.1 HMD and HUD Products Expected to Boost Market in Rest of APAC
11.5 Rest of the World
11.5.1 South & Central America
11.5.1.1 Transparent Display Demand in South & Central America to Emerge for Consumer Products
11.5.2 Middle East & Africa
11.5.2.1 Countries Such as Saudi Arabia, the UAE, and Israel are Major Contributor for Market in Middle East
12 Competitive Landscape (Page No. - 91)
12.1 Introduction
12.2 Market Player Ranking Analysis
12.3 Competitive Leadership Mapping
12.3.1 Visionary Leaders
12.3.2 Dynamic Differentiators
12.3.3 Innovators
12.3.4 Emerging Companies
12.4 Strength of Product Portfolio (25 Companies)
12.5 Business Strategy Excellence (25 Companies)
12.6 Competitive Scenario
12.7 Competitive Situations & Trends
12.7.1 Product Launches/Developments
12.7.2 Collaborations/Agreements/Partnerships
13 Company Profiles (Page No. - 100)
13.1 Key Players
(Business Overview, Products & Key Insights, Recent Developments, SWOT Analysis, MnM View)*
13.1.1 Planar Systems
13.1.2 Pro Display
13.1.3 Crystal Display System
13.1.4 LG Electronics
13.1.5 Panasonic
13.1.6 Benq Display
13.1.7 Clearled
13.1.8 Kent Optronics, Inc.
13.1.9 NEC Display Solutions
13.1.10 Universal Display Corporation
13.2 Other Key Companies
13.2.1 Evoluce
13.2.2 Globus Infocom
13.2.3 Hangzhou Hikvision Digital Technology
13.2.4 Japan Display
13.2.5 Optinvent
13.2.6 Pilot Screentime
13.2.7 Shenzhen Nexnovo Technology
13.2.8 Shenzhen Hoxled Optoelectronic Technology
13.2.9 Samsung Display
13.2.10 Shenzhen Auroled Technology
*Details on Business Overview, Products &, Key Insights, Recent Developments, SWOT Analysis, MnM View Might Not Be Captured in Case of Unlisted Companies.
14 Appendix (Page No. - 125)
14.1 Discussion Guide
14.2 Knowledge Store: Marketsandmarkets’ Subscription Portal
14.3 Available Customization
14.4 Related Reports
14.5 Author Details
List of Tables (40 Tables)
Table 1 Transparent Display Market, By Display Size, 2015–2023 (USD Million)
Table 2 Market, By Resolution, 2015–2023 (USD Million)
Table 3 Market, By Technology, 2015–2023 (USD Million)
Table 4 Market for LCD, By Product, 2015–2023 (USD Million)
Table 5 Market for OLED, By Product, 2015–2023 (USD Million)
Table 6 Market for Other, By Product, 2015–2023 (USD Million)
Table 7 Market, By Application, 2015–2023 (USD Million)
Table 8 Market for Consumer, By Product, 2015–2023 (USD Million)
Table 9 Market for Retail & Hospitality, By Product, 2015–2023 (USD Million)
Table 10 Market for Sports and Entertainment, By Product, 2015–2023 (USD Million)
Table 11 Market for Healthcare, By Product, 2015–2023 (USD Million)
Table 12 Market for Aerospace & Defense, By Product, 2015–2023 (USD Million)
Table 13 Market for Automotive & Transportation, By Product, 2015–2023 (USD Million)
Table 14 Market for Industrial, By Product, 2015–2023 (USD Million)
Table 15 Market for Others, By Product, 2015–2023 (USD Million)
Table 16 Market, By Product, 2015–2023 (USD Million)
Table 17 Market, By Product, 2015–2023 (Thousand Units)
Table 18 Market for HMD, By Technology, 2015–2023 (USD Million)
Table 19 Market for HMD, By Vertical, 2015–2023 (USD Million)
Table 20 Market for HMD, By Region, 2015–2023 (USD Million)
Table 21 Market for Head–Up Display, By Technology, 2015–2023 (USD Million)
Table 22 Market for Head–Up Display, By Vertical, 2015–2023 (USD Million)
Table 23 Market for HUD, By Region, 2015–2023 (USD Million)
Table 24 Market for Digital Signage, By Technology, 2015–2023 (USD Million)
Table 25 Market for Digital Signage, By Vertical, 2015–2023 (USD Million)
Table 26 Market for Digital Signage, By Region, 2015–2023 (USD Million)
Table 27 Market for Smart Appliance, By Technology, 2017–2023 (USD Million)
Table 28 Market for Smart Appliance, By Vertical, 2017–2023 (USD Million)
Table 29 Market for Smart Appliance, By Region, 2017–2023 (USD Million)
Table 30 Market, By Region, 2015–2023 (USD Million)
Table 31 Market in North America, By Country, 2015–2023 (USD Million)
Table 32 Market for North America, By Product, 2015–2023 (USD Million)
Table 33 Market in Europe, By Country, 2015–2023 (USD Million)
Table 34 Market for Europe, By Product, 2015–2023 (USD Million)
Table 35 Market in APAC, By Country, 2015–2023 (USD Million)
Table 36 Market for APAC, By Product, 2015–2023 (USD Million)
Table 37 Market in RoW, By Region, 2015–2023 (USD Million)
Table 38 Market for RoW, By Product, 2015–2023 (USD Million)
Table 39 Product Launches/Demonstration (2015–2018)
Table 40 Collaborations/Agreements/Partnerships (2016–2018)
List of Figures (49 Figures)
Figure 1 Market Segmentation
Figure 2 Market: Process Flow of Market Size Estimation
Figure 3 Market: Research Design
Figure 4 Market Size Estimation Methodology: Bottom-Up Approach
Figure 5 Market Size Estimation Methodology: Top-Down Approach
Figure 6 Data Triangulation
Figure 7 Assumptions for Research Study
Figure 8 Small and Medium Size Display to Lead the Market During Forecast Period
Figure 9 Full HD Resolution to Dominate the Market During Forecast Period
Figure 10 LCD to Dominate market During Forecast Period
Figure 11 HUD Product to Dominate Market During Forecast Period
Figure 12 Automotive & Transportation to Account for Largest Size of market
Figure 13 Market to Grow at Highest CAGR in North America During Forecast Period
Figure 14 Attractive Opportunities for Market Between 2018 and 2023
Figure 15 Market for Smart Appliance to Grow at Highest CAGR During Forecast Period
Figure 16 Automotive & Transportation and Japan Held Major Shares of Market in 2017
Figure 17 Market to Grow at Highest CAGR in China During Forecast Period
Figure 18 Market: Drivers, Restraints, Opportunities, and Challenges
Figure 19 Market for Small and Medium Size Display to Grow at Higher CAGR During Forecast Period
Figure 20 Ultra HD Resolution Expected to Grow at Highest CAGR for Market During Forecast Period
Figure 21 Market for OLED to Grow at Higher CAGR During Forecast Period
Figure 22 HUD Product to Account for Major Share of market for LCD Technology During Forecast Period
Figure 23 HMD Product Hold the Largest Size of market for the OLED Technology During the Forecast Period
Figure 24 Market for Consumer to Grow at Higher CAGR During Forecast Period
Figure 25 HMD to Dominate market for Consumer During Forecast Period
Figure 26 Digital Signage to Hold Largest Share for market for Retail & Hospitality During Forecast Period
Figure 27 Digital Signage to Dominate market for Sports & Entertainment During Forecast Period
Figure 28 HUD Expected to Lead the Market During the Forecast Period
Figure 29 LCD Technology to Dominate HMD Transparent Display Market During the Forecast Period
Figure 30 Industrial Segment to Dominate HMD Market During the Forecast Period
Figure 31 OLED Technology Expected to Grow at the Highest CAGR for HUD Market During the Forecast Period
Figure 32 Retail & Hospitality Segment Hold Largest Share for Digital Signage Market During the Forecast Period
Figure 33 Consumer Segment Expected to Dominate Smart Appliance Market During the Forecast Period
Figure 34 Market in South Korea to Grow at Highest CAGR During Forecast Period
Figure 35 North America to Grow at the Highest CAGR for market During Forecast Period
Figure 36 North America: Market Snapshot
Figure 37 Market in US to Grow at Highest CAGR During Forecast Period
Figure 38 Europe: Market Snapshot
Figure 39 Germany to Lead market in Europe During Forecast Period
Figure 40 APAC: Market Snapshot
Figure 41 Market in South Korea to Grow at Highest CAGR During Forecast Period
Figure 42 Middle East & Africa to Dominate market in RoW During Forecast Period
Figure 43 Companies Adopted Product Launches/Developments as Key Growth Strategies During 2015–2018
Figure 44 Planar Systems (US) Lead the market in 2017
Figure 45 Market (Global) Competitive Leadership Mapping, 2017
Figure 46 Evaluation Framework: Transparent Display Market
Figure 47 LG Electronics: Company Snapshot
Figure 48 Panasonic: Company Snapshot
Figure 49 Universal Display Corporation: Company Snapshot
The study involved 4 major activities in estimating the current size of the transparent display market. Exhaustive secondary research was done to collect information on the market, peer market, and parent market. The next step was to validate these findings, assumptions, and sizing with industry experts across value chain through primary research. Both top-down and bottom-up approaches were employed to estimate the complete market size. After that, market breakdown and data triangulation methods were used to estimate the market size of segments and subsegments.
Secondary Research
The research methodology used to estimate and forecast the transparent display market begins with capturing data on revenues of key vendors in the market through secondary research. This study incorporates the use of extensive secondary sources, directories, and databases such as Hoovers, Bloomberg Businessweek, Factiva, and OneSource to identify and collect information useful for the technical, market-oriented, and commercial study of market. Vendor offerings have also been considered to determine the market segmentation. This entire research methodology includes the study of annual and financial reports of top players, presentations, press releases, journals, paid databases, trade directories, regulatory bodies, and safety standard organizations.
Primary Research
The transparent display market comprises several stakeholders, such as suppliers, standard components, original equipment manufacturers (OEMs), software providers, solutions providers, and system integrators in the supply chain. The supply side is characterized by advancements in types of products and technology used in transparent display and their diverse applications. Various primary sources from both the supply and demand sides of the market were interviewed to obtain qualitative and quantitative information. Following is the breakdown of primary respondents.
To know about the assumptions considered for the study, download the pdf brochure
Market Size Estimation
Both top-down and bottom-up approaches have been used to estimate and validate the total size of the transparent display market. These methods have also been used extensively to estimate the size of various market subsegments. The research methodology used to estimate the market size includes the following:
- Key players in major verticals and markets were identified through extensive secondary research.
- The industry’s supply chain and market size, in terms of value, were determined through primary and secondary research processes.
- All percentage shares, splits, and breakdowns were determined using secondary sources and verified through primary sources.
Data Triangulation
After arriving at the overall market size—using the estimation processes as explained above—the market was split into several segments and subsegments. To complete the overall market engineering process and arrive at the exact statistics of each market segment and subsegment, data triangulation and market breakdown procedures were employed, wherever applicable. The data have been triangulated by studying various factors and trends from both the demand and supply sides. The market has also been validated using both top-down and bottom-up approaches.
Research Objective
- To define, describe, and forecast the overall market, in terms of value, segmented based on display size, resolution, technology, product, vertical, and geography
- To define, describe, and forecast the overall market, in terms of volume, segmented based on product
- To forecast the market size for various segments with regard to 4 regions—North America, Europe, Asia Pacific (APAC), and Rest of the World (RoW)
- To provide detailed information regarding the major factors (drivers, restraints, opportunities, and challenges) influencing the growth of the market
- To strategically analyze the micromarkets with respect to individual growth trends, prospects, and contribution to the overall market
- To analyze opportunities in the market for stakeholders by identifying the high-growth segments
- To strategically profile key players, comprehensively analyze their market rankings and core competencies, and detail the competitive landscape for market leaders
- To analyze competitive developments such as product launches and development; partnership, agreement, and contact; and R&D in the overall market
Available Customizations:
Along with the market data, MarketsandMarkets offers customizations according to a company’s specific needs. The following customization options are available for the report:
Company Information
- Detailed analysis and profiling of additional market players (Up to 5)


Growth opportunities and latent adjacency in Transparent Display Market
We have our own sputtering cathode to coat transparent oxide with low damage. So, we would like to know about OLED markets and when we should expand the cathode to the markets.