
Head-up Display (HUD) Market Size, Share & Growth

Head-up Display (HUD) Market Size, Share, Growth & Trends by Combiner HUD, Windshield HUD, Wearable HUD, Augmented Reality (AR) HUD, Conventional HUD, Display Unit, Video Generator/Processing Unit, and Projector/ Projection Unit - Global Forecast to 2030


HEAD-UP DISPLAY MARKET SIZE, SHARE & TRENDS
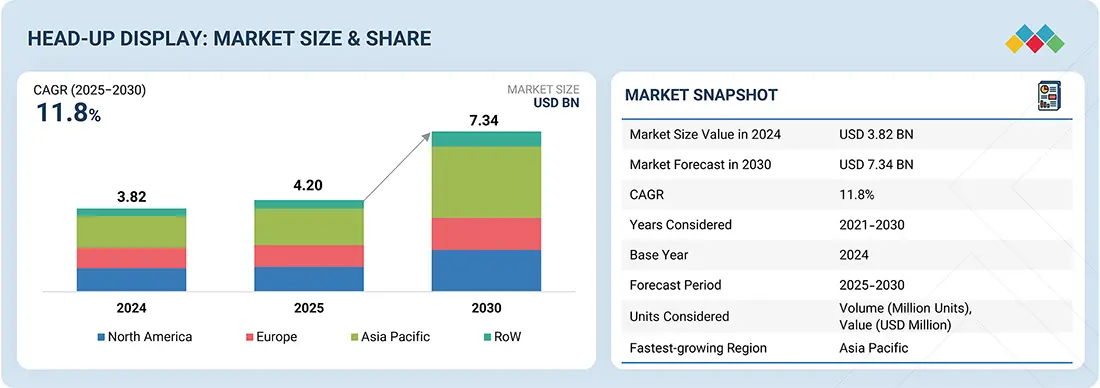
According to Marketsandmarkets, the global head-up display market size was valued at USD 4.20 billion in 2025 and is projected to reach USD 7.34 billion by 2030, growing at a CAGR of 11.8% from 2025 to 2030. The market is being driven by the rising demand for advanced driver-assistance systems (ADAS) and enhanced in-vehicle safety features. Increasing consumer preference for connected and immersive driving experiences has further accelerated adoption, especially with the integration of augmented reality (AR) HUDs. Automakers are also focusing on minimizing driver distraction by projecting critical information such as navigation, speed, and alerts directly onto the windshield.
MARKET SNAPSHOT TABLE
| REPORT METRIC | DETAILS |
|---|---|
| Market Size in 2025 (Value) | USD 4.20 Billion |
| Market Forecast in 2030 (Value) | USD 7.34 Billion |
| Growth Rate | CAGR of 11.8% from 2025-2030 |
| Years Considered | 2021–2030 |
| Base Year | 2024 |
| Forecast Period | 2025–2030 |
| Units Considered | Value (USD Million), Volume (Million Units) |
| Report Coverage | Revenue forecast, company ranking, competitive landscape, growth factors, and trends |
| Segments Covered |
|
| Regional Scope | North America, Europe, Asia Pacific, and RoW |
| Top Companies |
|
| Growth Drivers |
|
Market Size & Forecast
• 2025 Market Size: USD 4.20 Billion
• 2030 Projected Market Size: USD 7.34 Billion
• CAGR (2025-2030): 11.8%
• Video generators/processing: Fastest Growing Market
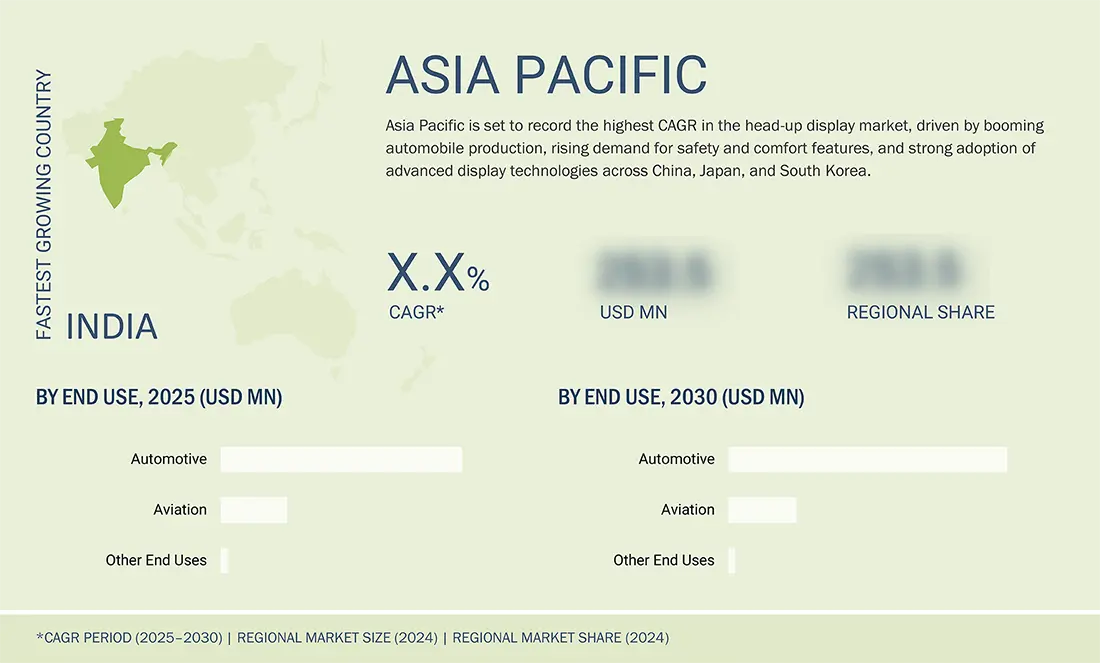
• Asia Pacific: Fastest CAGR
HEAD-UP DISPLAY MARKET GROWTH KEY TAKEAWAYS
-
BY COMPONENTThe component segment is evolving rapidly, with video processors and projection units driving innovation as they enable high-performance AR overlays and real-time rendering. Display units are benefiting from advances in OLED and microLED technologies, while supporting components like optics, sensors, and software are creating new value pools through enhanced safety and personalized experiences.
-
BY FORM FACTORWindshield HUDs dominate the market due to their wide field of view and seamless integration into driver sightlines, while combiners continue to serve cost-sensitive and retrofit applications. Wearable and helmet-mounted HUDs are emerging as high-growth niches, particularly in defense, industrial, and two-wheeler segments, where mobility and adaptability are critical.
-
BY TYPEConventional HUDs remain the most widely adopted due to proven reliability and affordability, especially across mid-range vehicles. However, AR HUDs represent the fastest-growing type, as demand rises for contextual navigation, lane-level guidance, and immersive ADAS displays, supported by advancements in optics and computational imaging.
-
BY END USEAutomotive dominates the HUD market, as rising demand for advanced driver assistance, navigation overlays, and enhanced safety features makes HUDs a mainstream offering in mid-range and premium vehicles. Industrial applications are gaining traction, particularly in sectors requiring hands-free data visualization for operational efficiency.
-
BY REGIONAsia Pacific is expected to exhibit the fastest CAGR of 14.3%, driven by strong adoption in the automotive sector, rapid technological advancements, and increasing integration of HUDs by regional automobile manufacturers.
-
COMPETITIVE LANDSCAPEThe major market players have adopted both organic and inorganic strategies, including partnerships and agreements. For instance, Nippon Seiki Co., Ltd. entered a joint venture agreement in India with Emerging Display Technologies Corporation (Taiwan), a manufacturer of high-definition TFT LCD modules.
The head-up display industry is gaining momentum due to increasing demand for enhanced driver safety and convenience, as HUDs reduce driver distraction by projecting critical information within the line of sight. Growing adoption of advanced driver assistance systems (ADAS), coupled with the rising integration of augmented reality (AR) technologies, is further driving market expansion. Automakers are incorporating HUDs as a key differentiator in premium and mid-segment vehicles, reflecting a trend toward mass adoption. In addition, continuous improvements in projection technologies, miniaturization of components, and integration with connected and autonomous vehicle systems are shaping the evolution of HUDs.
Source: Secondary Research, Interviews with Experts, MarketsandMarkets Analysis
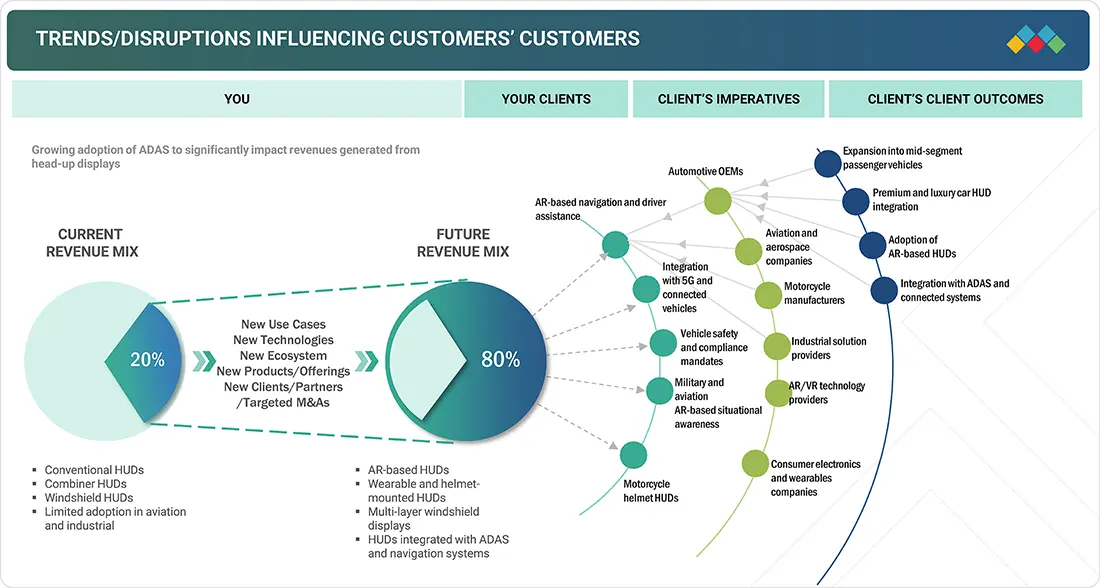
TRENDS & DISRUPTIONS IMPACTING CUSTOMERS' CUSTOMERS
The disruptions and emerging trends impacting customers’ businesses in the head-up display market size include moving from a luxury-focused HUD adoption base toward wider integration in mid-segment vehicles, with AR-based HUDs and ADAS connectivity emerging as key growth enablers.
Source: Secondary Research, Interviews with Experts, MarketsandMarkets Analysis
HEAD-UP DISPLAY MARKET GROWTH DYNAMICS
Level
-
Rising integration of HUDs with ADAS and real-time data

-
Growing emphasis on vehicle and passenger safety

Level
-
Issues related to retrofitting and standardization

-
Display visibility issues in bright sunlight or adverse conditions

Level
-
Increasing interest in HUDs for electric and software-defined vehicles

-
Rising application in two-wheeler and commercial vehicles

Level
-
Regulatory challenges

-
High-expenses linked to advanced HUDs

Source: Secondary Research, Interviews with Experts, MarketsandMarkets Analysis
Driver: Rising integration of HUDs with ADAS and real-time data
The integration of HUDs with advanced driver assistance systems (ADAS) and real-time data is reshaping the driving experience by enhancing safety, awareness, and operational efficiency. By projecting critical information, such as ADAS alerts, navigation details, and traffic insights, directly onto the windshield, HUDs allow drivers to stay focused on the road rather than glancing at dashboards or infotainment screens. This seamless display reduces cognitive load, enabling safer and more intuitive vehicle operation.
Restraint: Complex installation and maintenance
The head-up display market is significantly restrained by the complex installation and maintenance requirements of HUD systems. Installing a HUD system, whether during vehicle manufacturing or as an aftermarket addition, demands specialized expertise to align it with the driver’s line of sight and calibrate it correctly. This specialized skill set may not be readily available in all repair shops or regions, limiting the widespread adoption of HUD technology and potentially raising installation costs.
Opportunity: Increasing interest in HUDs for electric and software-defined vehicles
As the automotive landscape shifts toward electric vehicles (EVs) and software-defined vehicles (SDVs), HUDs emerge as a natural interface for communicating real-time, software-driven insights to the driver. EVs, by nature, depend heavily on digital interfaces to convey battery levels, charging status, regenerative braking intensity, and range estimations. HUDs allow such data to be displayed in the driver’s field of view, reducing cognitive load and enhancing situational awareness. The silent operation of EVs also increases the need for visual cues, especially for pedestrians and low-speed manoeuvring, which HUDs can facilitate through AR overlays and dynamic alerts.
Challenge: Limited field of view (FOV)
One of the major limitations of the head-up display market is the restricted field of view (FOV) that HUDs can offer. HUDs generally project information onto a small part of the windshield or a dedicated display screen, which can limit the amount of data displayed. The FOV constraint means that critical data may not be displayed simultaneously, which could cause drivers to switch their attention between the HUD and the road.
Head-up Display (HUD) Market: COMMERCIAL USE CASES ACROSS INDUSTRIES
| COMPANY | USE CASE DESCRIPTION | BENEFITS |
|---|---|---|
 |
Automotive HUDs integrated into premium and mid-segment passenger vehicles, focusing on compact windshield and combiner HUDs | Enhanced driver visibility |Reduced distraction| Safer navigation| Growing a+C5+C2 |
 |
AR-based HUD systems designed for connected and autonomous vehicles, providing large-field projections and ADAS integration | Improved situational awareness| Seamless ADAS alerts| Enhanced road safety| Immersive driver experience |
 |
HUD solutions integrated with vehicle infotainment and safety systems, emphasizing energy-efficient and compact designs | Lower power consumption| Optimized in-cabin space usage| Improved safety alerts| Better driver convenience |
 |
Advanced windshield HUDs and AR HUDs targeted for electric and autonomous vehicle platforms | Clearer projection in varied lighting| Improved driver–vehicle interaction|Stronger EV compatibility |
 |
Multi-layered AR HUDs combining navigation, driver assistance data, and infotainment for high-end vehicles | Immersive AR visualization|Reduced cognitive load| Enhanced driving comfort |Premium user experience |
Logos and trademarks shown above are the property of their respective owners. Their use here is for informational and illustrative purposes only.
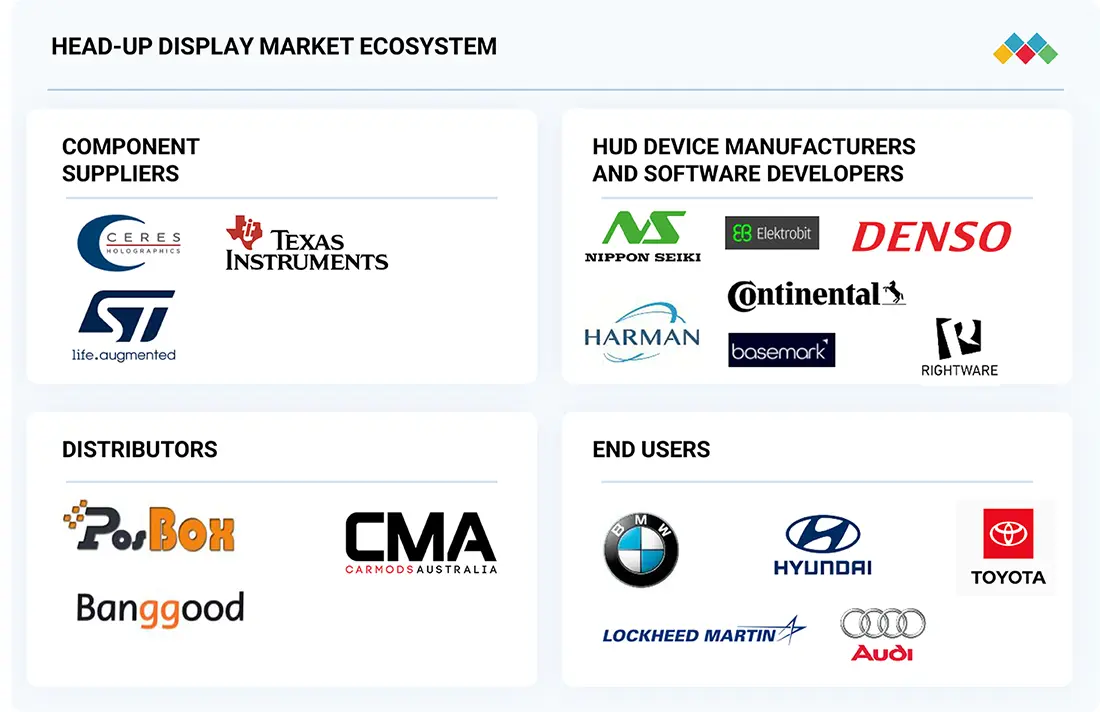
HEAD-UP DISPLAY MARKET SHARE ECOSYSTEM
The head-up display ecosystem involves component suppliers, HUD manufacturers, software developers, distributors, and end users. Each collaborates to advance the market by sharing knowledge, resources, and expertise to attain end innovation in this field. Head-up display companies, such as Nippon Seiki Co., Ltd. (Japan), Continental AG (Germany), DENSO CORPORATION (Japan), E-LEAD ELECTRONIC CO. LTD (Taiwan), BAE Systems (UK), Yazaki Corporation (Japan), HARMAN International (US), Valeo (France), Panasonic Holdings Corporation (Japan), and Garmin Ltd. (US), are at the core of the market and are responsible for developing head-up display solutions for various end users.
Logos and trademarks shown above are the property of their respective owners. Their use here is for informational and illustrative purposes only.
HEAD-UP DISPLAY MARKET SEGMENTS
Source: Secondary Research, Interviews with Experts, MarketsandMarkets Analysis
Head-up Display Market, by Type
Conventional HUDs continue to dominate due to their cost-effectiveness, simpler integration, and proven reliability in mass-market vehicles. Their widespread use in mid-segment passenger cars makes them more scalable compared to advanced AR-based HUDs, which are still limited to premium models. Additionally, their lower production and maintenance costs appeal to OEMs targeting volume sales.
Head-up Display Market, by Component
Video generators/processing units are projected to grow fastest as they are the core enablers of AR-based HUDs, supporting real-time rendering of navigation, ADAS alerts, and immersive displays. Increasing demand for advanced visualization and seamless driver information systems is driving their rapid adoption. With the rise of complex driving data and 3D projections, these units are becoming indispensable to next-gen HUDs.
Head-up Display Market, by Form Factor
Windshield HUDs are expected to lead the market as they offer a wider field of view, seamless integration with the driver’s line of sight, and improved safety by minimizing distractions. Their growing adoption in premium and mid-segment vehicles, supported by advancements in projection technology, makes them the preferred choice over combiner HUDs.
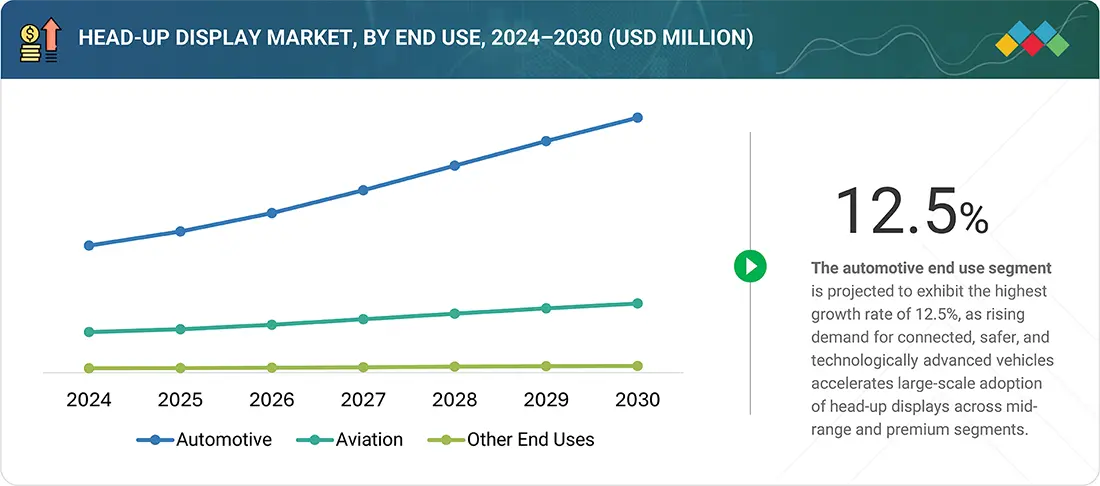
Head-up Display Market, by End Use
Automotive end use is expected to grow at the fastest rate due to rising integration of HUDs in both premium and mid-segment passenger vehicles. Safety regulations, growing ADAS adoption, and consumer demand for enhanced driving experiences are fueling rapid expansion in this sector. Continuous OEM investments in connected and semi-autonomous vehicles further amplify HUD adoption in the automotive industry.
HEAD-UP DISPLAY MARKET TRENDS BY REGION
Asia Pacific to exhibit the fastest CAGR in the global head-up display market during the forecast period
Asia Pacific is expected to exhibit the highest CAGR in the head-up display market owing to rapid growth in automobile production, rising consumer preference for advanced safety and comfort features, and strong adoption of connected technologies in countries such as China, Japan, and South Korea. Expanding premium and mid-segment passenger vehicle sales, coupled with government support for road safety and technology-driven automotive innovations, further accelerate HUD penetration in the region. Additionally, increasing investments from global and regional OEMs in AR-based HUDs strengthens the region’s growth outlook.
The Asia-Pacific head-up display market is projected to reach USD 3.26 billion by 2030, growing from USD 1.67 billion in 2025, at a CAGR of around 14.3%. The market is driven by rising vehicle production, rapid adoption of advanced driver-assistance systems, and increasing penetration of premium and electric vehicles across key automotive markets such as China, Japan, South Korea, and India. Demand for enhanced vehicle safety, improved driver awareness, and digitally advanced in-vehicle user experiences is also growing. Automakers across the region are increasingly integrating windshield-based and augmented reality head-up displays to support real-time navigation, hazard alerts, and vehicle status visualization.
The European head-up display market is projected to reach USD 1.48 billion by 2030, growing from USD 0.99 billion in 2025, at a CAGR of around 8.4% from 2025 to 2030. The market is driven by the increasing integration of advanced driver-assistance systems, stringent vehicle safety regulations, and high penetration of premium and technologically advanced vehicles across the region. European automakers are actively adopting windshield-based and augmented reality head-up displays to enhance driver safety, reduce distractions, and support real-time navigation, hazard warnings, and vehicle status visualization.
The North America head-up display market is projected to reach USD 1.90 billion by 2030 from USD 1.15 billion in 2025, at a CAGR of 10.7%. Growth is driven by rising integration of advanced driver-assistance systems, increasing demand for enhanced driver safety and situational awareness, and the strong presence of OEMs offering premium and mid-range vehicles in the region. Automakers are increasingly adopting windshield-based and AR head-up displays to reduce driver distraction and support real-time navigation, hazard alerts, and vehicle status visualization.
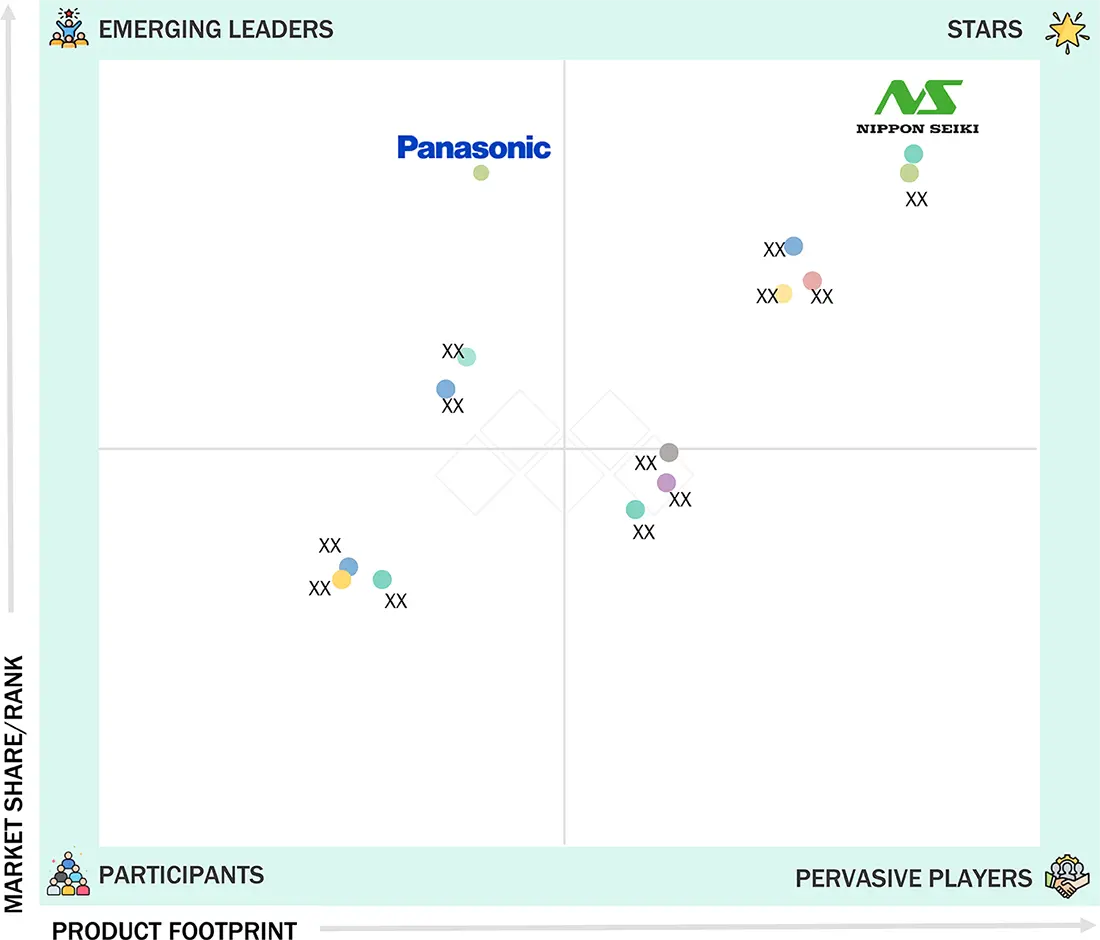
Head-up Display (HUD) Market: COMPANY EVALUATION MATRIX
In the head-up display market share matrix, Nippon Seiki is positioned as a star due to its strong product footprint and dominant market share, reflecting its leadership in both innovation and adoption across OEMs. Panasonic Holdings Corporation, on the other hand, is seen as an emerging leader, holding a significant market share but with a comparatively smaller product footprint, indicating strong growth potential as it expands its HUD offerings.
Source: Secondary Research, Interviews with Experts, MarketsandMarkets Analysis
HEAD-UP DISPLAY MARKET KEY PLAYERS
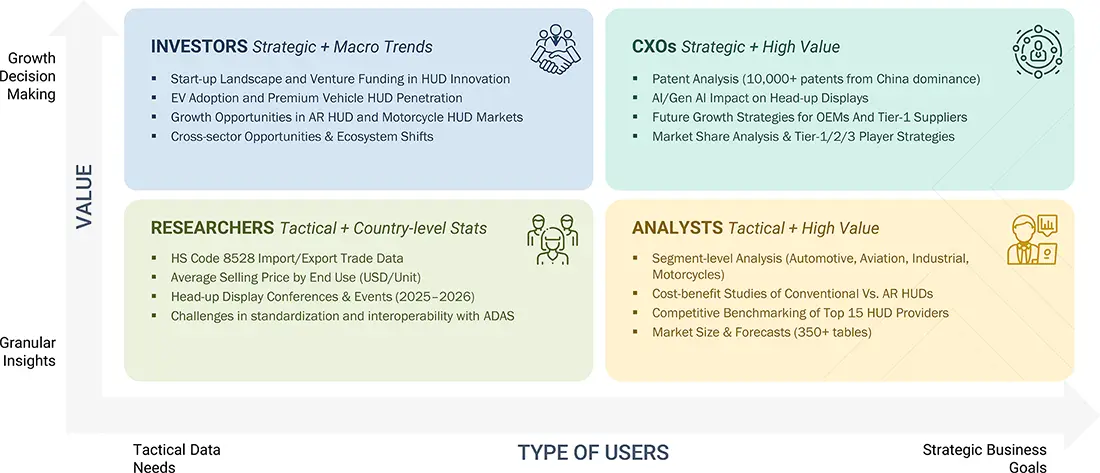
WHAT IS IN IT FOR YOU: Head-up Display (HUD) Market REPORT CONTENT GUIDE
DELIVERED CUSTOMIZATIONS
We have successfully delivered the following deep-dive customizations:
| CLIENT REQUEST | CUSTOMIZATION DELIVERED | VALUE ADDS |
|---|---|---|
| European Automotive OEM | • Competitive benchmarking of conventional vs. AR HUD integration in premium and mid-segment vehicles | • Helped refine product positioning for next-gen HUD rollouts • Identified adoption roadmap across vehicle classes |
| North American Defense Contractor | • Technology road mapping for advanced AR HUD adoption in military aviation and tactical vehicles | • Reduced program risks with clear adoption timelines • Supported procurement strategies for mission-critical systems |
| Global Tier-1 Supplier | • Cost-performance trade-off analysis for video generators and projection units | • Optimized sourcing strategy • Identified opportunities for localization and reduced supply chain risks |
| European Aviation Manufacturer | • Regulatory and certification benchmarking for HUD use in cockpits | • Accelerated certification process • Highlighted compliance risks and streamlined approval strategy |
| Asian Motorcycle Manufacturer | • Market feasibility study on wearable HUDs for motorcycle helmets | • Informed new product development strategy • Supported diversification into mobility and safety wearables |
RECENT DEVELOPMENTS
- July 2025 : Valeo was chosen by a leading Chinese OEM to equip upcoming vehicle models with its advanced pillar-to-pillar head-up display. This panoramic system transforms the windshield into an interactive interface by projecting essential information directly into the driver’s field of vision. Utilizing high-efficiency displays embedded within the dashboard, the system reflects data onto a specially treated lower windshield section. In line with China’s rapid innovation cycle, Valeo supports its customers with production slated to begin in 2026.
- June 2025 : Xpeng, in collaboration with Huawei, developed an augmented reality head-up display (AR-HUD) system called “Chasing Light Panorama” for its upcoming mid-size electric SUV, the G7. The system combines Huawei’s hardware expertise with Xpeng’s software capabilities to deliver advanced navigation and enhanced driving assistance features.
- April 2025 : Nippon Seiki Co., Ltd. entered a joint venture agreement in India with Emerging Display Technologies Corporation (Taiwan), a manufacturer of high-definition TFT LCD modules. Under this partnership, the two companies will establish a new jointly funded entity, EDT-India Private Limited, focused on manufacturing TFT LCD modules in India. The newly planned facility aims to massively produce automotive TFT LCD modules by 2027.
- January 2023 : HARMAN introduced Ready Vision, an integrated suite of AR head-up display (HUD) hardware and software solutions to enhance driver safety and situational awareness. The Ready Vision AR software synchronizes with vehicle sensors to provide immersive audio and visual alerts, delivering critical information to drivers in a timely, precise, and non-intrusive manner.
- January 2022 : Panasonic Holdings Corporation unveiled the AR-HUD 2.0, the first product to include a new patented eye-tracking system, ETS, enhancing the AR experience. This HUD also includes AI-powered navigation software with 3D AR overlays, icons, and mappings.
FAQ
1: What is the current size of the Head-Up Display (HUD) market and how fast is it growing?
The Head-Up Display (HUD) market is witnessing strong growth, driven by rising adoption across automotive, aerospace & defense, and commercial aviation sectors. The market is expected to grow steadily through the forecast period, supported by increasing demand for advanced visualization systems, safety features, and digital cockpit technologies.
2: What are the key trends shaping the HUD market?
Major trends in the HUD market include the adoption of augmented reality (AR)-based HUDs, wider field-of-view displays, high-resolution digital optics, and seamless integration with AI, sensors, and connected vehicle or aircraft systems. Lightweight and energy-efficient HUD devices are also gaining traction.
3: Which devices and applications drive demand in the HUD industry?
HUD devices are widely used in automotive dashboards, aircraft cockpits, military platforms, and helicopters. Key applications include navigation guidance, safety alerts, flight and vehicle status monitoring, weapon targeting (defense), and enhanced situational awareness.
4: How is the HUD market segmented by industry and share?
The HUD market is segmented by industry into automotive, aerospace & defense, and commercial aviation, with automotive and aerospace segments holding significant market share. Aerospace & defense HUDs dominate in terms of technology value, while automotive HUDs lead in volume deployment.
5: What is the forecast and future growth outlook for the HUD market?
The HUD market is forecast to grow at a healthy CAGR over the coming years, supported by advancements in AR, smart mobility, aviation modernization, and rising safety regulations. Increasing investments in autonomous vehicles, smart cockpits, and next-generation aircraft will further drive market expansion.
Table of Contents
 Exclusive indicates content/data unique to MarketsandMarkets and not available with any competitors.
Methodology
The study involved major activities in estimating the current market size for the global Head-Up Display market. Exhaustive secondary research was done to collect information on the market. The next step was to validate these findings, assumptions, and sizing with industry experts across the value chain using primary research. Different approaches, such as top-down and bottom-up, were employed to estimate the total market size. After that, the market breakup and data triangulation procedures were used to estimate the market size of the segments and subsegments of the head-up display market.
Secondary Research
The secondary research for this study involved gathering information from a range of credible sources. These included company annual reports, investor presentations, press releases, whitepapers, certified publications, and articles from reputable associations and government publications. Additional data was obtained from corporate filings, professional and trade associations, journals, and industry-recognized authors. Research from consortia, councils, and gold- and silver-standard websites, directories, and databases also contributed to the qualitative framework. Key global sources, such as the International Trade Centre (ITC) and the International Monetary Fund (IMF), were consulted to support and validate the market analysis.
Primary Research
Extensive primary research was conducted after understanding and analyzing the head-up display market scenario through secondary research. Several primary interviews were conducted with key opinion leaders from demand- and supply-side vendors across four major regions—North America, Europe, Asia Pacific, and RoW. Approximately 20% of the primary interviews were conducted with the demand side and 80% with the supply side. Primary data was collected through questionnaires, e-mails, and telephonic interviews. Various departments within organizations, such as sales, operations, and administration, were contacted to provide a holistic viewpoint in the report.
 Market Size, and Share")
To know about the assumptions considered for the study, download the pdf brochure
Market Size Estimation
Both top-down and bottom-up approaches were used to estimate and validate the total size of the head-up display market. These methods were also used extensively to estimate the size of various subsegments in the market. The research methodology used to estimate the market size includes the following:
Head-up Display (HUD) Market : Top-Down and Bottom-Up Approach
 Market Top Down and Bottom Up Approach")
Data Triangulation
After arriving at the overall size of the head-up display market through the process explained above, the overall market has been split into several segments. Data triangulation procedures have been employed to complete the overall market engineering process and arrive at the exact statistics for all the segments, wherever applicable. The data has been triangulated by studying various factors and trends from the demand and supply sides. The market has also been validated using top-down and bottom-up approaches.
Market Definition
A head-up display (HUD) is a visual system that projects key information, such as speed, navigation cues, or safety alerts, directly into the user’s line of sight, typically onto a windshield, combiner, or wearable device. Its purpose is to provide critical data without requiring the driver or pilot to look away from their primary viewpoint, thereby enhancing safety, reducing distractions, and improving situational awareness.
Key Stakeholders
- Raw material suppliers
- Original equipment manufacturers (OEMs)
- Original design manufacturers (ODM)
- Research institutes
- Head-up display solution providers
- Forums, alliances, and associations
- Governments and financial institutions
- Analysts and strategic business planners
- Distributors
- End users
Report Objectives
- To describe and forecast the size of the global Head-Up Display market, by type, component, form factor, and end user, in terms of value
- To describe and forecast the global Head-Up Display market size of various segments across four key regions—North America, Europe, Asia Pacific, and the Rest of the World (RoW), in terms of value
- To describe and forecast the size of the global Head-Up Display market, by end user, in terms of volume
- To provide detailed information regarding the drivers, restraints, opportunities, and challenges influencing the growth of the global Head-Up Display market
- To provide an overview of the value chain pertaining to the global Head-Up Display ecosystem and the average selling prices of head-up displays
- To provide a detailed overview of the impact of AI/Gen AI and the US 2025 tariff on the global Head-Up Display market
- To provide information about key technological trends, trade analysis, and patents related to head-up displays
- To benchmark the market players using the proprietary company evaluation matrix framework, which analyzes them on various parameters within the broad categories of market ranking/share and product portfolio in the global Head-Up Display
- To analyze competitive developments, such as partnerships, acquisitions, agreements, collaborations, and product launches in the global Head-Up Display market
- To strategically profile key players and analyze their market share, ranking, and core competencies in the global Head-Up Display market
Customization Options
With the market data given, MarketsandMarkets offers customizations according to the company’s specific needs. The following customization options are available for the report:
Company Information:
- Detailed analysis and profiling of additional market players (up to 7)
Key Questions Addressed by the Report
What is the current size of the Head-Up Display (HUD) market?
The global Head-Up Display (HUD) market is valued at USD 4.20 billion in 2025 and is projected to reach USD 7.34 billion by 2030. (MarketsandMarkets)
What is the expected growth rate of the HUD market?
The market is expected to grow at a CAGR of 11.8% during the forecast period from 2025 to 2030. (MarketsandMarkets)
What are the major growth drivers for the HUD industry?
Growth is driven by increasing adoption of Advanced Driver Assistance Systems (ADAS), demand for enhanced road safety, connected vehicles, electric vehicles, and augmented reality (AR) technologies in automotive applications. (MarketsandMarkets)
What are the key technology trends in the HUD market?
Major trends include AR-based HUDs, high-resolution display technologies, waveguide optics, real-time navigation overlays, and integration with autonomous and connected vehicle systems. (MarketsandMarkets)
Which segment dominates the HUD market by end user?
The automotive segment is expected to account for the largest market share due to rising demand for navigation assistance, safety alerts, and immersive driving experiences. (MarketsandMarkets)
Which HUD type is witnessing the fastest growth?
Augmented Reality (AR) HUDs are expected to be the fastest-growing segment because they provide contextual navigation, lane guidance, and enhanced driver awareness. (MarketsandMarkets)
Which region is expected to grow the fastest in the HUD market?
Asia Pacific is projected to record the highest growth, with a CAGR of approximately 14.3% from 2025 to 2030, driven by strong automotive production and adoption of advanced vehicle technologies. (MarketsandMarkets)
Who are the leading companies operating in the HUD market?
Key players include Nippon Seiki Co., Ltd., Continental AG, Panasonic Holdings Corporation, Valeo, and DENSO CORPORATION. (MarketsandMarkets)
What opportunities exist in the HUD market?
Opportunities include expansion of HUDs into mid-range vehicles, wearable HUD applications, electric and autonomous vehicles, aviation systems, and industrial hands-free visualization solutions. (MarketsandMarkets)
How is the HUD market analyzed in the report?
The report uses top-down and bottom-up market sizing methodologies, data triangulation, competitive benchmarking, company analysis, regional assessments, and forecast modeling to estimate market size and growth. (MarketsandMarkets)
Need a Tailored Report?
Customize this report to your needs
Get 10% FREE Customization
Customize This ReportPersonalize This Research
- Triangulate with your Own Data
- Get Data as per your Format and Definition
- Gain a Deeper Dive on a Specific Application, Geography, Customer or Competitor
- Any level of Personalization
Let Us Help You
- What are the Known and Unknown Adjacencies Impacting the Head-up Display (HUD) Market
- What will your New Revenue Sources be?
- Who will be your Top Customer; what will make them switch?
- Defend your Market Share or Win Competitors
- Get a Scorecard for Target Partners

Custom Market Research Services
We Will Customise The Research For You, In Case The Report Listed Above Does Not Meet With Your Requirements
Get 10% Free CustomisationTESTIMONIALS

Tetsuya Ohhira
Business Development Manager-Technology Business
Nikon Corporation,
Leading Japanese MNC specializing in optics and imaging productswww.nikon.com
MarketsandMarkets™ response
is quick. Their attitude is flexible and positive. Analyst Insights are globally considered and
significant. Client Services quickly respond to our inquiry and demand. Their wide range of global
surveys help us make our strategic plan.
We hope Knowledge Store will be easier to search
for a report.
VP - Marketing & Business Development
Leading Provider of Process Control Solutions
We engaged with MarketsandMarkets on a study to perform an analysis and recommend a Go-To-Market strategy for metrology and process control in the semiconductor market. The study was tailored to our targets and needs with well-defined milestones. Our overall experience with the MarketsandMarkets team was very good throughout the project in all aspects including the analysis methodologies used, the quality and depth of primary and secondary data sets, the professionalism and flexibility of the team and the ability to meet the target schedule and milestones. We want to thank MarketsandMarkets team for a job well done.
- Canada Head-up Display (HUD) Market
- Mexico Head-up Display (HUD) Market
- US Head-up Display (HUD) Market
- Germany Head-up Display (HUD) Market
- UK Head-up Display (HUD) Market
- France Head-up Display (HUD) Market
- Italy Head-up Display (HUD) Market
- Spain Head-up Display (HUD) Market
- Poland Head-up Display (HUD) Market
- China Head-up Display (HUD) Market
- Japan Head-up Display (HUD) Market
- South Korea Head-up Display (HUD) Market
- India Head-up Display (HUD) Market
- Australia Head-up Display (HUD) Market
- Indonesia Head-up Display (HUD) Market
- Malaysia Head-up Display (HUD) Market
- Thailand Head-up Display (HUD) Market
- Vietnam Head-up Display (HUD) Market
- Nordics Head-up Display (HUD) Market
- Rest Of Europe Head-up Display (HUD) Market
- Rest Of Asia Pacific Head-up Display (HUD) Market
Growth opportunities and latent adjacency in Head-up Display (HUD) Market


Arthur
Apr, 2026
I�m considering purchasing this Head-up Display Market report�does it analyze long-term growth opportunities across automotive and aviation applications?.
User
Sep, 2019
The demand for HUDs is high in automotive as well as in aerospace sector. I would like to know in detail, which of these sectors would grow at a high rate and where would the return on investment (RoI) be high? Is this aspect of comparative analysis between these two applications been covered in detail in your report?.
User
Sep, 2019
What would be the major differentiating factors between AR HUD and conventional HUDs? Which would be the one preferred by the car makers considering their features, avaialability, as well as pricing? Would you be able to provide the major players producing both these HUDs and their product features?.
User
Sep, 2019
The European region leads in production of high-end cars. Will this also be in line with the demand of HUDs? I would like to know the regionwise demand of HUDs and the key reasons behind the analysis. Does your report cover the regionwise data of HUDs and analysis?.