
AI as a Service Market Size, Share, Growth & Latest Trends

AI as a Service Market by Product Type (Chatbots & AI Agents, ML Framework, API, No Code/Low Code Tools, Data Labeling), Service Type (ML as a Service, NLP as a Service, Generative AI as a Service), Business Function, End User - Global Forecast to 2030


OVERVIEW
Source: Secondary Research, Interviews with Experts, MarketsandMarkets Analysis
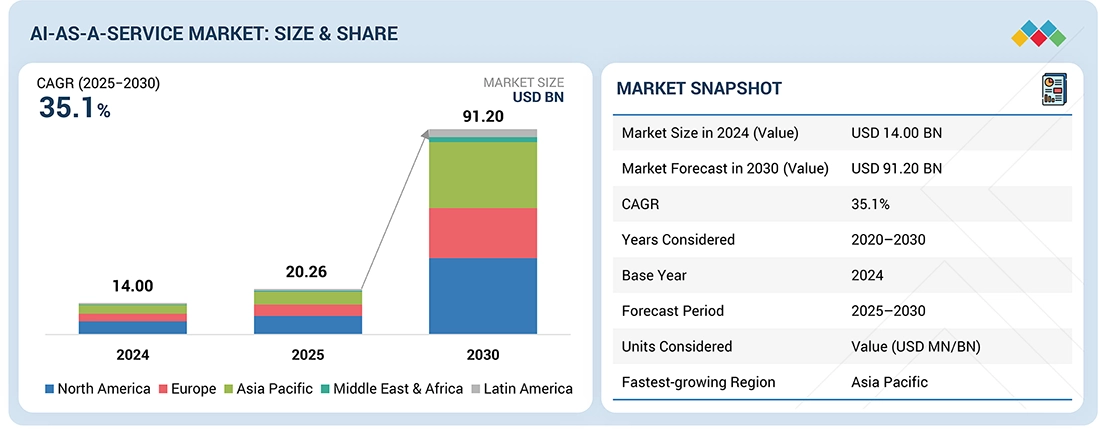
The AI-as-a-Service (AIaaS) market is undergoing exponential growth, projected to surge from USD 20.26 billion in 2025 to USD 91.20 billion by 2030, reflecting a CAGR of 35.1%. This expansion is driven by the increasing enterprise demand for cost-effective, scalable, and cloud-delivered AI capabilities across diverse sectors. AIaaS platforms are transforming industries by enabling automated decision-making, predictive analytics, Natural language processing (NLP), Computer vision, and AI-powered customer support and workflow automation. Key verticals such as healthcare, BFSI, retail, and manufacturing are leveraging AIaaS to Bridge workforce gaps (over 30% of organizations), Accelerate case resolution rates (improved by 30–40%), and adopt low-code/no-code platforms (preferred by 75% of enterprises) to free up developer resources.
Market Size and Forecast:
- 2024 Market Size: USD 14.00 Billion
- 2025 Projected Market Size: USD 20.26 Billion
- 2030 Forecasted Market Size: USD 91.20 Billion
- Growth Rate (2025-2030): CAGR of 35.1%
- Data available from 2025 to 2030
Key Market Trends and Insights
- Fastest Growing region: Asia Pacific
-
Growth Drivers: cloud adoption, low-cost AI access, and rising enterprise automation demand.
- Latest Trends: Generative AI, industry-specific AI models, multi-cloud deployment, and scalable automation
- Key Opportunities: in automation, predictive analytics, personalized customer experiences, and scalable AI adoption
- Startup Innovations: Generative AI platforms, no-code AI tools, autonomous agents, and vertical-specific AI solutions
- Leading Companies: Microsoft (US), IBM (US), Google (US), AWS (US), OpenAI (US), NVIDIA (US), Salesforce (US)
KEY TAKEAWAYS
- North America is estimated to be the largest regional market for AI as a service in 2025.
- By product type, the no-code or Iow-code ML tools segment is expected to register the highest CAGR of 38.9% during the forecast period.
- By organization size, the market for the small and medium-sized enterprises sub-segment is expected to register a higher CAGR of 36.8% during the forecast period.
- Based on business function, the sales segment accounted for the largest market share of 31.5% in 2024.
- By service type, the generative AI as a service segment is expected to showcase highest CAGR during the forecast period, 2025-2030.
- By end users, BFSI end users are projected to register the largest market size in 2025.
- Companies such as Microsoft, Google, and AWS were identified as some of the star players in the AI as a service Market, given their strong market share and product footprint.
- Companies Scale AI, Cohere, and Mistral AI, among others, have distinguished themselves among startups and SMEs by securing strong footholds in specialized niche areas, underscoring their potential as emerging market leaders.
The AI-as-a-Service (AIaaS) market is witnessing strong growth, driven by enterprise demand for cost-effective AI solutions, accelerated cloud adoption, and the need for business efficiency and automation. Organizations are leveraging cloud-based AI platforms to access pre-trained models, APIs, and AI tools without heavy infrastructure investment, reducing the total cost of ownership. Cloud-native, containerized, and edge-compatible AIaaS solutions are enabling rapid deployment across functions, while advancements in machine learning, NLP, computer vision, and MLOps are expanding applicability across industries like healthcare, finance, retail, and manufacturing.
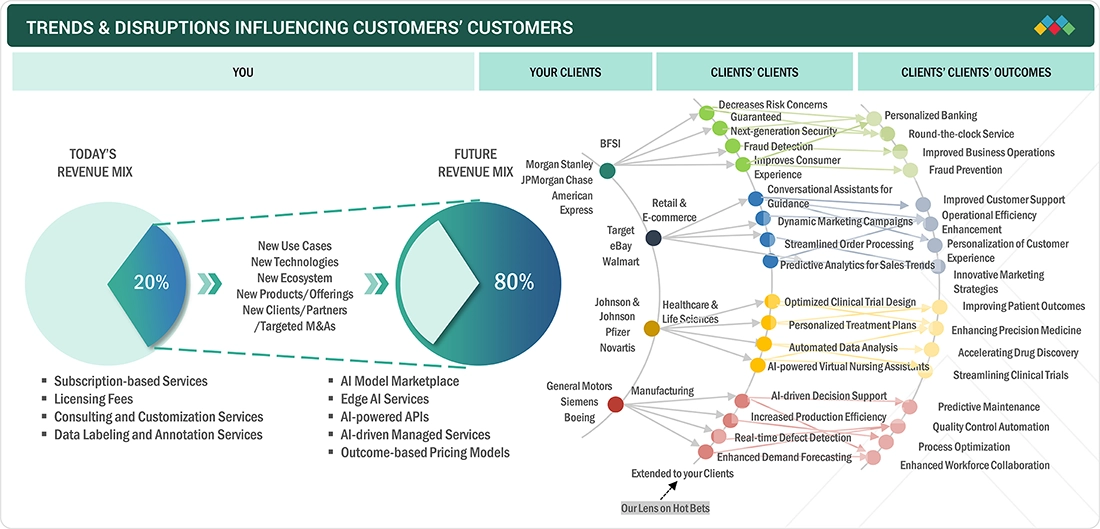
TRENDS & DISRUPTIONS IMPACTING CUSTOMERS' CUSTOMERS
Key trends and disruptions shaping the AI as a Service (AIaaS) market, highlighting the shift from traditional subscription-based services to AI-driven, outcome-based models. It maps how evolving technologies, new use cases, and strategic collaborations are transforming client imperatives across industries driving automation, personalization, and operational efficiency for end customers.
Source: Secondary Research, Interviews with Experts, MarketsandMarkets Analysis
MARKET DYNAMICS
Level
-
Increasing need for pre-trained AI models requiring minimal customization

-
Increasing adoption of AI-enhanced threat detection, anomaly monitoring, and automated incident response

Level
-
Limited AI model explainability & transparency

-
Energy consumption of large-scale AI models and cloud data centers raising concerns

Level
-
Expansion of AI marketplaces & plug-and-play AI models

-
GenAIaaS for marketing, design, and knowledge automation

Level
-
Costs associated with maintaining and scaling high-performance AI infrastructure

-
Mitigating risks associated with AI model drift and Hallucination

Source: Secondary Research, Interviews with Experts, MarketsandMarkets Analysis
Driver: Increasing need for pre-trained AI models requiring minimal customization
The AI-as-a-Service (AIaaS) market is experiencing significant growth, fueled primarily by the growing availability and complexity of pre-trained AI models. These models, which are optimized to perform tasks such as natural language processing, image recognition, and predictive analytics, are dramatically reducing the entry barriers that have long been associated with AI adoption. Pre-trained AI models provide integrated features that demand little customization, allowing organizations to adopt AI-driven solutions without needing extensive technical knowledge or prolonged development periods. This plug-and-play method improves accessibility, enabling businesses of any size to leverage advanced AI features with lower investment and quicker returns.
Restraint: Limited AI model explainability & transparency
Despite the growing adoption of AI as a Service, a significant barrier hindering its wider implementation is the limited explainability and transparency of many AI models, particularly in high-stakes and heavily regulated industries such as finance, healthcare, and legal services. Many AIaaS offerings function as black-box systems, where the internal decision-making logic is too complex or insufficiently documented to be easily understood by end users. This opacity generates serious concerns around algorithmic bias, accountability, and regulatory compliance, and thus, vendors must prioritize explainable AI (XAI) and model interpretability to build trust and meet compliance standards.
Opportunity: Expansion of AI marketplaces & plug-and-play AI models
The rise and swift growth of AI marketplaces is transforming the AIaaS market by making advanced AI functionalities available to companies of all sizes. These marketplaces act as centralized hubs where businesses can effortlessly explore, tailor, and implement pre-trained AI models without requiring internal data science teams or extensive technical expertise. This change significantly affects small and medium-sized enterprises, as they frequently do not have the financial and human resources needed for comprehensive AI development. AI marketplaces are slashing deployment times and enhancing operational efficiency by offering plug-and-play solutions for various applications such as natural language processing, predictive analytics, and computer vision.
Challenge: Costs associated with maintaining and scaling high-performance AI infrastructure
AI-as-a-Service (AIaaS) providers face serious challenges when managing the hefty costs of maintaining and scaling the complex infrastructure needed for advanced AI capabilities. Running high-performance AI models requires powerful GPUs, specialized hardware, and a ton of computational resources, all of which drive up operational expenses. Energy consumption is another big issue, as handling large-scale AI workloads demands a constant power supply, leading to high electricity bills and environmental concerns. With rising client expectations for speed, accuracy, and scalability, vendors must invest in robust cloud environments, energy-efficient technologies, and Sustainable compute architectures. Balancing innovation with cost-efficiency is critical to maintaining competitiveness in a rapidly evolving market.
AI as a Service Market: COMMERCIAL USE CASES ACROSS INDUSTRIES
| COMPANY | USE CASE DESCRIPTION | BENEFITS |
|---|---|---|
 |
Alaska Airlines faced challenges with on-time performance and maintenance-related delays, impacting safety and efficiency. Using Microsoft Azure AI-as-a-Service, the airline implemented a predictive maintenance model that analyzed aircraft telemetry and operational data. This solution helped forecast potential failures in advance, reducing delays, improving operational safety, and enhancing the overall reliability of flight operations. | 10% improvement in on-time performance, translating to millions in cost savings | Reduced maintenance costs through early issue detection | Enhanced safety by proactively addressing mechanical risks | Scalable AI deployment across fleet operations using cloud-native infrastructure |
 |
RSRG needed to improve PPE compliance, reduce vehicle near-miss incidents, and optimize equipment utilization across construction sites while staying within budget. The Viso.ai solution was deployed to detect and track machinery usage, monitor idle versus active states, and generate weekly utilization reports. This enabled site directors to enhance worker safety, optimize resource allocation, and reduce operational inefficiencies. | Full visibility into equipment operations across sites | Data-driven safety enforcement and compliance tracking | Operational optimization through targeted site planning | Cost control via AI-enabled resource management |
Logos and trademarks shown above are the property of their respective owners. Their use here is for informational and illustrative purposes only.
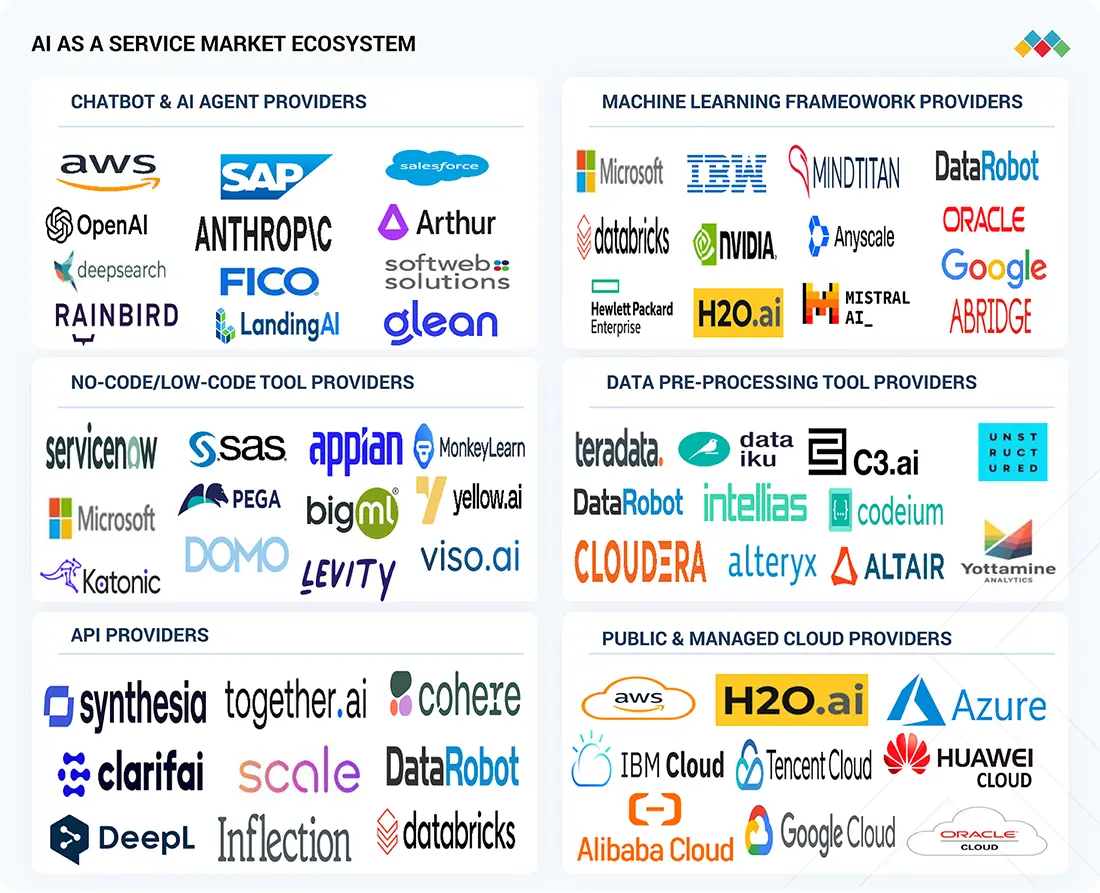
MARKET ECOSYSTEM
The AI-as-a-Service market ecosystem comprises a diverse range of stakeholders. Key players include chatbot & AI agent providers, machine learning framework providers, no-code/low-code tool providers, data labeling & pre-processing tool providers, API providers, and public and managed cloud providers. These entities collaborate to develop, deliver, and utilize AI solutions, driving innovation and growth in the AI industry.
Logos and trademarks shown above are the property of their respective owners. Their use here is for informational and illustrative purposes only.
MARKET SEGMENTS
Source: Secondary Research, Interviews with Experts, MarketsandMarkets Analysis
AI-as-a-Service Market, by Product Type
No-code and low-code machine learning platforms are projected to witness the highest CAGR during the forecast period, as they enable rapid AI adoption across industries. These tools allow non-technical users to build and deploy AI models with minimal coding, reducing reliance on specialized data science teams. By supporting scalable automation for decision-making and advanced analytics, they are transforming enterprise operations. Vendors offering drag-and-drop interfaces, pre-built templates, and seamless integrations with enterprise applications are gaining strong traction among SMEs and large enterprises alike.
AI-as-a-Service Market, by Organization Size
Large enterprises are estimated to dominate the AIaaS market by 2025, supported by higher IT budgets, advanced digital infrastructure, and strong partnerships with leading cloud and AI providers. These organizations are prioritizing enterprise-wide AI deployment to enhance customer engagement, optimize operations, and strengthen competitive differentiation. By adopting scalable AIaaS platforms, large enterprises are expanding use cases across marketing, finance, human resources, and supply chain functions, driving faster digital transformation and maximizing business value from AI investments.
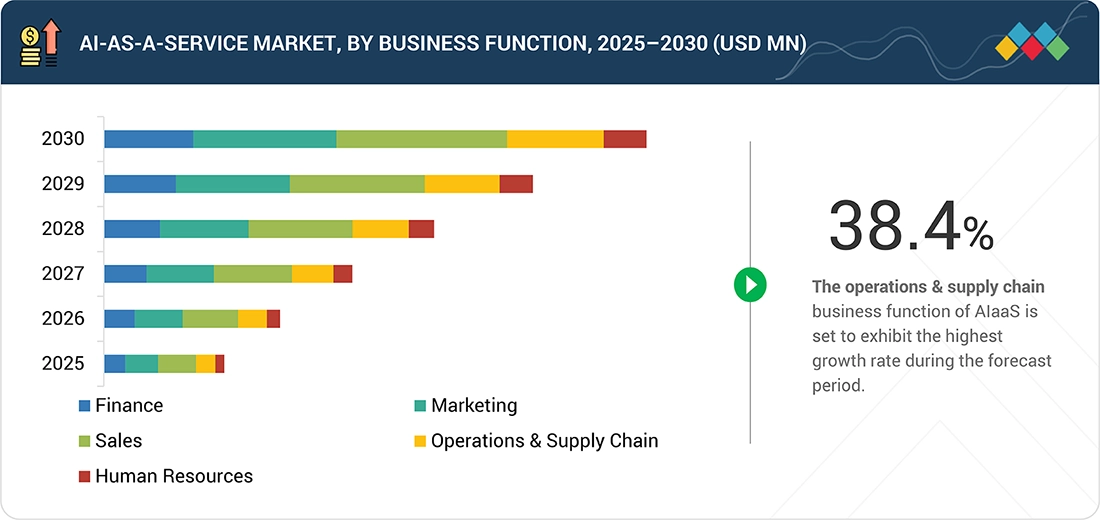
AI-as-a-Service Market, by Business Function
The operations and supply chain function is projected to record the highest CAGR in the AIaaS market, as enterprises increasingly adopt AIaaS for demand forecasting, route optimization, and inventory management. With rising global supply chain disruptions and cost pressures, organizations are turning to AIaaS to gain real-time visibility, predictive insights, and intelligent automation. These capabilities enable more resilient logistics planning, streamlined operations, and improved efficiency, making operations and supply chain a key growth area for AIaaS adoption.
AI-as-a-Service market, by Service Type
Machine Learning-as-a-Service (MLaaS) held the largest market share in 2024, establishing it as the most adopted AIaaS category. MLaaS platforms provide pre-trained models, customizable algorithms, and scalable cloud infrastructure, along with advanced data processing tools for large-scale analytics. Widely used for fraud detection, personalization, business intelligence, and risk modeling, MLaaS enables organizations to deploy AI faster and at scale. Its flexibility and broad applicability make it a preferred solution across diverse industries seeking a competitive advantage.
AI-as-a-Service Market, by End User
The banking, financial services, and insurance (BFSI) sector is projected to hold the largest share of the AIaaS market by 2025. BFSI enterprises are leveraging AIaaS for fraud detection, risk assessment, personalized customer experiences, automated customer support, and compliance monitoring. With the surge in digital banking, online transactions, and stringent regulatory requirements, the BFSI industry remains one of the earliest and fastest adopters of AIaaS solutions, driving innovation and operational efficiency across financial services.
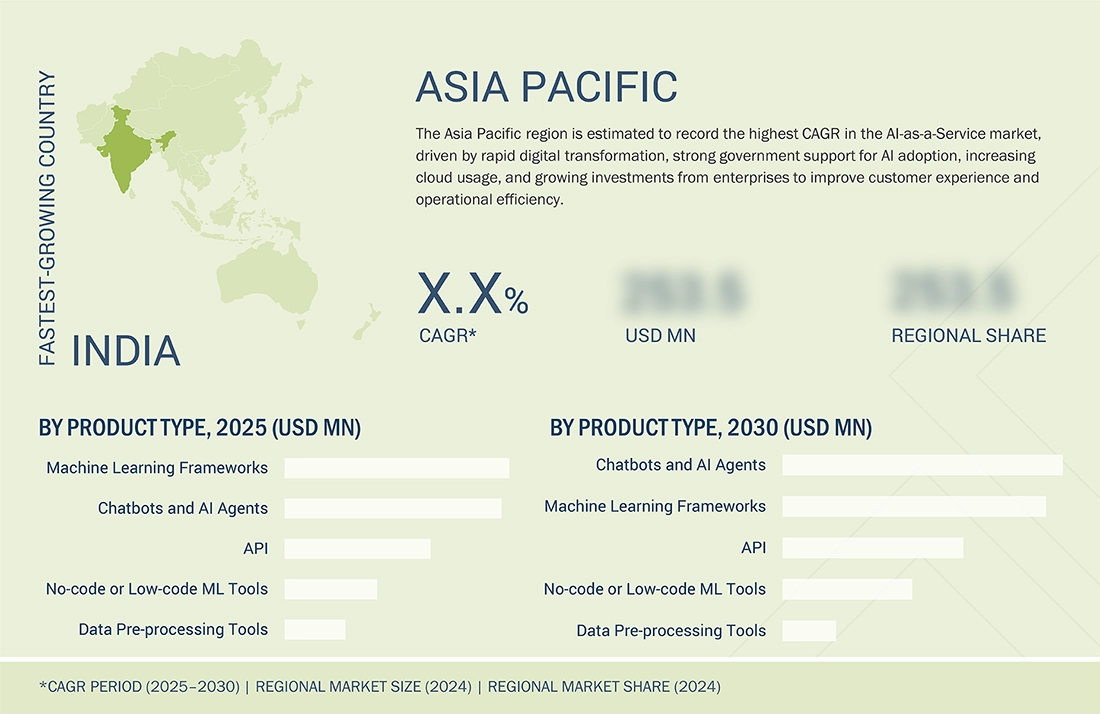
REGION
Asia Pacific to be the fastest-growing region in the global AI-as-a-Service market during the forecast period
The Asia Pacific (APAC) region is set to record the highest growth in the global AI-as-a-Service (AIaaS) market, driven by rapid digital transformation, strong government-led AI initiatives, and increasing enterprise cloud adoption. Key economies like China are advancing smart city development, AI-powered manufacturing, and cloud infrastructure, while India is leveraging IT services, healthcare, and finance with support from its National AI Strategy. Japan, through its Society 5.0 vision, is promoting human-centric AI, robotics, and smart infrastructure. With a tech-literate workforce, rising demand for plug-and-play AI models, and scalable cloud-native AIaaS platforms, vendors must deliver localized AI solutions, build strong partnerships, and ensure infrastructure readiness for high-volume, real-time AI workloads.
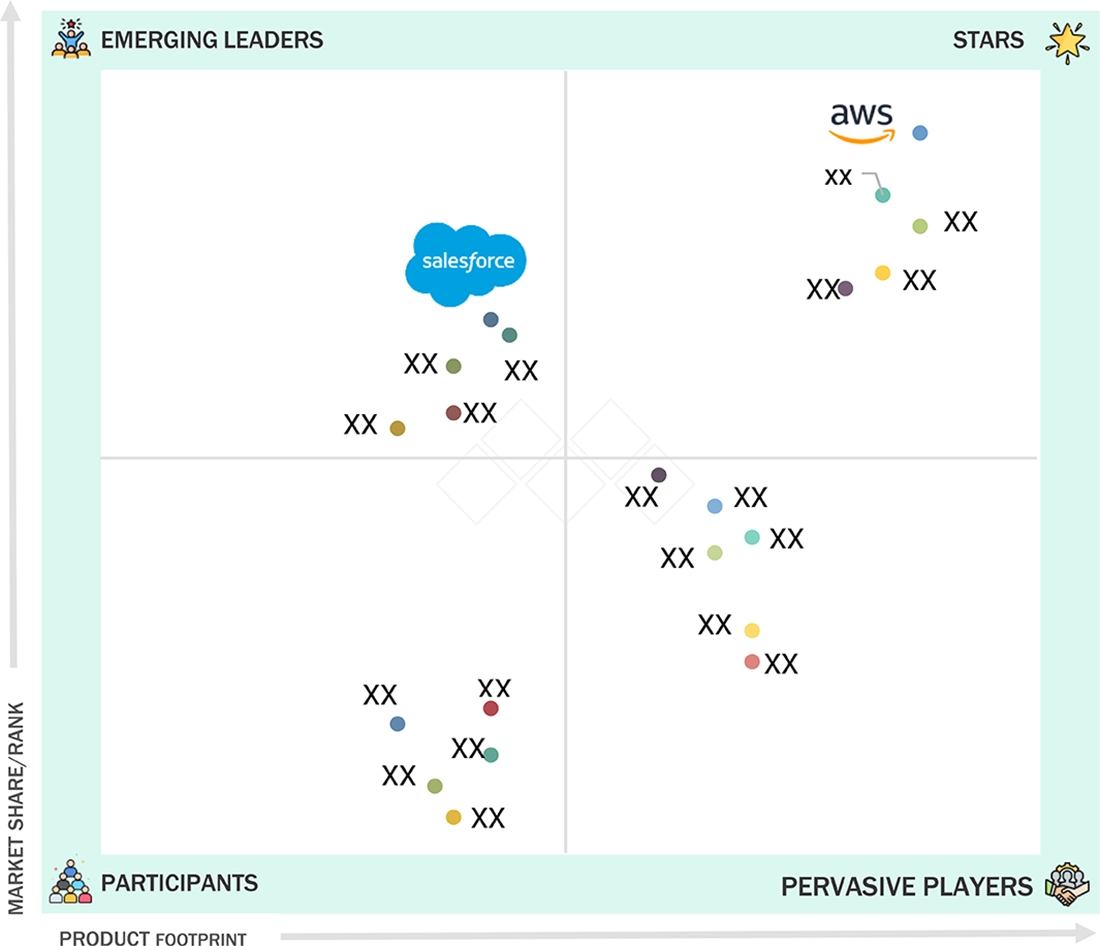
AI as a Service Market: COMPANY EVALUATION MATRIX
In the AI-as-a-Service market, AWS is positioned in the “Stars” quadrant, backed by its robust cloud foundation, broad AI portfolio, and innovation-led growth. Salesforce is categorized as an “Emerging Leader,” driven by its strong AI-powered CRM ecosystem, industry-focused solutions, and rising adoption of its Einstein platform.
Source: Secondary Research, Interviews with Experts, MarketsandMarkets Analysis
KEY MARKET PLAYERS
MARKET SCOPE
| REPORT METRIC | DETAILS |
|---|---|
| Market Size in 2024 (Value) | USD 14.00 Billion |
| Market Forecast in 2030 (Value) | USD 91.20 Billion |
| Growth Rate | 35.1% |
| Years Considered | 2020–2030 |
| Base Year | 2024 |
| Forecast Period | 2025–2030 |
| Units Considered | USD Million/Billion |
| Report Coverage | Market Forecast, Company Ranking, Competitive Landscape, Growth Factors, Trends |
| Segments Covered |
|
| Regions Covered | North America, Asia Pacific, Europe, South America, Middle East & Africa |
WHAT IS IN IT FOR YOU: AI as a Service Market REPORT CONTENT GUIDE
DELIVERED CUSTOMIZATIONS
We have successfully delivered the following deep-dive customizations:
| CLIENT REQUEST | CUSTOMIZATION DELIVERED | VALUE ADDS |
|---|---|---|
| Leading AI as a Service Vendor |
|
|
| Leading AI as a Service Vendor |
|
|
RECENT DEVELOPMENTS
- April 2025 : IBM expanded its AIaaS capabilities by acquiring Hakkoda Inc., a global data and AI consultancy. This acquisition strengthened IBM Consulting’s data transformation portfolio, offering enhanced data readiness for AI-powered business operations, deeper expertise in modern data platforms, and scalable AIaaS deployment across industries. With this move, IBM is positioned to deliver end-to-end AIaaS solutions, covering everything from data engineering and platform modernization to advanced AI model deployment.
- March 2025 : Publicis Sapient announced a global strategic collaboration with Amazon Web Services (AWS) to accelerate enterprise IT modernization. The partnership leveraged AWS’s generative AI services to build personalized customer experiences, reduce churn, and enhance loyalty. By driving digital business transformation across industries, the collaboration addresses rising demand for AIaaS platforms that enable marketing automation, advanced customer analytics, and hyper-personalized experience management, positioning both companies to support enterprises in delivering scalable, customer-centric AI solutions.
- January 2025 : Pearson and Microsoft entered a multiyear partnership to embed AI-powered solutions into Pearson’s global skilling and education platforms. The collaboration focused on AI-driven personalized learning paths, workforce development for both employers and learners, and scalable AIaaS integration into edtech ecosystems. This initiative demonstrated how AI-as-a-Service is reshaping education technology, enabling adaptive learning, digital workforce enablement, and large-scale upskilling, while aligning with the growing demand for AI-driven personalized education solutions worldwide.
- January 2025 : AWS partnered with General Catalyst to deploy AI-powered healthcare solutions. The initiative emphasizes predictive and personalized care, improved diagnostics, and enhanced patient engagement, while boosting operational and clinical efficiency. Leveraging AWS’s AIaaS healthcare offerings, the collaboration underscored the growing adoption of AI in healthcare, with a strong focus on interoperability, real-time decision support, and advanced healthcare data analytics. This partnership accelerated the use of AIaaS platforms to drive innovation across clinical and patient care ecosystems.
- January 2025 : Servier expanded its partnership with Google Cloud to advance AI and machine learning applications in healthcare. The collaboration focused on accelerating drug discovery and clinical trials, optimizing patient care, and enhancing healthcare data analytics. By leveraging Google Cloud’s AIaaS solutions, Servier aimed to drive precision medicine initiatives, improve clinical outcomes, and speed up research and development. This partnership highlighted the critical role of AIaaS in healthcare innovation, particularly in life sciences and advanced therapeutics.
Table of Contents
 Exclusive indicates content/data unique to MarketsandMarkets and not available with any competitors.
Methodology
The research study for AI as a Service market involved extensive secondary sources, directories, journals, and paid databases. Primary sources were mainly industry experts from the core and related industries, preferred AI as a Service providers, third-party service providers, consulting service providers, end users, and other commercial enterprises. In-depth interviews were conducted with various primary respondents, including key industry participants and subject matter experts, to obtain and verify critical qualitative and quantitative information and assess the market’s prospects.
Secondary Research
In the secondary research process, various sources were referred to identify and collect information for the study. The secondary sources included annual reports, press releases, and investor presentations of companies; white papers, journals, and certified publications; and articles from recognized authors, directories, and databases. The data was also collected from other secondary sources, such as IoT conferences and related magazines. Additionally, the AI as a Service spending of various countries was extracted from respective sources. Secondary research was used to obtain key information about the industry’s value chain and supply chain to identify key players by solution, service, market classification, and segmentation according to the offerings of major players and industry trends related to solutions, applications, verticals, and regions, and key developments from both market and technology-oriented perspectives.
Primary Research
In the primary research process, various primary sources from supply and demand sides were interviewed to obtain qualitative and quantitative information on the market. The primary sources from the supply side included various industry experts, including Chief Experience Officers (CXOs); Vice Presidents (VPs); directors from business development, marketing, and AI as a Service expertise; related key executives from AI as a Service solution vendors, SIs, managed service providers, and industry associations; and key opinion leaders.
Primary interviews were conducted to gather insights, such as market statistics, revenue data collected from solutions and services, market breakups, market size estimations, market forecasts, and data triangulation. Primary research also helped understand various trends related to technologies, applications, service types, product types, end users, and regions. Stakeholders from the demand side, such as Chief Information Officers (CIOs), Chief Technology Officers (CTOs), Chief Strategy Officers (CSOs), and end users using AI as a Service solution, were interviewed to understand the buyer’s perspective on suppliers, products, service providers, and their current usage of AI as a Service, which would impact the overall AaaS market.

Note: Tier 1 companies account for annual revenue of >USD 10 billion; tier 2 companies’ revenue ranges
between USD 1 and 10 billion; and tier 3 companies’ revenue ranges between USD 500 million and USD 1 billion
Source: MarketsandMarkets Analysis
To know about the assumptions considered for the study, download the pdf brochure
Market Size Estimation
Multiple approaches were adopted to estimate and forecast the AI as a service market. The first approach estimates market size by summating companies’ revenue generated by selling solutions and services.
Market Size Estimation Methodology: Top-down approach
In the top-down approach, an exhaustive list of all the vendors offering solutions and services in the AI as a Service market was prepared. The revenue contribution of the market vendors was estimated through annual reports, press releases, funding, investor presentations, paid databases, and primary interviews. Each vendor’s offerings were evaluated based on the breadth of solutions according to product type, business functions, organization size, service type, and end user. The aggregate of all the companies’ revenue was extrapolated to reach the overall market size. Each subsegment was studied and analyzed for its global market size and regional penetration. The markets were triangulated through primary and secondary research. The primary procedure included extensive interviews for key insights from industry leaders, such as CIOs, CEOs, VPs, directors, and marketing executives. The market numbers were further triangulated with the existing MarketsandMarkets’ repository for validation.
Market Size Estimation Methodology-Bottom-up approach
The bottom-up approach identified the adoption rate of AI as a Service solutions and services among different end users in key countries, concerning their regions contributing the most to the market share. For cross-validation, the adoption of AI as a Service solution among industries, along with different use cases concerning their regions, was identified and extrapolated. Weightage was given to use cases identified in different regions for the market size calculation.
Based on the market numbers, the regional split was determined by primary and secondary sources. The procedure included the analysis of the AI as a Service market’s regional penetration. Based on secondary research, the regional spending on Information and Communications Technology (ICT), socio-economic analysis of each country, strategic vendor analysis of major AI as a Service providers, and organic and inorganic business development activities of regional and global players were estimated. With the data triangulation procedure and data validation through primary interviews, the exact values of the overall AI as a Service market size and the segments’ size were determined and confirmed using the study.
AI as a Service Market : Top-Down and Bottom-Up Approach

Data Triangulation
After determining the overall market size using the market size estimation processes as explained above, the market was split into several segments and subsegments. To complete the overall market engineering process and arrive at the exact statistics of each market segment and subsegment, data triangulation and market breakup procedures were employed, wherever applicable. The overall market size was then used in the top-down procedure to estimate the size of other individual markets via percentage splits of the market segmentation.
Market Definition
AI as a Service (AIaaS) is a cloud-based solution offered by third-party providers, enabling businesses and individual users to integrate AI-powered capabilities, such as machine learning, natural language processing, and computer vision, into their systems without significant upfront investments in infrastructure or expertise. These AI tools, hosted in the cloud and accessible over the internet, allow for on-demand scalability and flexibility, making AI more accessible to many users. AIaaS provides a low-risk, cost-effective approach for enterprises to automate processes, enhance decision-making, and drive operational efficiency while catering to individual users for personal or smaller-scale AI applications.
Stakeholders
- AI as a Service software providers
- Cybersecurity firms
- Business analysts
- Cloud service providers
- Consulting service providers
- Enterprise end users
- Distributors and value-added resellers (VARs)
- Government agencies
- Independent software vendors (ISV)
- Managed service providers
- Market research and consulting firms
- Support & maintenance service providers
- System integrators (SIs)/migration service providers
- Technology providers
Report Objectives
- To define, describe, and forecast the AI as a Service market, by product type, organization size, business function, service type, and end user
- To provide detailed information related to major factors (drivers, restraints, opportunities, and industry-specific challenges) influencing the market growth
- To analyze the micro markets with respect to individual growth trends, prospects, and their contribution to the total market
- To analyze the opportunities in the market for stakeholders by identifying the high-growth segments of the AI as a Service market
- To analyze opportunities in the market and provide details of the competitive landscape for stakeholders and market leaders
- To forecast the market size of segments for five main regions: North America, Europe, Asia Pacific, the Middle East & Africa, and Latin America
- To profile the key players and comprehensively analyze their market ranking and core competencies
- To analyze competitive developments, such as partnerships, product launches, and mergers and acquisitions, in the AI as a Service market
Available Customizations
With the given market data, MarketsandMarkets offers customizations per your company’s specific needs. The following customization options are available for the report:
Product Analysis
- The product quadrant gives a detailed comparison of each company’s product portfolio.
Geographic Analysis as per Feasibility
- Further breakup of the North American AI as a Service market
- Further breakup of the European market
- Further breakup of the Asia Pacific market
- Further breakup of the Middle Eastern & African market
- Further breakup of the Latin American AI as a Service market
Company Information
- Detailed analysis and profiling of additional market players (up to five)
Key Questions Addressed by the Report
Need a Tailored Report?
Customize this report to your needs
Get 10% FREE Customization
Customize This ReportPersonalize This Research
- Triangulate with your Own Data
- Get Data as per your Format and Definition
- Gain a Deeper Dive on a Specific Application, Geography, Customer or Competitor
- Any level of Personalization
Let Us Help You
- What are the Known and Unknown Adjacencies Impacting the AI as a Service Market
- What will your New Revenue Sources be?
- Who will be your Top Customer; what will make them switch?
- Defend your Market Share or Win Competitors
- Get a Scorecard for Target Partners

Custom Market Research Services
We Will Customise The Research For You, In Case The Report Listed Above Does Not Meet With Your Requirements
Get 10% Free CustomisationTESTIMONIALS


Growth opportunities and latent adjacency in AI as a Service Market