Bioactive Ingredients & Product Market by Ingredient (Probiotics, Proteins, Plant Extracts, Minerals, Vitamins, Fibers, Carotenoids), by Product (Functional Foods, & Beverage, Dietary Supplements, Animal Nutrition, Personal Care) - Global Trends & Forecast to 2018


The bioactive ingredients market is emerging with increased awareness and growing health concerns. People are turning towards healthy food that fulfills the requirement of essential nutrients in the body. With increasing education, people are gaining awareness regarding the types of food & beverages that help in maintaining a balanced diet and proper health. Manufacturers are also taking into consideration the convenience factor for consumers and providing them with healthy nutrients in the form of food & beverages instead of supplements. Cosmeceuticals is a growing concept which combines bioactive with personal care. For instance, various mineral-enriched or vitamin-enriched herbal creams, shampoos, etc., are entering the market with guarantees of better skincare, hair care, etc.
Animal nutrition is developing with the growing meat and milk market. Animal feed manufacturers tend to attain more output from animals when nutritious ingredients are used in animal feed. This report covers the five major applications of bioactive ingredients mentioned above: functional food, functional beverages, dietary supplements, animal nutrition, and personal care.
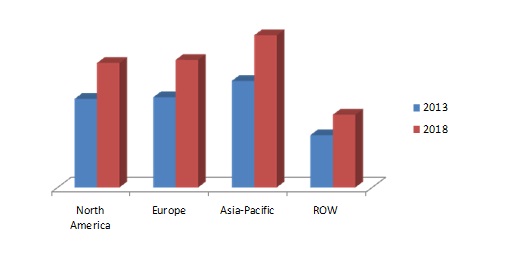
The global bioactive ingredients market is projected to reach $33.6 billion by the year 2018. The different types of bioactive ingredients covered in this study are prebiotics, probiotics, amino acids, peptides & proteins, phytochemicals & plant extracts, Omega 3 & structured lipids, fibers & specialty carbohydrates, vitamins, proteins, carotenoids & antioxidants, and others. The major regions that are considered for the study are North America, Europe, Asia-Pacific and Rest of the World. Asia-Pacific forms the dominant market with the highest share and CAGR. The overall bioactive ingredients market is expected to experience a growth rate of 7.2% from 2013 to 2018, whereas the Asia-Pacific region is expected to grow at a rate of 7.4% for the same period.
Bioactive Ingredients Market: Market Size, By Type, 2013 Vs 2018 ($Billion)
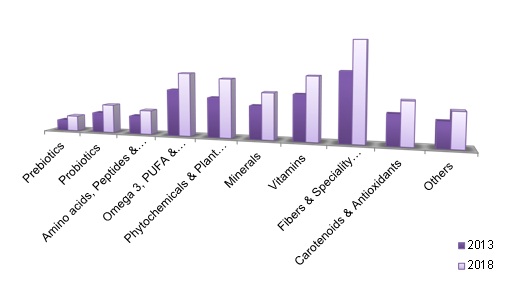
Source: Industry Journals, Company Presentations, and MarketsandMarkets Analysis
This report classifies and defines the bioactive ingredients market value in the overall bioactive industry. It also includes qualitative and technical data pertaining to bioactive ingredients such as sub-types, source, application, etc. The report also provides a comprehensive review of market drivers, restraints, opportunities, and key issues in the bioactive ingredients industry. The major players in the bioactive ingredients market have also been identified and profiled.
The major players include DuPont (U.S.A), Royal DSM (Netherlands), Cargill (U.S.A), ADM (U.S.), and BASF (Germany).
Scope of the report
The global bioactive ingredients market has been analyzed in terms of value on the basis of the classifications mentioned below.
Bioactive Ingredients Market By Application
- Functional food
- Functional beverages
- Dietary supplements
- Animal nutrition
- Personal care
Bioactive Ingredients Market By Type
- Prebiotics
- Probiotics
- Amino acids, peptides & proteins
- Omega 3 & structured lipids
- Phytochemicals & plant extracts
- Minerals
- Vitamins
- Fibers & specialty carbohydrates
- Carotenoids & antioxidants
- Others
Bioactive Ingredients Market By Geography
- North America
- Europe
- Asia-Pacific
- ROW
The aging population and an increasing number of chronic diseases generate health concerns in the consumers’ minds, which are major factors that push the bioactive ingredients market. Consumers are shifting their eating habits from hunger-satisfaction to the intake of healthy food in order to either fulfill the nutrient deficiency in the body or to prevent the deficiency of major nutrients.
The concept of bioactive is modern and still seeks opportunities in several parts of the world. However, the growth prospects of this industry are extremely high in the future due to the involvement of various herbal ingredients that tend to gain the consumers’ trust in developing nations. The role of bioactive ingredients is incredibly significant in the overall industry, as the quality of ingredients used in a product directly affects the market for that product. Although both the industries are interdependent on each other, the impact of the ingredient industry is higher on the product industry.
The major applications for bioactive ingredients include functional foods, functional beverages, dietary supplements, animal nutrition, and personal care. According to this analysis and study by MarketsandMarkets, the five categories mentioned above are the most widespread applications of bioactive ingredients. The overall industry of food and beverages has not been taken into consideration as functional food and beverages in their basic functions are different from regular food and beverages. Dietary supplements are taken as a part of pharmaceuticals as the products are served in the forms of capsules, tablets, powders, and liquids that supplement certain nutrients that the diet of a person is deficient in. Animal nutrition is gaining significance with increasing concentration on the diet served to animals with the growing meat and meat products industry. Another reason is the growth of the milk industry that pushes the manufacturers to provide animals with quality food. Personal care is an emerging application in the bioactive ingredients industry. It is technically termed as cosmeceuticals, which involves healthy and nutritious ingredients to treat skin, hair, etc.
On the basis of geography, the bioactive ingredients market is segmented into North America, Europe, Asia-Pacific and ROW. Asia-Pacific has proven to be the dominant market with largest market share and highest growth rate for the next five years.
 Exclusive indicates content/data unique to MarketsandMarkets and not available with any competitors.
Table Of Contents
1 Introduction (Page No. - 25)
1.1 Key Objectives
1.2 Report Description
1.3 Markets Covered
1.4 Stakeholders
1.5 Research Methodology
1.5.1 Market Size Estimation
1.5.2 Key Data Points Taken From Secondary Sources
1.5.3 Key Data Points Taken From Primary Sources
1.5.4 Assumptions Made For This Report
2 Executive Summary (Page No. - 36)
3 Bioactive Ingredients- Definitions & Benefits (Page No. - 39)
3.1 Definition of Bioactive
3.1.1 Global Bioactive Industry-Facts & Figures
3.1.1.1 The Global Bioactive Industry Was Estimated to Be More Than $170 Billion in 2013
3.1.1.2 More Than 70.0% of American Consumers Prefer A Nutritional Diet
3.1.1.3 Bioactive Products Are Served in Three Forms- Food, Beverages, & Supplements
3.2 Bioactive Ingredients
3.2.1 Benefits
4 Premium Insights (Page No. - 44)
4.1 Report Segmentation
4.2 Global Bioactive Ingredients Market, By Type
4.3 Global Bioactive Ingredients Market, By Application
4.4 Key Ingredient Markets, By Geography & Application
4.4.1 Prebiotics
4.4.2 Probiotics
4.4.3 Amino Acids, Peptides, & Proteins
4.4.4 Omega 3 & Structured Lipids
4.4.5 Phytochemicals & Plant Extracts
4.4.6 Minerals
4.4.7 Vitamins
4.4.8 Fibers & Speciality Carbohydrates
4.4.9 Carotenoids & Antioxidants
4.4.10 Others
4.5 Key Market Players
5 Total Addressable Market (Page No. - 60)
5.1 Introduction
5.1.1 Functional Food
5.1.2 Functional Beverages
5.1.3 Dietary Supplements
5.1.4 Animal Nutrition
5.1.5 Personal Care
6 Market Overview (Page No. - 65)
6.1 Introduction
6.2 Bioactive Ingredients
6.2.1 Key Features
6.2.1.1 Using Food For Treatment
6.2.1.2 Bioactive: Prevention Is Always Better Than Cure
6.2.1.3 Widening Applications of Bioactive Ingredients
6.2.1.4 Clinically-Proven Products
6.2.2 Global Bioactive Ingredient Market
6.2.2.1 Asia-Pacific Dominates The Global Bioactive Ingredient Market
6.2.3 Types of Bioactive Ingredients
6.2.3.1 Prebiotics
6.2.3.2 Probiotics
6.2.3.3 Amino Acid, Peptides & Proteins
6.2.3.4 Omega 3 and Structured Lipids
6.2.3.5 Phytochemicals & Plant Extracts
6.2.3.6 Minerals
6.2.3.7 Vitamins
6.2.3.8 Fibers and Specialty Carbohydrates
6.2.3.9 Carotenoids & Antioxidants
6.2.3.10 Others
6.2.3.10.1 Phytochemicals- Anticipated to Experience Tremendous Growth
6.2.4 Applications of Bioactive Ingredients
6.2.4.1 Functional Food
6.2.4.2 Functional Beverages
6.2.4.3 Dietary Supplements
6.2.4.4 Animal Nutrition
6.2.4.5 Personal Care
6.2.4.5.1 Functional Beverages Attract The Health Conscious Population
7 Industry Analysis (Page No. - 78)
7.1 Core Industry Analysis
7.2 Bioactive Industry
7.3 Market Share Analysis
7.3.1 Dupont: Dominant Player in The Bioactive Ingredient Industry
7.3.2 E. I. DU Pont DE Nemours and Company: SWOT Analysis
7.3.2.1 Strengths
7.3.2.1.1 Leadership Position in Diverse Markets Enables Consistent Growth
7.3.2.2 Weakness
7.3.2.2.1 Liabilities Under Cerla & Rcra Affect The Operating Results.
7.3.2.3 Opportunities
7.3.2.3.1 Emerging Markets in Asia-Pacific & Latin-American Regions
7.3.2.4 Threats
7.3.2.4.1 Volatility in Energy & Raw Material Prices Could inflate The Operating Costs
7.3.2.4.2 Changes in Government Policies & Laws Could Have A Negative Impact on The Company’s Financial Results
7.3.3 Royal DSM: SWOT Analysis
7.3.3.1 Strengths
7.3.3.1.1 Wide Product Portfolio
7.3.3.1.2 Inorganic Growth Strengthens The Health & Nutrition Business
7.3.3.2 Weaknesses
7.3.3.2.1 High Level of Dependence on Developed Markets
7.3.3.3 Opportunities
7.3.3.3.1 Acquisitions Are Likely to Strengthen DSM’s Nutritional Products Business
7.3.3.4 Threats
7.3.3.4.1 Competition Could Affect DSM’s Margins
7.3.3.4.2 Reach Regulations Could Exert Pressure on The Company’s Profitability
7.3.4 Cargill Inc.: SWOT Analysis
7.3.4.1 Strengths
7.3.4.1.1 Leading Private Player Aided With A Diversified Product Portfolio
7.3.4.1.2 offers Customized Solution & Products Through Strong Focus on R&D
7.3.4.2 Weaknesses
7.3.4.2.1 Increasing Instances of Product Recalls
7.3.4.3 Opportunities
7.3.4.3.1 Expansion & Enhancement of Manufacturing Capabilities.
7.3.4.4 Threats
7.3.4.4.1 Intense Competition
7.3.4.4.2 Gmo Regulations
7.3.5 Archer Daniels Midland Co.(ADM): SWOT Analysis
7.3.5.1 Strengths
7.3.5.1.1 Strong Logistics Network in A Transport-Dependent Sector
7.3.5.1.2 Relationship Building Measures With Suppliers
7.3.5.2 Weakness
7.3.5.2.1 Dependence on The American & German Market.
7.3.5.3 Opportunities
7.3.5.3.1 Strategic Acquisitions.
7.3.5.3.2 Capacity Enhancement Initiatives
7.3.5.3.3 Increasing Market Presence
7.3.5.4 Threats
7.3.5.4.1 Intense Competition
7.3.5.4.2 Resistance Towards Genetically Modified Organisms(Gmos)
7.3.6 BASF: SWOT Analysis
7.3.6.1 Strength
7.3.6.1.1 Verbund Concept Linked to The Optimal Level, Provides BASF With Cost Advantages and Energy Savings
7.3.6.1.2 Diversified Product Profile
7.3.6.2 Weakness
7.3.6.2.1 Litigations May Affect Their Brand Image
7.3.6.3 Opportunities
7.3.6.3.1 Growing Demand For Omega-3 Fatty Acids
7.3.6.3.2 Expansion of Operations in Asia-Pacific
7.3.6.4 Threats
7.3.6.4.1 Stringent Government Rules & Regulations
7.3.6.4.2 Risk Variables to Rise As Their Business Expands Globally
8 Bioactive Ingredients – Market Analysis (Page No. - 95)
8.1 Introduction
8.2 Winning Imperatives
8.2.1 Research & Development
8.2.2 Consumer Education
8.2.3 Forward Integration, By Company
8.3 Burning Issue
8.3.1 Regulatory Aspects
8.4 Market Dynamics
8.4.1 Impact Analysis
8.4.2 Drivers
8.4.2.1 Increasing Consumer Awareness
8.4.2.2 Increasing Health Concerns
8.4.2.3 Increase in Per Capita Income of Consumers in Developing Countries
8.4.3 Restraints
8.4.3.1 Lack of Licensing & Patent Protection Guidelines
8.4.3.2 Intra-Government Norms
8.4.4 Opportunities
8.4.4.1 New Target Market: Asia-Pacific & ROW
8.4.4.2 Wider Scope of Applications
8.5 Porter’s Five Forces Analysis
8.5.1 Degree of Competition
8.5.2 Bargaining Power of Suppliers
8.5.3 Bargaining Power of Buyers
8.5.4 Threat of Substitutes
8.5.5 Threat From New Entrants
8.6 Supply Chain Analysis
9 Prebiotics (Page No. - 109)
9.1 Introduction
9.2 Key Features
9.2.1 Market Growth Opportunity
9.2.2 Functional Foods & Beverages
9.2.3 Increased Health Concerns
9.3 Prebiotics Market, By Type
9.4 Prebiotics Market, By Application
9.4.1 Growth in The Functional Food Driving Prebiotic Market
9.5 Prebiotics Market, By Geography
9.5.1 North America: A Quietly-Emerging Prebiotic Market
9.5.2 Europe: Promising Growth Opportunities
9.5.3 Asia Pacific: Rapid Expansion Opportunities
9.5.4 Rest of The World: New Opportunities
10 Probiotics (Page No. - 124)
10.1 Introduction
10.2 Key Features
10.2.1 An Option For Consumers Who Suffer From Lactose Intolerance
10.2.2 The Increasing Demand For Functional Food
10.2.3 Apac Holds The Largest Market Share
10.3 Probiotics Market, By Type
10.4 Probiotics Market, By Application
10.5 Probiotics Market, By Geography
10.5.1 North America: Slow & Steady Growth
10.5.1.1 Europe: High Revenue Market
10.5.1.2 Asia-Pacific: Huge Consumer Base
10.6 Rest of The World: New Potential Market
11 Global Amino Acids, Peptides, & Proteins Market (Page No. - 139)
11.1 Introduction
11.1.1 Key Features
11.1.1.1 Increase in Demand From Consumers
11.1.1.2 Vegetarian Sources-Promising Agents For The Future
11.2 Amino Acids, Peptides, & Protein Ingredients Market, By Application
11.3 Amino Acids, Peptides, & Protein Ingredients Market, By Geography
11.3.1 North America: Major Innovations Center
11.3.2 Europe: The Market Is Fortified With An Ever Increasing Consumer Demand
11.3.3 Asia-Pacific: Demand For Ingredients Derived From Vegetarian Sources
11.3.4 Rest of The World: Emerging Market
12 Global Omega-3 & Structured Lipids Market (Page No. - 154)
12.1 Introduction
12.1.1 Key Features
12.1.1.1 Increase in Demand From The Food Sector
12.1.1.2 Innovations
12.1.1.3 Industry Landscape
12.1.1.4 Changing Lifestyles & Hectic Work Culture Pushes The Market
12.2 Omega 3 and Structured Lipids Ingredients Market, By Type
12.3 Omega-3 and Structured Lipids Ingredients Market, By Application
12.4 Omega-3 and Structured Lipids Ingredients Market, By Geography
12.4.1 North America: Health Concerns Drive Demand
12.4.2 Europe: West Meets East
12.4.3 Asia-Pacific: Bigger Market, Smaller Risk
12.4.4 Rest of The World: Scope For Exploring New Opportunities
13 Global Phytochemical & Plant Extracts Market (Page No. - 168)
13.1 Introduction
13.1.1 Key Features
13.1.1.1 Consumer Interest in The Global Market
13.1.1.2 Innovation in Applications
13.2 Phytochemicals & Plant Extracts Market, By Type
13.2.1 Phytosterols-New Hope For The Industry
13.3 Phytochemicals & Plant Extracts Market, By Application
13.4 Phytochemicals & Plant Extracts Market, By Geography
13.4.1 North America: Colossal Market
13.4.2 Europe: Stringent Norms Against Chemical Ingredients Drives The Growth For Plant Extracts & Phytochemical Ingredients
13.4.3 Asia-Pacific: New Desitnation For Innovations
13.4.4 Rest of The World: High Returns on Investments
14 Minerals (Page No. - 184)
14.1 Introduction
14.1.1 Key Features
14.1.1.1 Expansion in New Markets
14.1.1.2 Rated Price & Dosage
14.1.1.3 New Scope of Applications
14.2 Mineral Market, By Type
14.2.1 Chromiuim- A Growing Market With Widening Applications
14.3 Mineral Market, By Application
14.4 Minerals Market, By Geography
14.4.1 North America: Consistent & Stable Market For Minerals
14.4.1.1 Minerals Tap The Market For Functional Beverages
14.4.2 Europe: Impressive Market Revenues
14.4.3 Asia-Pacific: Secure Investment Opportunities
14.4.4 Rest of The World: Scope For Diversification
15 Vitamins (Page No. - 199)
15.1 Introduction
15.1.1 Key Features
15.1.1.1 Asia-Pacific-The Largest Growing Market
15.1.1.2 Vitamin E Represents The Largest Segment
15.2 Vitamins Market, By Type
15.2.1 Vitamin K- The Next Big Fixation in The Nutraceutical Market
15.3 Vitamin Market, By Application
15.3.1 Innovations in The Cosmetics & Dietary Supplements Industry Expands The Applications of Vitamins
15.4 Vitamin Market, By Geography
15.4.1 North America: Lucrative Revenue Market
15.4.2 Europe: High Importance For Consumer Preferences
15.4.3 Asia-Pacific: Attractive Opportunities
15.4.4 Rest of The World: Attractive Market Potential
16 Global Fibers & Specialty Carbohydrates Market (Page No. - 214)
16.1 Introduction
16.1.1 Key Features
16.1.1.1 High Market Share
16.1.1.2 High Market Potential in Emerging Economies
16.2 Fiber & Specialty Carbohydrates Market, By Types
16.3 Fiber & Specialty Carbohydrates Market, By Applications
16.4 Fiber & Specialty Carbohydrates Market, By Geography
16.4.1 North America: The Biggest Contributor to Revenue For The Fibers & Specialty Carbohydrates Market
16.4.1.1 Dietary Supplements Drive The North American Market to New Heights
16.4.2 Europe: Awareness in The West European Regions
16.4.3 Asia-Pacific: Affordable Resources
16.4.4 Rest of The World: New Business Frontier
17 Global Carotenoids & Antioxidants Market (Page No. - 229)
17.1 Introduction
17.1.1 Key Features
17.1.1.1 Anti-Aging, Anti-Cancer, and Health Benefits Drive The Demand For Carotenoids
17.1.1.2 Huge Market Potential
17.2 Carotenoids Ingredient Market, By Types
17.2.1 Key Feature
17.2.1.1 Acai and Pterostilbene–The Future of Carotenoids
17.3 Carotenoids & Antioxidants Ingredient Market, By Applications
17.4 Carotenoids & Antioxidants Ingredient Market, By Geography
17.4.1 North America-Eternal Market
17.4.2 Europe-A Blooming Market
17.4.3 Asia-Pacific-Consumer Boom
17.4.4 ROW-A Market in The Growth Stage
18 Other Nutraceutical Ingredients (Page No. - 245)
18.1 Introduction
18.2 Other Ingredient Market, By Types
18.3 Other Ingredient Market, By Applications
18.4 Other Nutraceutical Ingredient Market, By Geography
18.4.1 North America-No Compromise on Health & Wellness Products
18.4.2 Europe-New Era For Preventative Medication
18.4.3 Asia-Pacific-The Market Is Electic
18.4.4 ROW-No Longer A Minnow
19 Competitive Landscape (Page No. - 260)
19.1 Introduction
19.2 Expansion: Most Preferred Strategic Approach
19.2.1 Maximum Developments in 2013
19.2.2 Cargill Inc. (U.S.) & ADM (U.S.): Most Active Companies
19.3 Mergers & Acquistions
19.4 Expansions & Other Developments
19.5 Agreements, Collaborations, & Joint Ventures
19.6 New Products Launch & Product Developments
20 Company Profiles (Company At A Glance, Recent Financials, Products & Services, Strategies & Insights, & Recent Developments)* (Page No. - 280)
20.1 BASF
20.2 Archer Daniels Midland Co. (ADM)
20.3 Cargill Inc.
20.4 Dupont DENemours & Co. (Dupont) Msds.
20.5 DSM
20.6 Ajinomoto Co. Inc.
20.7 Ingredion Inc.
20.8 FMC Corporation.
20.9 Roquette.
20.10 Arla Foods
*Details on Company At A Glance, Recent Financials, Products & Services, Strategies & Insights, & Recent Developments Might Not Be Captured in Case of Unlisted Companies.
List of Tables (131 Tables)
Table 1 Health Benefits of Bioactive Ingredients
Table 2 Addressable Market & Bioactive Ingredients Market Size ($Billion)
Table 3 Bioactive Ingredients Market, By Geography, 2013-2018($Million)
Table 4 Bioactive Ingredients Market, By Type, 2011–2018 ($Million)
Table 5 Bioactive Ingredients Market, By Application, 2011–2018 ($Million)
Table 6 Prebiotics: Market Size, By Type, 2011–2018 ($Million)
Table 7 Prebiotics: Market Size, By Application, 2011-2018 ($Million)
Table 8 Prebiotics Market Size, By Geography, 2011-2018 ($Million)
Table 9 North America: Prebiotics Market Size, By Country, 2011-2018 ($Million)
Table 10 North America: Prebiotics Market Size, By Application, 2011-2018 ($Million)
Table 11 Europe: Prebiotics Market Size, By Country, 2011-2018 ($Million)
Table 12 Europe: Prebiotics Market Size, By Application, 2011-2018 ($Million)
Table 13 Asia-Pacific: Prebiotics Market Size, By Country, 2011-2018 ($Million)
Table 14 ROW: Prebiotics Market Size, By Country, 2011-2018 ($Million)
Table 15 ROW: Prebiotics Market Size, By Application, 2011-2018 ($Million)
Table 16 Probiotic: Market Size, By Type, 2011-2018 ($Million)
Table 17 Probiotic Market Size, By Application, 2011-2018 ($Million)
Table 18 Probiotics Market Size, By Geography, 2011-2018 ($Million)
Table 19 North America Probiotic Market Size, By Country, 2011-2018 ($Million)
Table 20 North America: Probiotic Market Size, By Application, 2011-2018 ($Million)
Table 21 Europe: Probiotic Market Size, By Country, 2011-2018 ($Million)
Table 22 Europe: Probiotic Market Size, By Application, 2011-2018 ($Million)
Table 23 Asia-Pacific: Probiotic Market Size, By Country, 2011-2018 ($Million)
Table 24 Asia Pacific: Probiotic Market Size, By Application, 2011-2018 ($Million)
Table 25 ROW: Probiotic Market Size, By Country, 2011-2018 ($Million)
Table 26 ROW: Probiotic Market Size, By Application, 2011-2018 ($Million)
Table 27 Name of Standard Amino Acids Composed to Form Proteins
Table 28 Amino Acids, Peptides, & Protein Ingredients Market, By Application, 2011–2018 ($Million)
Table 29 Amino Acids, Peptides, & Protein Ingredients Market, By Geography, 2011–2018 ($Million)
Table 30 North America: Amino Acids, Peptides, & Protein Ingredients Market Size, By Country, 2011–2018 ($Million)
Table 31 North America: Amino Acids, Peptides, & Protein Ingredients Market Size, By Application, 2011–2018 ($Million)
Table 32 Europe: Amino Acids, Peptides, & Protein Ingredients Market Size, By Country, 2011–2018 ($Million)
Table 33 Europe: Amino Acids, Peptides, & Protein Ingredients Market Size, By Application, 2011–2018 ($Million)
Table 34 Asia-Pacific: Amino Acids, Peptides, & Protein Ingredients Market Size, By Country, 2011–2018 ($Million)
Table 35 Asia-Pacific: Amino Acids, Peptides, & Protein Ingredients Market Size, By Application, 2011–2018 ($Million)
Table 36 ROW: Amino Acids, Peptides, & Protein Ingredients Market Size, By Country, 2011–2018 ($Million)
Table 37 ROW: Amino Acids, Peptides, & Protein Ingredients Market Size, By Application, 2011–2018 ($Million)
Table 38 Omega-3 and Structured Lipids Ingredients Market Size, By Type, 2011–2018 ($Million)
Table 39 Omega-3 and Structured Lipids Ingredients Market Size, By Application, 2011–2018 ($Million)
Table 40 Omega-3 and Structured Lipids Ingredients Market Size,Market Size, By Region, 2011–2018 ($Million)
Table 41 North America: Omega-3, Pufa, & Specialty Lipids Ingredients Market Size, By Country, 2011–2018 ($Million)
Table 42 North America: Omega 3 and Structured Lipids Ingredients Market Size, By Application, 2011–2018 ($Million)
Table 43 Europe: Omega-3 and Structured Lipids Ingredients Market Size, By Country, 2011–2018 ($Million)
Table 44 Europe: Omega 3 and Structured Lipids Ingredients Market Size, By Application, 2011–2018 ($Million)
Table 45 Asia-Pacific: Omega-3 and Structured Lipids Ingredients Market Size, By Country, 2011–2018 ($Million)
Table 46 Asia-Pacific: Omega-3 and Structured Lipids Ingredients Market Size, By Application, 2011–2018 ($Million)
Table 47 ROW: Omega-3 and Structured Lipids Ingredients Market Size, By Country, 2011–2018 ($Million)
Table 48 ROW: Omega-3 and Structured Lipids Ingredients Market Size, By Application, 2011–2018 ($Million)
Table 49 Phytochemicals & Plant Extracts Ingredients Market Size, By Type, 2011–2018 ($Million)
Table 50 Phytochemicals & Plant Extracts Market Size, By Application, 2011–2018 ($Million)
Table 51 Phytochemicals & Plant Extracts Market Size, By Georgraphy, 2011–2018 ($Million)
Table 52 North America: Phytochemicals & Plant Extracts Market Size, By Country, 2011–2018 ($Million)
Table 53 North America: Phytochemicals & Plant Extracts Market Size, By Application, 2011–2018 ($Million)
Table 54 Europe: Plant Extract & Phytochemical Ingredients Market Size, By Country, 2011–2018 ($Million)
Table 55 Europe: Plant Extract & Phytochemical Ingredients Market Size, By Application, 2011–2018 ($Million)
Table 56 Asia-Pacific: Plant Extract & Phytochemical Ingredients Market Size, By Country, 2011–2018 ($Million)
Table 57 Asia-Pacific: Plant Extract & Phytochemical Ingredients Market Size, By Application, 2011–2018 ($Million)
Table 58 ROW: Plant Extract & Phytochemical Ingredients Market Size, By Country, 2011–2018 ($Million)
Table 59 ROW: Plant Extract & Phytochemical Ingredients Market Size, By Application, 2011–2018 ($Million)
Table 60 Minerals In Food
Table 61 Mineral Ingredients Market Size, By Type, 2011–2018 ($Million)
Table 62 Mineral Ingredients Market Size, By Application, 2011–2018 ($Million)
Table 63 Mineral Ingredients Market Size, By Georgraphy, 2011–2018 ($Million)
Table 64 North America: Mineral Ingredients Market Size, By Country, 2011–2018 ($Million)
Table 65 North America: Mineral Ingredients Market Size, By Application, 2011–2018 ($Million)
Table 66 Europe: Mineral Ingredients Market Size, By Country, 2011–2018 ($Million)
Table 67 Europe: Mineral Ingredients Market Size, By Application, 2011–2018 ($Million)
Table 68 Asia-Pacific: Mineral Ingredients Market Size, By Country, 2011–2018 ($Million)
Table 69 Asia-Pacific: Mineral Ingredients Market Size, By Application, 2011–2018 ($Million)
Table 70 ROW: Mineral Ingredients Market Size, By Country, 2011–2018 ($Million)
Table 71 ROW: Mineral Ingredients Market Size, By Application, 2011–2018 ($Million)
Table 72 Vitamins: Sources & Functions
Table 73 Vitamin Market Revenue, By Type, 2011-2018 ($Million)
Table 74 Vitamin Market Revenue, By Application, 2011-2018 ($Million)
Table 75 Vitamin Market Revenue, By Geography, 2011-2018 ($Million)
Table 76 North America: Vitamin Market Revenue, By Country, 2011-2018 ($Million)
Table 77 North America: Vitamin Market Revenue, By Application, 2011-2018 ($Million)
Table 78 Europe: Vitamin Market Revenue, By Country, 2011-2018 ($Million)
Table 79 Europe: Vitamin Market Revenue, By Application, 2011-2018 ($Million)
Table 80 Asia-Pacific: Vitamin Market Revenue, By Country, 2011-2018 ($Million)
Table 81 Asia-Pacific: Vitamin Market Revenue, By Application, 2011-2018 ($Million)
Table 82 ROW: Vitamin Market Revenue, By Country, 2011-2018 ($Million)
Table 83 ROW: Vitamin Market Revenue, By Application, 2011-2018 ($Million)
Table 84 Difference Between Soluble & Insoluble Fibers
Table 85 Fiber & Specialty Carbohydrates Market, By Types, 2011–2018 ($Million)
Table 86 Fiber & Specialty Carbohydrates Market, By Applications, 2011–2018 ($Million)
Table 87 Fiber & Specialty Carbohydrates Market, By Georgraphy, 2011–2018 ($Million)
Table 88 North America: Fibers & Specialty Carbohydrates Market, By Country, 2011–2018 ($Million)
Table 89 North America: Fibers & Specialty Carbohydrates Market, By Applications, 2011–2018 ($Million)
Table 90 Europe: Fibers & Specialty Carbohydrates Market, By Country, 2011–2018 ($Million)
Table 91 Europe: Fibers & Specialty Carbohydrates, By Applications, 2011–2018 ($Million)
Table 92 Asia-Pacific: Fibers & Specialty Carbohydrates Market, By Country, 2011–2018 ($Million)
Table 93 Asia-Pacific: Fibers & Specialty Carbohydrates Market, By Applications, 2011–2018 ($Million)
Table 94 ROW: Fibers & Specialty Carbohydrates Market, By Country, 2011–2018 ($Million)
Table 95 ROW: Fibers & Specialty Carbohydrates Market, By Applications, 2011–2018 ($Million)
Table 96 Carotenoids & Antioxidants Ingredient Market, By Types, 2011–2018 ($Million)
Table 97 Carotenoids & Antioxidants Ingredient Market, By Applications, 2011–2018 ($Million)
Table 98 Carotenoids & Antioxidants Ingredient Market, By Geography, 2011–2018 ($Million)
Table 99 North America: Carotenoids & Antioxidants Ingredient Market, By Country, 2011–2018 ($Million)
Table 100 North America: Carotenoids & Antioxidants Ingredient Market, By Application, 2011–2018 ($Million)
Table 101 Europe: Carotenoids & Antioxidants Ingredient Market, By Country, 2011–2018 ($Million)
Table 102 Europe: Carotenoids & Antioxidants Ingredient Market, By Applications, 2011–2018 ($Million)
Table 103 Asia-Pacific: Carotenoids & Antioxidants Ingredient Market, By Country, 2011–2018 ($Million)
Table 104 Asia-Pacific: Carotenoids & Antioxidants Ingredient Market, By Applications, 2011–2018 ($Million)
Table 105 ROW: Carotenoids & Antioxidants Ingredient Market, By Country, 2011–2018 ($Million)
Table 106 ROW: Carotenoids & Antioxidants Ingredient Market, By Applications, 2011–2018 ($Million)
Table 107 Others Ingredient Market, By Types, 2011–2018 ($Million)
Table 108 Others Ingredient Market, By Applications, 2011–2018 ($Million)
Table 109 Others Ingredient Market, By Regions, 2011–2018 ($Million)
Table 110 North America: Others Ingredients Market, By Country, 2011–2018 ($Million)
Table 111 North America: Others Ingredients Market, By Application, 2011–2018 ($Million)
Table 112 Europe: Others Ingredient Market, By Country, 2011–2018 ($Million)
Table 113 Europe: Others Ingredient Market, By Applications, 2011–2018 ($Million)
Table 114 Asia-Pacific: Others Ingredients Market, By Country, 2011–2018 ($Million)
Table 115 Asia-Pacific: Others Ingredients Market, By Applications, 2011–2018 ($Million)
Table 116 ROW: Others Ingredient Market, By Country, 2011–2018 ($Million)
Table 117 ROW: Others Ingredient Market, By Application, 2011–2018 ($Million)
Table 118 Mergers & Acquisitions, 2010–2013
Table 119 Investments & Expansions
Table 120 Agreements, Collaborations, & Joint Ventures
Table 121 New Products Launch & Product Developments
Table 122 BASF: Products & Their Description
Table 123 ADM: Products & Their Description
Table 124 Cargill: Products & Their Description
Table 125 Dupont: Products Segments, Products, & Their Description
Table 126 DSM: Product Segment, Product, & Their Description
Table 127 Ajinomoto: Products & Their Description
Table 128 Ingredion: Products & Their Description
Table 129 FMC: Products & Their Description
Table 130 Roquette: Products & Their Description
Table 131 Arla Food: Products & Their Description
List of Figures (35 Figures)
Figure 1 Bioactive Ingredients Market: Scope & Segmentation
Figure 2 Bioactive Ingredients Market: Research Methodology
Figure 3 Bioactive Ingredients Market, By Application, 2011–2018 ($Billion)
Figure 4 Bioactive Ingredients Market: Segmentation
Figure 5 Bioactive Ingredients Market Size, By Type, 2011–2018 ($Million) & Market Share (Value), By Type, 2013 Vs 2018
Figure 6 Bioactive Ingredients Market Size, By Application, 2011–2018 ($Million) & Market Share _ Value), By Application, 2013 Vs 2018
Figure 7 Prebiotics Market Size, By Geography & Application, 2011-2018 ($Million)
Figure 8 Probiotics Market Size, By Geography & Application, 2011-2018 ($Million)
Figure 9 Amino Acids, Peptides, & Protein Market Size, By Geography & Application, 2011-2018 ($Million)
Figure 10 Omega 3 & Structured Lipids Market Size, By Geography & Application, 2011-2018 ($Million)
Figure 11 Phytochemicals & Plant Extracts Market Size By Geography & By Application, 2011-2018 ($Million)
Figure 12 Minerals Market Size, By Geography & Application, 2011-2018 ($Million)
Figure 13 Vitamins Market Size, By Geography & Application, 2011-2018 ($Million)
Figure 14 Fibers & Speciality Carbohydrates Market Size, By Geography & Application, 2011-2018 ($Million)
Figure 15 Carotenoids & Antioxidants Market Size, By Geography & Application, 2011-2018 ($Million)
Figure 16 Others Market Size, By Geography & Application, 2011-2018 ($Million)
Figure 17 Bioactive Ingredients Market: Key Players
Figure 18 Bioactive Ingredients Market Share in End-Use Product Market, 2013 & 2018 ($Billion)
Figure 19 Bioactive Ingredients Market Segmentation
Figure 20 Bioactive Ingredients Market, By Geography, 2013
Figure 21 Factors That Affect The Bioactive Ingredients Industry
Figure 22 Global Bioactive Industry
Figure 23 Bioactive Ingredients: Market Share Analysis, By Company, 2012
Figure 24 E. I. DU Pont DE Nemours and Company : SWOT Analysis
Figure 25 Royal DSM : SWOT Analysis
Figure 26 Cargill Inc.: SWOT Analysis
Figure 27 ADM: SWOT Analysis
Figure 28 BASF: SWOT Analysis
Figure 29 Bioactive Ingredients: Market Drivers & Restraints
Figure 30 Porter’s Five Forces Analysis
Figure 31 Prebiotic: Process in The Human Body
Figure 32 Formation of Protein
Figure 33 Nutraceutical Ingredient: Market Share, By Growth Strategy, 2010–2013
Figure 34 Nutraceutical Market Developments, 2009–2013
Figure 35 Nutraceutical Ingredient Development Share, By Company, 2010-2013


Growth opportunities and latent adjacency in Bioactive Ingredients & Product Market