Bitterness Suppressors and Flavor Carriers Market by Form (Liquid, Solid), Category (Solvents, Fats, Starches, Sugars), Application (Food, Beverages, Pharmaceuticals), Flavor Type (Natural, Artificial), Availability, and Region - Global Forecast to 2023


[176 Pages Report] The study involved four major activities in estimating the current market size for bitterness suppressors and flavor carriers. Exhaustive secondary research was done to collect information on the market as well as on the peer market and markets. The next step was to validate these findings, assumptions, and sizing with industry experts across the value chain through primary research. Both the top-down and bottom-up approaches were employed to estimate the complete market size. Thereafter, market breakdown and data triangulation were used to estimate the market size of segments and subsegments.
Secondary Research
In the secondary research process, various secondary sources have been referred to, to identify and collect information for this study. The secondary sources included the annual reports, press releases, and investor presentations of companies; white papers; certified publications; articles by recognized authors and regulatory bodies; trade directories; and databases.
Secondary research has mainly been used to obtain key information about the industry�s value chain and supply chain, the total pool of key players, market classification & segmentation according to industry trends to the bottom-most level, and geographical markets. It has also been used to obtain information on the key developments from a market-oriented perspective.
Primary Research
The market includes several stakeholders in the supply chain suppliers, R&D institutes, and end-product manufacturers. The demand side of the market is characterized by the presence of importers/exporters; distributors; and manufacturers of food, beverage, and pharmaceutical products. The supply side is characterized by the presence of key providers of bitterness suppressors and flavor carriers. Various primary sources from the supply and demand sides of both markets have been interviewed to obtain qualitative and quantitative information.
To know about the assumptions considered for the study, download the pdf brochure
Market Size Estimation:
Both the top-down and bottom-up approaches have been used to estimate and validate the total size of the market. These approaches have also been used extensively to estimate the size of various dependent submarkets. The research methodology used to estimate the market size includes the following details:
- The key players in the industry and markets have been identified through extensive secondary research.
- The industry�s supply chain and market size, in terms of value, have been determined through primary and secondary research processes.
- All percentage shares, splits, and breakdowns have been determined using secondary sources and verified through primary sources.
- All the possible parameters that affect the markets covered in this research study have been accounted for, viewed in extensive detail, verified through primary research, and analyzed to obtain the final quantitative and qualitative data.
- The research included the study of reports, reviews, and newsletters of top market players, along with extensive interviews for opinions from leaders such as CEOs, directors, and marketing executives.
Data Triangulation:
After arriving at the overall market size from the estimation process explained above, the total market was split into several segments and subsegments. In order to complete the overall market engineering process and arrive at the exact statistics for all segments and subsegments, data triangulation & market breakdown procedures have been employed, wherever applicable. The data has been triangulated by studying various factors and trends from both the demand- and supply-sides. Along with this, the market size has been validated using both the top-down and bottom-up approaches.
Report Objectives:
Market Intelligence
- Determining and projecting the size of the bitterness suppressors and flavor carriers market, with respect to category, form, application, flavor type, and regional markets, over a five-year period, spanning from 2018 to 2023
- Identifying the attractive opportunities in the market by determining the largest and fastest-growing segments across the key regions
Competitive Intelligence
- Identifying and profiling the prominent market players in the bitterness suppressors and flavor carriers market
- Determining the share of key players operating in the bitterness suppressors and flavor carriers market
- Providing a comparative analysis of the market leaders, on the basis of the following:
- Product offerings
- Business strategies
- Strengths, weaknesses, opportunities, and threats
- Key financials
- Understanding the competitive landscape and identifying the key growth strategies adopted by the players across the key regions
- Analyzing the regulatory frameworks across regions and their impact on the prominent market players
- Providing insights on key innovations and investments in technology
Scope of the Report:
|
Report Metric |
Details |
|
Years considered for the study |
2016-2023 |
|
Base year considered |
2017 |
|
Forecast period |
2018-2023 |
|
Forecast period |
Value (USD) |
|
Segments covered |
For Flavor Carriers: Category, form, application, and flavor type |
|
Geographies covered |
For Flavor Carriers: North America, Europe, Asia Pacific, South America, and RoW |
|
Companies covered |
Firmenich, D�hler, Givaudan, DowDuPont, Cargill, International Flavors and Fragrances (IFF), Symrise, Kerry, Sensient Technologies, Senomyx, Stepan Company, and DuPont Tate & Lyle |
This research report categorizes the flavor carriers market based on category, form, availability, application, flavor type, and region; and the bitterness suppressors market based on category, form, and application.
By Category
- Bitterness suppressors
- Flavor Carriers
- Solvents
- Fats
- Starches
- Sugars
By Form
- Liquid
- Solid
By Application:
- Food
- Beverages
- Pharmaceuticals
By Flavor Type:
- Natural
- Artificial
By Geography
- North America
- Europe
- Asia Pacific (APAC)
- South America
- RoW (the Middle East & Africa)
Available Customizations:
Based on the given market data, MarketsandMarkets offers customizations in the reports as per the client�s specific requirements. The available customization options are as follows:
Product Analysis
- Product matrix, which gives a detailed comparison of the product portfolio of each company
Segmental Analysis
- Further breakdown of bitterness suppressors, by key country
- Further breakdown of bitterness suppressors and flavor carriers, by application
Geographic Analysis
- Further breakdown of the Rest of Asia Pacific bitterness suppressors and flavor carriers market, by country
- Further breakdown of Rest of the World bitterness suppressors and flavor carriers market, by key country
Company Information
- Detailed analysis and profiling of additional market players (Up to 5)
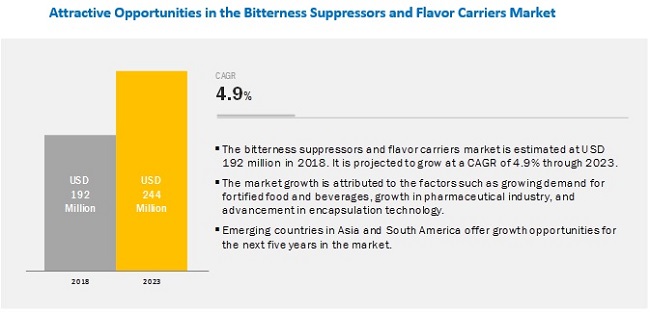
The overall bitterness suppressors and flavor carriers market is projected to grow from USD 192 million in 2018 to USD 244 million by 2023, at a CAGR of 4.9%. Growing consumer awareness and demand for functional food products is driving the overall bitterness suppressors market to mask the bitter taste of functional food ingredients such as nutraceuticals. Moreover, rapid R&D for using flavor carriers for encapsulation is driving the growth of the flavor carriers market.
By category, the flavor carriers segment is projected to be a larger contributor to the overall bitterness suppressors and flavor carriers market during the forecast period.
The bitterness suppressors and flavor carriers market has been segmented, on the basis of category, into bitterness suppressors and flavor carriers. The flavor carriers segment is projected to dominate the market during the forecast period, in terms of value; but the market for bitterness suppressors is projected to grow at a higher CAGR between 2018 and 2023. The shift in consumer preferences toward healthier food and beverages is driving the bitterness suppressors and flavor carriers market.
Rising global demand for healthier beverages and easy blending properties of liquid forms is setting the stage for the liquid form to dominate the global bitterness suppressors and flavor carriers market.
The bitterness suppressors and flavor carriers market is segmented, on the basis of form, into liquid and solid. The market for the liquid form of bitterness suppressors and flavor carriers is projected to grow at a higher CAGR between 2018 and 2023 than solid carriers. The increased production of healthier and functional beverages and the excellent blending properties of the liquid form of flavor carriers are positively impacting the overall growth of liquid flavor carriers.
Growing demand for alcoholic and non-alcoholic beverages, along with healthy dietary substitutes, positively impact the demand for bitterness suppressors and flavor carriers.
The bitterness suppressors and flavor carriers market is segmented, on the basis of application, into food, beverages, and pharmaceuticals. The market for beverages is projected to grow at the highest CAGR between 2018 and 2023. The growing demand for alcoholic and non-alcoholic beverages coupled with dietary requirements such as the requirement for low sugar is driving the overall beverages market. Due to the high potential growth of the beverage industry, the applications of bitterness suppressors and flavor carriers in the beverage industry is expected to grow fast.
By flavor type, the artificial segment is projected to be a larger contributor to the flavor carriers market during the forecast period.
The flavor carriers market has been segmented, on the basis of flavor type, into artificial and natural. The artificial segment is projected to dominate the market during the forecast period, in terms of value and growth, between 2018 and 2023. The market for artificial flavor carriers is much higher than the natural ones because they are readily and easily available and are much cheaper than the naturally derived ones.
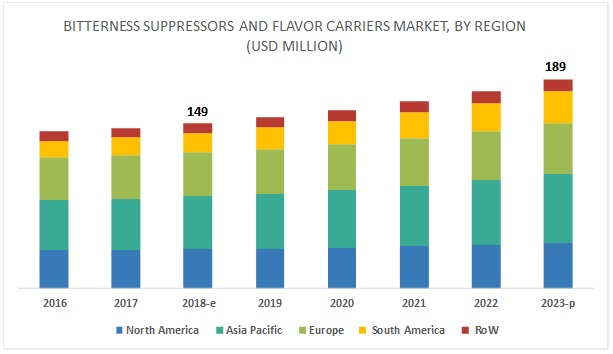
Asia Pacific is projected to account for the largest market size during the forecast period.
Asia Pacific is projected to dominate the global flavor carriers market during the forecast period. Increase in the production of processed and convenience foods and innovations in segments such as meat, dairy, and bakery & confectionery are driving the demand for flavor carriers in the Asia Pacific region. The processed food industry in the Asia Pacific region is experiencing growth, owing to the rapid urbanization and changes in the lifestyle of customers, in terms of disposable incomes and busy schedules that leave them with less time to prepare complete meals at home. Additionally, consumers have developed an inclination toward food products with better nutritional values in recent years; this is also driving the market in this region. These factors are expected to create a potential market for flavor carriers and bitterness suppressors in the food industry. The promising markets such as India and China, along with other Asian countries, hold great potential for bitterness suppressors and flavor carriers.
Key Market Players:
Key players in the market include Firmenich (Switzerland), D�hler (Germany), Givaudan (Switzerland), DowDuPont (US), Cargill (US), International Flavors and Fragrances (IFF) (US), Symrise (Germany), Kerry (Ireland), Sensient Technologies (US), Senomyx (US), Stepan Company (US), and DuPont Tate & Lyle (US). These players are increasingly undertaking new product launches, expansions and investments, acquisitions and partnerships, and mergers and collaborations to develop and introduce new technologies and products in the market and to expand their product portfolios in the untapped regions.
Recent Developments:
- In October 2018, DuPont Tate & Lyle (US) opened a new warehouse and distribution center at its manufacturing site in Loudon, US, to help itself serve local customers who require different packaging sizes of bio-based solutions; and to enable itself to serve the growing global demand for its Susterra and Zemea propanediol.
- In September 2018, Givaudan (Switzerland) acquired Naturex (France) with an aim to cater its customers across the food & beverage, nutrition and health, and personal care sectors, with natural, clean-label, and organic products.
Critical questions the report answers:
- Which are the key players in the market and how intense is the competition?
- What are the upcoming industry applications for bitterness suppressors and flavor carriers?
- What are the major types of flavor carriers?
- How is the demand for natural flavors affecting the flavor carriers market dynamics?
- Which are the key countries with high growth opportunities in the market?
To speak to our analyst for a discussion on the above findings, click Speak to Analyst
 Exclusive indicates content/data unique to MarketsandMarkets and not available with any competitors.
Table of Content
1 Introduction (Page No. - 18)
1.1 Objectives of the Study
1.2 Market Definition
1.3 Market Segmentation
1.3.1 Flavor Carriers Market, By Region
1.3.2 Periodization Considered
1.4 Currency
1.5 Unit Considered
1.6 Stakeholders
2 Research Methodology (Page No. - 24)
2.1 Research Data
2.1.1 Secondary Data
2.1.2 Primary Data
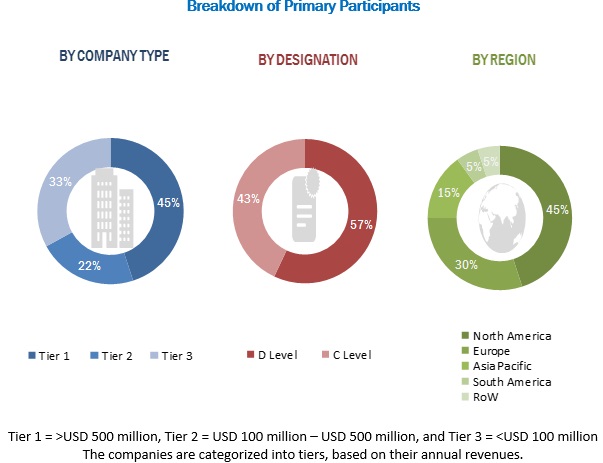
2.1.2.1 Breakdown of Primaries
2.2 Market Size Estimation
2.2.1 Bottom Up Approach
2.2.2 Top Down Approach
2.3 Data Triangulation
2.4 Research Assumptions
2.5 Research Limitations
3 Executive Summary (Page No. - 31)
4 Premium Insights (Page No. - 37)
4.1 Opportunities in the Bitterness Suppressors and Flavor Carriers Market
4.2 Flavor Carriers Market: Key Country
4.3 Flavor Carriers Market, By Application & Region
4.4 Flavor Carriers Market, By Form & Region
4.5 Developed vs Developing Markets for Flavor Carriers
4.6 North America: Flavor Carriers Market, By Flavor Type & Country, 2017
5 Market Overview (Page No. - 41)
5.1 Introduction
5.2 Market Dynamics
5.2.1 Drivers
5.2.1.1 Growing Functional Food Products Market is Fueling the Demand for Bitterness Suppressors to Mask the Bitter Taste of Nutraceuticals
5.2.1.1.1 Increased Consumer Demand for Reduced Calorie Products With Original Taste
5.2.1.2 Growth in the R&D for Enhanced Application of Encapsulation Technology
5.2.1.2.1 Need for Flavor Retention
5.2.1.3 Increasing Application in the Pharmaceutical Industry
5.2.1.3.1 Increase in Abbreviated New Drug Applications (ANDA)
5.2.1.3.2 Increase in Demand for Biopharmaceuticals
5.2.1.3.3 Growth in R&D for the Biopharmaceutical Industry to Launch Cost-Effective Products
5.2.2 Restraints
5.2.2.1 Use of Alternative Products and Technologies
5.2.2.1.1 Use of High-Intensity Sugar Sweeteners
5.2.2.1.2 Ion Exchange Salts to Mask Bitterness By Forming the Drug Resinate
5.2.2.2 Stringent Regulations and Government Policies
5.2.3 Opportunities
5.2.3.1 Launch of Advanced and Natural Flavor Carriers
5.2.3.1.1 Consumer Willingness to Pay More for Natural Products
5.2.3.2 Emerging Economies to Provide High-Growth Opportunities
5.2.3.2.1 High-Growth Opportunities in the Asia Pacific Region
5.2.3.2.2 Growing Market for Pharmaceuticals in Developing Economies Presents Growth Opportunities
5.2.4 Challenges
5.2.4.1 Demand for �Organic� Natural Flavors
5.2.4.2 Restrained Consumer Acceptance for Food Additives
6 Patent Analysis (Page No. - 53)
6.1 Introduction
7 Bitterness Suppressors and Flavor Carriers Market, By Category (Page No. - 59)
7.1 Introduction
7.2 Bitterness Suppressors
7.2.1 Shift Toward Neutraceutical Food and Beverages to Drive the Bitterness Suppressors Market
7.3 Flavor Carriers
7.3.1 Solvents
7.3.1.1 Propylene Glycol and Ethanol are the Most Used Flavor Carriers
7.3.2 Fats
7.3.2.1 Confectionery to Drive the Use of Fats as Flavor Carriers
7.3.3 Starches
7.3.3.1 Starches are Largely Used for the Encapsulation of Flavors
7.3.4 Sugars
7.3.4.1 Pharmaceutical is the Major Application Area of Sugars as Flavor Carriers
8 Bitterness Suppressors and Flavor Carriers Market, By Form (Page No. - 67)
8.1 Introduction
8.2 Liquid
8.2.1 Naturally-Derived Propanediol Gaining Momentum for Applications in the Food & Beverage Industry
8.3 Solid
8.3.1 Starches are the Most Widely Used Solid Flavor Carriers
9 Bitterness Suppressors and Flavor Carriers Market, By Application (Page No. - 72)
9.1 Introduction
9.2 Food
9.2.1 Rising Demand for Functional Food Products to Drive the Market of Bitterness Suppressors
9.3 Beverages
9.3.1 Rising Demand for Beverages to Drive the Flavor Carriers Market
9.4 Pharmaceuticals
9.4.1 Stringent Regulations Around Pediatric Medicines to Drive the Market for Bitterness Suppressors
10 Flavor Carriers Market, By Flavor Type (Page No. - 79)
10.1 Introduction
10.2 Natural
10.2.1 Growing Demand for Natural Food Products to Fuel Research Activities to Launch Natural Flavor Carriers
10.3 Artificial
10.3.1 Gras Certificate By Fda is Driving Flavor Carriers Market for Artificial Flavors
11 Bitterness Suppressors and Flavor Carriers Market, By Availability (Page No. - 84)
11.1 Introduction
11.2 Encapsulated
11.3 Non-Encapsulated
12 Bitterness Suppressors and Flavor Carriers Market, By Region (Page No. - 86)
12.1 Introduction
12.2 North America
12.2.1 US
12.2.1.1 Health Concerns Among Consumers to Boost the Demand for Bitterness Suppressors in Nutraceuticals
12.2.2 Canada
12.2.2.1 Substantial Growth in the Food & Beverage Sector in Canada Drives the Market Growth
12.2.3 Mexico
12.2.3.1 Busy Lifestyles and Growing Demand for Convenience Food to Fuel the Market Growth
12.3 Europe
12.3.1 Germany
12.3.1.1 Growth in the Healthcare Market to Drive the Demand for Bitterness Suppressors
12.3.2 UK
12.3.2.1 Growing Food & Beverage Industry is A Major Driver for Market Growth
12.3.3 France
12.3.3.1 Growing Alcoholic Beverage Industry Fuels the Market Growth in the Country
12.3.4 Italy
12.3.4.1 Italian Alcoholic Beverages Market to Drive the Bitterness Suppressors Market Growth
12.3.5 Rest of Europe
12.3.5.1 Changing Consumer Lifestyles and Increasing Incomes Tend to Drive the Growth of the Bitterness Suppressors and Flavor Carriers Market in the Rest of Europe
12.3.5.2 Huge Spanish Food & Beverage Market to Drive the Bitterness Suppressors and Flavor Carriers Market in Spain
12.3.5.3 Poland�s Pharmaceutical Market to Drive the Market for Bitterness Suppressors
12.4 Asia Pacific
12.4.1 China
12.4.1.1 China�s Large Population and Higher Number of Diseased Individuals Drive the Market for Bitterness Suppressors
12.4.2 Japan
12.4.2.1 Growth in Ageing Population Drives the Market for Bitterness Suppressors
12.4.3 India
12.4.3.1 Growing Preference for Convenience and Functional Food Drives the Market in the Country
12.4.4 Australia & New Zealand
12.4.4.1 Australia�s Pharmaceutical Industry Drives the Demand for Bitterness Suppressors
12.4.4.2 Higher Disposable Incomes Create an Indirect Demand for Bitterness Suppressors and Flavor Carriers in New Zealand
12.4.5 Rest of Asia Pacific
12.4.5.1 Companies� Expansions and Investments in the Asia Pacific Region Drive the Market Growth in the Region
12.5 South America
12.5.1 Brazil
12.5.1.1 Market Growth is Driven By the Growth in the Food Processing Sector
12.5.2 Argentina
12.5.2.1 Strategic Investments in the Region Fueling the Market Growth
12.5.3 Rest of South America
12.5.3.1 Growth in Imports and Exports of Processed Food Offers High Growth Opportunities
12.6 Rest of the World (RoW)
12.6.1 Africa
12.6.1.1 Rising Urbanization to Drive the Bitterness Suppressors and Flavor Carriers Market in Africa
12.6.2 Middle East
12.6.2.1 High Demand for Processed Food is Driving the Bitterness Suppressors and Flavor Carriers Market in the Middle East
13 Competitive Landscape (Page No. - 128)
13.1 Overview
13.2 Ranking of Key Players, 2017
13.3 Competitive Scenario
13.3.1 New Product Launches
13.3.2 Expansions and Investments
13.3.3 Acquisitions
13.3.4 Partnerships, Mergers, and Collaborations
14 Company Profiles (Page No. - 136)
(Business Overview, Products Offered, Recent Developments, SWOT Analysis, MnM View)*
14.1 Firmenich
14.2 D�hler
14.3 Givaudan
14.4 Dowdupont
14.5 Cargill
14.6 International Flavors and Fragrances (IFF)
14.7 Symrise
14.8 Kerry
14.9 Sensient Technologies
14.10 Senomyx
14.11 Stepan Company
14.12 Dupont Tate & Lyle
*Details on Business Overview, Products Offered, Recent Developments, SWOT Analysis, MnM View Might Not Be Captured in Case of Unlisted Companies.
15 Appendix (Page No. - 165)
15.1 Discussion Guide
15.2 More Company Developments
15.2.1 Expansions and Investments
15.2.2 Acquisitions
15.2.3 Partnerships, Mergers, and Collaborations
15.3 Knowledge Store: Marketsandmarkets� Subscription Portal
15.4 Available Customizations
15.5 Related Reports
15.6 Author Details
List of Tables (96 Tables)
Table 1 US Dollar Exchange Rates Considered for the Study, 2015�2017
Table 2 Adults Seeking Functional Food & Beverages for Health & Wellness Concerns, 2015 (%)
Table 3 Bitter Taste Masking of Drugs By Flavors and Sweeteners
Table 4 Relative Sweetness of Some Sweeteners
Table 5 Taste Masking By Ion Exchange Resins
Table 6 Patents Pertaining to Flavor Carriers and Bitterness Suppressors
Table 7 Bitterness Suppressors and Flavor Carriers Market Size, By Category, 2016�2023 (USD Million)
Table 8 Flavor Carriers Market Size, By Type, 2016�2023 (USD Million)
Table 9 Flavor Carriers Market Size for Solvents, By Region, 2016�2023 (USD Million)
Table 10 Flavor Carriers Market Size for Fats, By Region, 2016�2023 (USD Million)
Table 11 Flavor Carriers Market Size for Starches, By Region, 2016�2023 (USD Million)
Table 12 Flavor Carriers Market Size for Sugars, By Region, 2016�2023 (USD Million)
Table 13 Bitterness Suppressors and Flavor Carriers Market Size, By Form, 2016�2023 (USD Million)
Table 14 Bitterness Suppressors Market Size, By Form, 2016�2023 (USD Million)
Table 15 Flavor Carriers Market Size, By Form, 2016�2023 (USD Million)
Table 16 Liquid: Flavor Carriers Market Size, By Region, 2016�2023 (USD Million)
Table 17 Solid: Flavor Carriers Market Size, By Region, 2016�2023 (USD Million)
Table 18 Bitterness Suppressors and Flavor Carriers Market Size, By Application, 2016�2023 (USD Million)
Table 19 Bitterness Suppressors Market Size, By Application, 2016�2023 (USD Million)
Table 20 Flavor Carriers Market Size, By Application, 2016�2023 (USD Million)
Table 21 Flavor Carriers Market Size for Food, By Region, 2016�2023 (USD Million)
Table 22 Flavor Carriers Market Size for Beverages, By Region, 2016�2023 (USD Million)
Table 23 Flavor Carriers Market Size for Pharmaceuticals, By Region, 2016�2023 (USD Million)
Table 24 Flavor Carriers Market Size, By Flavor Type, 2016�2023 (USD Million)
Table 25 Flavor Carriers Market Size for Natural Flavors, By Region, 2016�2023 (USD Million)
Table 26 Flavor Carriers Market Size for Artificial Flavors, By Region, 2016�2023 (USD Million)
Table 27 Flavor Carriers Market Size, By Region, 2016�2023 (USD Million)
Table 28 Flavor Carriers Market Size, By Region, 2016�2023 (KT)
Table 29 North America: Flavor Carriers Market Size, By Country, 2016�2023 (USD Million)
Table 30 North America: Flavor Carriers Market Size, By Application, 2016�2023 (USD Million)
Table 31 North America: Flavor Carriers Market Size, By Flavor Type, 2016�2023 (USD Million)
Table 32 North America: Flavor Carriers Market Size, By Type, 2016�2023 (USD Million)
Table 33 North America: Flavor Carriers Market Size, By Form, 2016�2023 (USD Million)
Table 34 US: Flavor Carriers Market Size, By Application, 2016�2023 (USD Million)
Table 35 US: Flavor Carriers Market Size, By Flavor Type, 2016�2023 (USD Million)
Table 36 Canada: Flavor Carriers Market Size, By Application, 2016�2023 (USD Million)
Table 37 Canada: Flavor Carriers Market Size, By Flavor Type, 2016�2023 (USD Million)
Table 38 Mexico: Flavor Carriers Market Size, By Application, 2016�2023 (USD Million)
Table 39 Mexico: Flavor Carriers Market Size, By Flavor Type, 2016�2023 (USD Million)
Table 40 Europe: Flavor Carriers Market Size, By Country, 2016�2023 (USD Million)
Table 41 Europe: Flavor Carriers Market Size, By Application, 2016�2023 (USD Million)
Table 42 Europe: Flavor Carriers Market Size, By Flavor Type, 2016�2023 (USD Million)
Table 43 Europe: Flavor Carriers Market Size, By Type, 2016�2023 (USD Million)
Table 44 Europe: Flavor Carriers Market Size, By Form, 2016�2023 (USD Million)
Table 45 Germany: Flavor Carriers Market Size, By Application, 2016�2023 (USD Million)
Table 46 Germany: Flavor Carriers Market Size, By Flavor Type, 2016�2023 (USD Million)
Table 47 UK: Flavor Carriers Market Size, By Application, 2016�2023 (USD Million)
Table 48 UK: Flavor Carriers Market Size, By Flavor Type, 2016�2023 (USD Million)
Table 49 France: Flavor Carriers Market Size, By Application, 2016�2023 (USD Million)
Table 50 France: Flavor Carriers Market Size, By Flavor Type, 2016�2023 (USD Million)
Table 51 Italy: Flavor Carriers Market Size, By Application, 2016�2023 (USD Million)
Table 52 Italy: Flavor Carriers Market Size, By Flavor Type, 2016�2023 (USD Million)
Table 53 Rest of Europe: Flavor Carriers Market Size, By Application, 2016�2023 (USD Million)
Table 54 Rest of Europe: Flavor Carriers Market Size, By Flavor Type, 2016�2023 (USD Million)
Table 55 Asia Pacific: Flavor Carriers Market Size, By Country, 2016�2023 (USD Million)
Table 56 Asia Pacific: Flavor Carriers Market Size, By Application, 2016�2023 (USD Million)
Table 57 Asia Pacific: Flavor Carriers Market Size, By Flavor Type, 2016�2023 (USD Million)
Table 58 Asia Pacific: Flavor Carriers Market Size, By Type, 2016�2023 (USD Million)
Table 59 Asia Pacific: Flavor Carriers Market Size, By Form, 2016�2023 (USD Million)
Table 60 China: Flavor Carriers Market Size, By Application, 2016�2023 (USD Million)
Table 61 China: Flavor Carriers Market Size, By Flavor Type, 2016�2023 (USD Million)
Table 62 Japan: Flavor Carriers Market Size, By Application, 2016�2023 (USD Million)
Table 63 Japan: Flavor Carriers Market Size, By Flavor Type, 2016�2023 (USD Million)
Table 64 India: Flavor Carriers Market Size, By Application, 2016�2023 (USD Million)
Table 65 India: Flavor Carriers Market Size, By Flavor Type, 2016�2023 (USD Million)
Table 66 Australia & New Zealand: Flavor Carriers Market Size, By Application, 2016�2023 (USD Million)
Table 67 Australia & New Zealand: Flavor Carriers Market Size, By Flavor Type, 2016�2023 (USD Million)
Table 68 Rest of Asia Pacific: Flavor Carriers Market Size, By Application, 2016�2023 (USD Million)
Table 69 Rest of Asia Pacific: Flavor Carriers Market Size, By Flavor Type, 2016�2023 (USD Million)
Table 70 Flavor Carriers Market Size for South America, By Country, 2016�2023 (USD Million)
Table 71 Flavor Carriers Market Size for South America, By Application, 2016�2023 (USD Million)
Table 72 Flavor Carriers Market Size for South America, By Flavor Type, 2016�2023 (USD Million)
Table 73 Flavor Carriers Market Size for South America, By Type, 2016�2023 (USD Million)
Table 74 Flavor Carriers Market Size for South America, By Form, 2016�2023 (USD Million)
Table 75 Flavor Carriers Market Size for Brazil, By Application, 2016�2023 (USD Million)
Table 76 Flavor Carriers Market Size for Brazil, By Flavor Type, 2016�2023 (USD Million)
Table 77 Flavor Carriers Market Size for Argentina, By Application, 2016�2023 (USD Million)
Table 78 Flavor Carriers Market Size for Argentina, By Flavor Type, 2016�2023 (USD Million)
Table 79 Flavor Carriers Market Size for Rest of South America, By Application, 2016�2023 (USD Million)
Table 80 Flavor Carriers Market Size for Rest of South America, By Flavor Type, 2016�2023 (USD Million)
Table 81 Rest of the World (RoW): Flavor Carriers Market Size, By Region, 2016�2023 (USD Million)
Table 82 Rest of the World (RoW): Flavor Carriers Market Size, By Application, 2016�2023 (USD Million)
Table 83 Rest of the World (RoW): Flavor Carriers Market Size, By Flavor Type, 2016�2023 (USD Million)
Table 84 Rest of the World (RoW): Flavor Carriers Market Size, By Category, 2016�2023 (USD Million)
Table 85 Rest of the World (RoW): Flavor Carriers Market Size, By Form, 2016�2023 (USD Million)
Table 86 Africa: Flavor Carriers Market Size, By Application, 2016�2023 (USD Million)
Table 87 Africa: Flavor Carriers Market Size, By Flavor Type, 2016�2023 (USD Million)
Table 88 Middle East: Flavor Carriers Market Size, By Application, 2016�2023 (USD Million)
Table 89 Middle East: Flavor Carriers Market Size, By Flavor Type, 2016�2023 (USD Million)
Table 90 New Product Launches, 2013�2018
Table 91 Expansions and Investements, 2018
Table 92 Acquisitions, 2018
Table 93 Partnerships, Mergers, and Collaborations, 2017�2018
Table 94 Expansions and Investments, 2013�2018
Table 95 Acquisitions, 2013-2018
Table 96 Partnerships, Mergers, and Collaborations, 2014�2017
List of Figures (52 Figures)
Figure 1 Bitterness Suppressors and Flavor Carriers: Market Segmentation
Figure 2 Bitterness Suppressors and Flavor Carriers Market: Research Design
Figure 3 Bitterness Suppressors and Flavor Carriers Market: Bottom-Up Approach
Figure 4 Bitterness Suppressors and Flavor Carriers Market: Top Down Approach
Figure 5 Market Breakdown and Data Triangulation
Figure 6 Bitterness Suppressors and Flavor Carriers Market Snapshot, By Category, 2018 vs 2023
Figure 7 Bitterness Suppressors and Flavor Carriers Market Size, By Application, 2018�2023
Figure 8 Bitterness Suppressors and Flavor Carriers Market Size, By Form, 2018�2023
Figure 9 Flavor Carriers Market Size, By Flavor Type, 2018�2023
Figure 10 South America to Grow at the Highest CAGR in the Flavor Carriers Market, 2018�2023
Figure 11 Flavor Carriers Market Share, By Region
Figure 12 Growth of the Pharmaceutical Industry to Drive the Bitterness Suppressors and Flavor Carriers Market
Figure 13 US Dominated the Flavor Carriers Market in 2017
Figure 14 Food Segment to Dominate the Market Through 2023
Figure 15 Liquid Form Dominated the Market Across All Regions in 2017
Figure 16 Developing Countries to Emerge at the High Growth Rates During the Forecast Period
Figure 17 US Accounted for the Larger Share in 2017
Figure 18 Market Dynamics: Bitterness Suppressors and Flavor Carriers Market
Figure 19 Encapsulated Flavor Manufacturing Process Using Flavor Carriers
Figure 20 Patent Insights
Figure 21 Bitterness Suppressors and Flavor Carriers Market Size, By Category, 2018 vs 2023 (USD Million)
Figure 22 Flavor Carriers Market Size, By Type, 2018 vs 2023 (USD Million)
Figure 23 Flavor Carriers Market Size for Solvents, By Region, 2018 vs 2023 (USD Million)
Figure 24 Bitterness Suppressors and Flavor Carriers Market Size, By Form, 2018 vs 2023 (USD Million)
Figure 25 Liquid: Flavor Carriers Market Size, By Region, 2018 vs 2023
Figure 26 Bitterness Suppressors and Flavor Carriers Market Size, By Application, 2018 vs 2023 (USD Million)
Figure 27 Flavor Carriers Market Size for Food, By Region, 2018 vs 2023 (USD Million)
Figure 28 Flavor Carriers Market Size, By Flavor Type, 2018 vs 2023 (USD Million)
Figure 29 Flavor Carriers Market Size for Artificial Flavors, By Region, 2018 vs 2023 (USD Million)
Figure 30 Brazil to Record the Fastest Growth Rate During the Forecast Period in Flavor Carriers Market
Figure 31 North America: Flavor Carriers Market Snapshot
Figure 32 Europe: Flavor Carriers Market Snapshot
Figure 33 Asia Pacific: Flavor Carriers Market Snapshot
Figure 34 Population Growth in New Zealand, 2013�2018 (Millions)
Figure 35 Key Developments of the Leading Players in the Bitterness Suppressors and Flavor Carriers Market, 2013-2018
Figure 36 Cargill, Led the Bitterness Suppressors and Flavor Carriers Market In, 2017
Figure 37 Market Evaluation Framework
Figure 38 Firmenich: Company Snapshot
Figure 39 Firmenich: SWOT Analysis
Figure 40 D�hler: SWOT Analysis
Figure 41 Givaudan: Company Snapshot
Figure 42 Givaudan: SWOT Analysis
Figure 43 Dowdupont: Company Snapshot
Figure 44 Dowdupont: SWOT Analysis
Figure 45 Cargill: Company Snapshot
Figure 46 Cargill: SWOT Analysis
Figure 47 IFF: Company Snapshot
Figure 48 Symrise: Company Snapshot
Figure 49 Kerry: Company Snapshot
Figure 50 Sensient Technologies: Company Snapshot
Figure 51 Senomyx: Company Snapshot
Figure 52 Stepan Company: Company Snapshot


Growth opportunities and latent adjacency in Bitterness Suppressors and Flavor Carriers Market