Caramel Ingredients Market by Type (Colors, Flavors, Fillings, Inclusions, Toppings, and Others), Application, Form, & by Region - Global Trends & Forecast to 2021


[198 Pages Report] The caramel ingredients market is expected to grow from USD 1.72 billion in 2015 to USD 2.65 billion by 2021, at a CAGR of 7.5% from 2016 to 2021. Carmel ingredients are used in various applications in the food & beverage industry: as a filling, topping, colorant & flavorant, inclusion, coating, and icing. In the food & beverage industry, they find applications in confectioneries, desserts, bakery products, carbonated beverages, and alcoholic beverages. The base year considered for the study is 2015, and the forecast has been provided for the period between 2016 and 2021.
Market Dynamics:
Drivers
- Rising application in the confectionery & bakery and beverages industries
- Growth in the convenience food industry
Restraints
- Globally increasing prices of caramel ingredients
Opportunities
- Increasing demand for clean label/ natural products
Challenges
- Ill-health effects of caramel
Rapidly growing bakery, confectionery, and beverage industries drive the global caramel ingredients market
The bakery industry has attained maturity in the developed markets of Europe and North America. On the otherhand, it is booming in the emerging markets of Asia Pacific and South America. Countries such as China and India are expected to be key revenue pockets in the coming years. Consumers in these countries are opting for foreign food products amidst urbanization and improvised logistics systems. This stands as a lucrative opportunity for foreign manufacturers to expand in this region, boosting the sales of caramel ingredients; since caramel ingredients are used in bakery & confectionery products as a topping, filling, and to add color & flavor. Apart from this, in the beverage industry, cafes are coming up with caramel- flavored drinks.
The following are the major objectives of the study:
- To describe and forecast the caramel ingredients market, in terms of value, by brand, type, application, and form
- To describe and forecast the market, in terms of value and volume, by type, form, and application
- To describe and forecast the market, in terms of value, by region:Asia Pacific (APAC), Europe, North America, and the Rest of World (RoW), along with their respective countries
- To provide detailed information regarding the major factors influencing market growth (drivers, restraints, opportunities, and challenges)
- To strategically analyze micromarkets with respect to individual growth trends, prospects, and contributions to the overall market
- To study the complete value chain of caramel ingredients
- To analyze opportunities in the market for stakeholders by identifying the high-growth segments of the caramel ingredients ecosystem
- To strategically profile key players and comprehensively analyze their market positions, in terms of ranking and core competencies, along with detailing competitive landscape for market leaders
- To analyze strategic approaches such as product launches, acquisitions, agreements, and partnerships in the caramel ingredients market
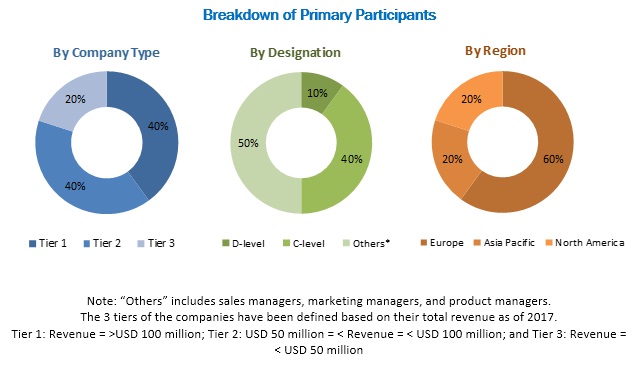
During this research study, major players operating in the caramel ingredients market in various regions have been identified; and their offerings, regional presence, and distribution channels have been analyzed through in-depth discussions. The top-down and bottom-up approaches have been used to determine the overall market size. Sizes of the other individual markets have been estimated using the percentage splits obtained through secondary sources such as Hoovers, Bloomberg BusinessWeek, and Factiva; along with primary respondents. The entire procedure includes the study of the annual and financial reports of the top market players and extensive interviews with industry experts such as CEOs, VPs, directors, and marketing executives for key insights (both qualitative and quantitative) pertaining to the market. The figure below shows the breakdown of the primaries on the basis of the company type, designation, and region considered during the research study.
To know about the assumptions considered for the study, download the pdf brochure
The caramel ingredients market comprises of large-scale players in the food & beverage industry. Key players considered in the analysis of the market are Kerry Group (Ireland), Cargill, Incorporated. (U.S.), Sensient Technologies Corporation (U.S.), Puratos Group (Belgium), and Sethness Caramel Color (U.S.). Other players include DDW The Color House (U.S.), Nigay (France), Metarom (France), Martin Braun KG (Germany), G�teborgsfood Budapest ZRT (Hungary), and Bakels Worldwide (Switzerland).
Major Market Developments:
- In May 2013, Cargill Incorporated (US) launched a new caramel product named �Caramel Equilibre, a combination of Belgian white chocolate and caramel, which would give a competitive edge to the company.
- In September 2011, Kerry Group (Ireland) acquired SuCrest GmbH (Germany), which is a leading provider of sweet ingredients to the bakery, ice-cream, confectionery, cereal, and snack industries of the European market. This strategy aids in expanding its ingredients & flavors business in the EMEA region.
- In September 2015, Sensient Technologies Corporation (US) launched a new flavored caramel range for caramel sauces that can be used in confectionery and dairy applications.
- In September 2015, Puratos Group (Belgium) acquired Pennant Ingredients, a North American company that provides specialty bakery products and solutions, which has enabled it to spread its footprint in the North American market.
Target Audience
- Food & beverage manufacturers & processors
- Research & development laboratories
- Regulatory bodies
- Intermediary suppliers
- Caramel traders and distributors/ retailers
- Food & beverage manufacturers/suppliers
Report Scope
By Type
- Fillings
- Toppings
- Inclusions
- Colors
- Flavors
- Others (coatings & icings)
By Application:
- Bakery products
- Confectionery products
- Ice creams & desserts
- Beverages
- Alcoholic
- Non-alcoholic construction
- Others
By Form:
- Solid
- Liquid
- Powder/Granular
By Geography
- North America
- Europe
- Asia Pacific (APAC)
- Rest of the World (RoW)
Critical questions the report answers:
- What are the new application areas which the caramel ingredients companies are exploring?
- Which are the key players in the market and how intense is the competition?
Available Customizations
Based on the given market data, MarketsandMarkets offers customizations in the reports as per client-specific requirements. The available customization options are as follows:
Geographic Analysis
- Further country-wise breakdown of the market in APAC based on application
Company Information
- Detailed analysis and profiling of additional market players (Up to 5)
The overall caramel ingredients market is expected to grow from USD 1.72 billion in 2015 to USD 2.65 billion by 2021, at a CAGR of 7.5%. The use of caramel ingredients in the food & beverage industry; with applications in the booming bakery, confectionery, and beverage industries are the key factors driving the growth of this market.
Caramel ingredients are manufactured through a process called caramelization, which includes the heating of various sugar components along with dairy products such as butter and cream. The resulted product is used as a colorant and flavorant in various food & beverage products such as confectioneries, desserts, bakery products, carbonated beverages, and alcoholic beverages. It is used as a filling, topping, coating, icing, inclusion; as well as to add color & flavor.
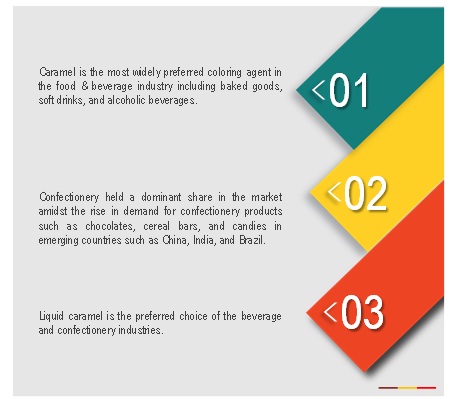
The caramel ingredients market has been segmented, on the basis of type, into fillings, toppings, inclusions, colors, flavors, and others. The market for toppings is expected to grow at the highest CAGR between 2016 and 2021. Among all the types, caramel ingredients are most commonly used as a colorant in the food & beverage industry. The high adoption of caramel ingredients as colors can be attributed to the safety associated with its use as mentioned by the leading food ingredient authorities such as the Food and Drug Administration (FDA).
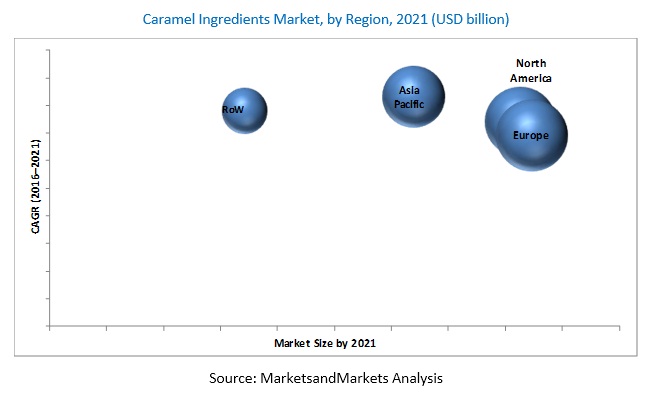
The market in Asia Pacific is expected to grow at the highest CAGR during the forecast period. Asia Pacific is the fastest-growing market for caramel ingredients. The rise in disposable income in Asia Pacific countries has urged consumers in the region to try out bakery & confectionery products, which, in turn, has increased the growth of caramel ingredients market in this region. The increasing penetration of caramel ingredients and the influx of global players, along with the emergence of native players, are contributing to the growth of the market. As a result, Asia Pacific holds a significant share of the overall market.
Caramel ingredient applications in the bakery, confectionery, and beverage industries drive the growth of the caramel ingredients market
Beverages
Caramel ingredients have applications in both non-alcoholic beverages and alcoholic beverages. In the non-alcoholic beverages category, it is used in hot beverages such as coffee; and cold beverages such as carbonated beverages. In the alcoholic beverages category, caramel malts are used to render a sweet caramel flavor to beer and other alcoholic beverages. Thus, with the rise in a number of multinational coffee chains coming up in emerging markets, the demand for caramel ingredients in hot beverages is expected to increase in the coming years.
Confectionery products
Caramel ingredients are used in confectionery products such as chocolates, cereal bars, candies, chewing gums, candied nuts, pastillage, and sweetmeats. It imparts a typical caramel flavor to these confectionery products. The demand for caramel ingredients is expected to increase with the rise in demand for confectionery products in countries such as China and India.
Bakery products
Caramel ingredients are used as a colorant in bakery products such as breads, rolls, cakes, pies, cookies, muffins, pastries, tarts, and buns. For baking applications, both liquid and powdered caramel colors are used. The bakery industry in Asia Pacific, South America, and the Middle East & Africa is booming and is expected to create lucrative growth opportunities for caramel ingredient manufacturers in the coming years. These regions are backed by a large population base that is undergoing transformations in terms of food consumption patterns. This has been increasing the demand for bakery products.
Critical questions the report answers:
- Where will all these developments take the industry in the mid to long term?
- What are the upcoming industry applications for caramel?
The major restraining factor for the caramel ingredients market is the high price of ingredients. The rise in the price of raw materials leads to a subsequent increase in the price of caramel ingredients. Apart from this, minimal consumption of confectionery products by consumers due to health concerns is expected to hinder the growth prospects for caramel ingredients in the coming years.
Key players in the market include Kerry Group (Ireland), Cargill (US), Sensient Technologies Corporation (US), Puratos Group (Belgium), and Sethness Caramel Color (US). Other players include DDW The Color House (US), Nigay (France), Metarom (France), Martin Braun KG (Germany), G�teborgsfood Budapest ZRT (Hungary), and Bakels Worldwide (Switzerland). These players are increasingly undertaking new product launches, expansions, investments, and acquisitions to further penetrate into the market.
To speak to our analyst for a discussion on the above findings, click Speak to Analyst
 Exclusive indicates content/data unique to MarketsandMarkets and not available with any competitors.
Table of Contents
1 Introduction (Page No. - 17)
1.1 Objectives of the Study
1.2 Market Definition
1.3 Market Scope
1.3.1 Market Covered
1.4 Years Considered
1.5 Currency
1.6 Units
1.7 Stakeholders
2 Research Methodology (Page No. - 21)
2.1 Research Data
2.1.1 Secondary Data
2.1.1.1 Key Data From Secondary Sources
2.1.2 Primary Data
2.1.2.1 Key Data From Primary Sources
2.1.3 Key Industry Insights
2.1.3.1 Breakdown of Primaries
2.2 Market Size Estimation
2.3 Market Breakdown & Data Triangulation
2.4 Research Assumptions and Limitations
2.4.1 Assumptions
2.4.2 Limitations
3 Executive Summary (Page No. - 31)
4 Premium Insights (Page No. - 37)
4.1 Attractive Market Opportunities for Caramel Ingredient Producers and Processors
4.2 Market For Caramel Ingredients, By Region, 2014�2021 (KT)
4.3 Caramel Ingredients Market in Europe, 2015
4.4 Market For Caramel Ingredients, By Type, in Terms of Value & Volume (2015 vs 2021)
4.5 Market For Caramel Ingredients, By Application
4.6 Caramel Ingredients Market Attractiveness
5 Market Overview (Page No. - 43)
5.1 Introduction
5.2 Macro Indicators
5.2.1 Rising Population
5.2.2 Rising Disposable Income and Urbanization
5.3 Market Segmentation
5.3.1 By Type
5.3.2 By Application
5.3.3 By Form
5.4 Market Dynamics
5.4.1 Drivers
5.4.1.1 Rising Application Industries
5.4.1.1.1 Rapidly Growing Confectionery and Bakery Industry
5.4.1.1.2 Rapidly Growing Beverage Industry
5.4.1.2 Growth in the Convenience Food Industry
5.4.2 Restraints
5.4.2.1 Globally Increasing Prices of Caramel Ingredients
5.4.3 Opportunities
5.4.3.1 Increasing Demand of Clean/Natural Label Products
5.4.4 Challenges
5.4.4.1 Increasing Awareness Regarding the Ill-Health Effects of Caramel
6 Industry Trends (Page No. - 54)
6.1 Introduction
6.2 Global Market For Caramel Ingredients: Supply Chain Analysis
6.3 Global Market For Caramel Ingredients: Value Chain Analysis
6.4 Global Caramel Ingredients Market: Porters Five Forces Analysis
6.4.1 Intensity of Competitive Rivalry
6.4.2 Bargaining Power of Suppliers
6.4.3 Bargaining Power of Buyers
6.4.4 Threat of Substitutes
6.4.5 Threat of New Entrants
6.5 Regulatory Framework
6.5.1 Introduction
6.5.2 North America
6.5.3 Europe
6.5.4 Asia-Pacific
7 Caramel Ingredients Market, By Brand (Page No. - 68)
7.1 Introduction
7.2 Peter�s Caramel
7.3 Deli
7.4 Apito
7.5 Carnation
7.6 Haagen-Dazs
7.7 Hershey�s
7.8 Smucker�s
7.9 King�s Cupboard
7.10 Torani
7.11 Marzetti
8 Caramel Ingredients Market, By Type (Page No. - 70)
8.1 Introduction
8.2 Colors
8.3 Flavors
8.4 Inclusions
8.5 Fillings
8.6 Toppings
8.7 Other Types
9 Caramel Ingredients Market, By Application (Page No. - 83)
9.1 Introduction
9.2 Beverages
9.2.1 Non-Alcoholic Beverages
9.2.2 Alcoholic Beverages
9.3 Confectionery Products
9.4 Bakery Products
9.5 ICE Creams & Desserts
9.6 Other Food Applications
10 Caramel Ingredients Market, By Form (Page No. - 95)
10.1 Introduction
10.2 Liquid Caramel
10.3 Solid Caramel
10.4 Powder/Granular Caramel
11 Caramel Ingredients Market, By Region (Page No. - 102)
11.1 Introduction
11.2 North America
11.2.1 North America: Caramel Ingredients Market, By Type
11.2.2 North America: Market, By Application
11.2.3 North America: Market, By Form
11.2.4 U.S.: Market For Caramel Ingredients, By Type
11.2.5 Canada: Market For Caramel Ingredients, By Type
11.2.6 Mexico: Market For Caramel Ingredients, By Type
11.3 Europe
11.3.1 Europe: Caramel Ingredients Market, By Type
11.3.2 Europe: Market, By Application
11.3.3 Europe: Market, By Form
11.3.4 Germany: Market For Caramel Ingredients, By Type
11.3.5 U.K.: Market For Caramel Ingredients, By Type
11.3.6 France: Market For Caramel Ingredients, By Type
11.3.7 Italy: Market For Caramel Ingredients, By Type
11.3.8 Spain: Market For Caramel Ingredients, By Type
11.3.9 Rest of Europe: Market For Caramel Ingredients, By Type
11.4 Asia-Pacific
11.4.1 Asia-Pacific: Caramel Ingredients Market, By Type
11.4.2 Asia-Pacific: Market, By Application
11.4.3 Asia-Pacific: Market, By Form
11.4.4 China: Market For Caramel Ingredients, By Type
11.4.5 India: Market For Caramel Ingredients, By Type
11.4.6 Japan: Market For Caramel Ingredients, By Type
11.4.7 Australia & New Zealand: Market For Caramel Ingredients, By Type
11.4.8 Rest of Asia-Pacific: Market For Caramel Ingredients, By Type
11.5 Rest of the World (RoW)
11.5.1 RoW: Market For Caramel Ingredients, By Type
11.5.2 RoW: Market For Caramel Ingredients, By Application
11.5.3 RoW: Market For Caramel Ingredients, By Form
11.5.4 Latin America: Market, By Type
11.5.5 Africa: Market, By Type
11.5.6 Middle East: Caramel Ingredients Market, By Type
12 Competitive Landscape (Page No. - 167)
12.1 Overview
12.2 Competitive Situation & Trends
12.2.1 New Product Launches
12.2.2 Expansion
12.2.3 Investments
12.2.4 Acquisitions
13 Company Profiles (Page No. - 172)
(Company at A Glance, Recent Financials, Products & Services, Strategies & Insights, & Recent Developments)*
13.1 Introduction
13.2 Cargill, Incorporated
13.3 Kerry Group
13.4 Sensient Technologies Corporation
13.5 Puratos Group
13.6 Sethness Caramel Color
13.7 Ddw the Color House
13.8 Bakels Worldwide
13.9 Nigay
13.10 Metarom
13.11 Martin Braun Kg
13.12 G�teborgs Food Budapest ZRT
*Details on Company at A Glance, Recent Financials, Products & Services, Strategies & Insights, & Recent Developments Might Not Be Captured in Case of Unlisted Companies.
14 Appendix (Page No. - 192)
14.1 Discussion Guide
14.2 Company Developments
14.2.1 New Product Launches
14.3 Knowledge Store: Marketsandmarkets� Subscription Portal
14.4 Available Customizations
14.5 Related Reports
List of Tables (121 Tables)
Table 1 Region Wise Drivers Which Fuel-Up the Caramel Ingredients Market Growth
Table 2 List of Foods That Contain Caramel Colors & Their Levels
Table 3 List of Food Categories in Which Caramel Colors are Authorized to Be Used
Table 4 Caramel Ingredients Market Size, By Type, 2014-2021 (USD Million)
Table 5 Caramel Ingredients Market Size, By Type, 2014-2021 (KT)
Table 6 Colors Market Size, By Region, 2014-2021 (USD Million)
Table 7 Colors Market Size, By Region, 2014-2021 (KT)
Table 8 Flavors Market Size, By Region, 2014-2021 (USD Million)
Table 9 Flavors Market Size, By Region, 2014-2021 (KT)
Table 10 Inclusions Market Size, By Region, 2014-2021 (USD Million)
Table 11 Inclusions Market Size, By Region, 2014-2021 (KT)
Table 12 Fillings Market Size, By Region, 2014-2021 (USD Million)
Table 13 Fillings Market Size, By Region, 2014-2021 (KT)
Table 14 Toppings Market Size, By Region, 2014-2021 (USD Million)
Table 15 Toppings Market Size, By Region, 2014-2021 (KT)
Table 16 Other Types Market Size, By Region, 2014-2021 (USD Million)
Table 17 Other Types Market Size, By Region, 2014-2021 (KT)
Table 18 Market Size For Caramel Ingredients, By Application, 2014�2021 (USD Million)
Table 19 Market Size For Caramel Ingredients, By Application, 2014�2021 (KT)
Table 20 Beverages Market Size, By Region, 2014�2021 (USD Million)
Table 21 Beverages Market Size, By Region, 2014�2021 (KT)
Table 22 Non-Alcoholic Beverages Market Size, By Region, 2014�2021 (USD Million)
Table 23 Non-Alcoholic Beverages Market Size, By Region, 2014�2021 (KT)
Table 24 Alcoholic Beverages Market Size, By Region, 2014�2021 (USD Million)
Table 25 Alcoholic Beverages Market Size, By Region, 2014�2021 (KT)
Table 26 Confectionery Products Market Size, By Region, 2014�2021 (USD Million)
Table 27 Confectionery Products Market Size, By Region, 2014�2021 (KT)
Table 28 Bakery Products Market Size, By Region, 2014�2021 (USD Million)
Table 29 Bakery Products Market Size, By Region, 2014�2021 (KT)
Table 30 ICE Creams & Desserts Market Size, By Region, 2014�2021 (USD Million)
Table 31 ICE Creams & Desserts Market Size, By Region, 2014�2021 (KT)
Table 32 Caramel Ingredients Market Size for Other Food Applications, By Region, 2014�2021 (USD Million)
Table 33 Caramel Ingredients Market Size for Other Food Applications, By Region, 2014�2021 (KT)
Table 34 Market Size For Caramel Ingredients, By Form, 2014-2021 (USD Million)
Table 35 Market Size For Caramel Ingredients, By Form, 2014-2021 (KT)
Table 36 Liquid Caramel Market Size, By Region, 2014-2021 (USD Million)
Table 37 Liquid Caramel Market Size, By Region, 2014-2021 (KT)
Table 38 Solid Caramel Market Size, By Region, 2014-2021 (USD Million)
Table 39 Solid Caramel Market Size, By Region, 2014-2021 (KT)
Table 40 Powder/Granular Caramel Market Size, By Region, 2014-2021 (USD Million)
Table 41 Powder/Granular Caramel Market Size, By Region, 2014-2021 (KT)
Table 42 Market Size For Caramel Ingredients, By Region, 2014-2021 (USD Million)
Table 43 Market Size For Caramel Ingredients, By Region, 2014-2021 (KT)
Table 44 North America: Market Size For Caramel Ingredients, By Country, 2014�2021 (USD Million)
Table 45 North America: Market Size For Caramel Ingredients, By Country, 2014�2021 (KT)
Table 46 North America: Market Size For Caramel Ingredients, By Type, 2014�2021 (USD Million)
Table 47 North America: Market Size For Caramel Ingredients, By Type, 2014�2021 (KT)
Table 48 North America: Market Size For Caramel Ingredients, By Application, 2014�2021 (USD Million)
Table 49 North America: Market Size For Caramel Ingredients, By Application, 2014�2021 (KT)
Table 50 North America: Beverages Market Size, By Type, 2014�2021 (USD Million)
Table 51 North America: Beverages Market Size, By Type, 2014�2021 (KT)
Table 52 North America: Market Size For Caramel Ingredients, By Form, 2014�2021 (USD Million)
Table 53 North America: Market Size For Caramel Ingredients, By Form, 2014�2021 (KT)
Table 54 U.S.: Market Size For Caramel Ingredients, By Type, 2014�2021 (USD Million)
Table 55 U.S.: Market Size For Caramel Ingredients, By Type, 2014�2021 (KT)
Table 56 Canada: Market Size For Caramel Ingredients, By Type, 2014�2021 (USD Million)
Table 57 Canada: Market Size For Caramel Ingredients, By Type, 2014�2021 (KT)
Table 58 Mexico: Market Size For Caramel Ingredients, By Type, 2014�2021 (USD Million)
Table 59 Mexico: Market Size For Caramel Ingredients, By Type, 2014�2021 (KT)
Table 60 Europe: Market Size For Caramel Ingredients, By Country, 2014�2021 (USD Million)
Table 61 Europe: Market Size For Caramel Ingredients, By Country, 2014�2021 (KT)
Table 62 Europe: Market Size For Caramel Ingredients, By Type, 2014�2021 (USD Million)
Table 63 Europe: Market Size For Caramel Ingredients, By Type, 2014�2021 (KT)
Table 64 Europe: Market Size For Caramel Ingredients, By Application, 2014�2021 (USD Million)
Table 65 Europe: Market Size For Caramel Ingredients, By Application, 2014�2021 (KT)
Table 66 Europe: Beverages Market Size, By Type, 2014�2021 (USD Million)
Table 67 Europe: Beverages Market Size, By Type, 2014�2021 (KT)
Table 68 Europe: Market Size For Caramel Ingredients, By Form, 2014�2021 (USD Million)
Table 69 Europe: Market Size For Caramel Ingredients, By Form, 2014�2021 (KT)
Table 70 Germany: Market Size For Caramel Ingredients, By Type, 2014�2021 (USD Million)
Table 71 Germany: Market Size For Caramel Ingredients, By Type, 2014�2021 (KT)
Table 72 U.K.: Market Size For Caramel Ingredients, By Type, 2014�2021 (USD Million)
Table 73 U.K.: Market Size For Caramel Ingredients, By Type, 2014�2021 (KT)
Table 74 France: Market Size For Caramel Ingredients, By Type, 2014�2021 (USD Million)
Table 75 France: Market Size For Caramel Ingredients, By Type, 2014�2021 (KT)
Table 76 Italy: Market Size For Caramel Ingredients, By Type, 2014�2021 (USD Million)
Table 77 Italy: Market Size For Caramel Ingredients, By Type, 2014�2021 (KT)
Table 78 Spain: Market Size For Caramel Ingredients, By Type, 2014�2021 (USD Million)
Table 79 Spain: Market Size For Caramel Ingredients, By Type, 2014�2021 (KT)
Table 80 Rest of Europe: Market Size For Caramel Ingredients, By Type, 2014�2021 (USD Million)
Table 81 Rest of Europe: Market Size For Caramel Ingredients, By Type, 2014�2021 (KT)
Table 82 Asia-Pacific: Market Size For Caramel Ingredients, By Country, 2014�2021 (USD Million)
Table 83 Asia-Pacific: Market Size For Caramel Ingredients, By Country, 2014�2021 (KT)
Table 84 Asia-Pacific: Market Size For Caramel Ingredients, By Type, 2014�2021 (USD Million)
Table 85 Asia-Pacific: Market Size For Caramel Ingredients, By Type, 2014�2021 (KT)
Table 86 Asia-Pacific: Market Size For Caramel Ingredients, By Application, 2014�2021 (USD Million)
Table 87 Asia-Pacific: Market Size For Caramel Ingredients, By Application, 2014�2021 (KT)
Table 88 Asia-Pacific: Beverages Market Size, By Type, 2014�2021 (USD Million)
Table 89 Asia-Pacific: Beverages Market Size, By Type, 2014�2021 (KT)
Table 90 Asia-Pacific: Market Size For Caramel Ingredients, By Form, 2014�2021 (USD Million)
Table 91 Asia-Pacific: Market Size For Caramel Ingredients, By Form, 2014�2021 (KT)
Table 92 China: Market Size For Caramel Ingredients, By Type, 2014�2021 (USD Million)
Table 93 China: Market Size For Caramel Ingredients, By Type, 2014�2021 (KT)
Table 94 India: Market Size For Caramel Ingredients, By Type, 2014�2021 (USD Million)
Table 95 India: Market Size For Caramel Ingredients, By Type, 2014�2021 (KT)
Table 96 Japan: Market Size For Caramel Ingredients, By Type, 2014�2021 (USD Million)
Table 97 Japan: Market Size For Caramel Ingredients, By Type, 2014�2021 (KT)
Table 98 Australia & New Zealand: Market Size For Caramel Ingredients, By Type, 2014�2021 (USD Million)
Table 99 Australia & New Zealand: Market Size For Caramel Ingredients, By Type, 2014�2021 (KT)
Table 100 Rest of Asia-Pacific: Market Size For Caramel Ingredients, By Type, 2014�2021 (USD Million)
Table 101 Rest of Asia-Pacific: Market Size For Caramel Ingredients, By Type, 2014�2021 (KT)
Table 102 RoW: Market Size For Caramel Ingredients, By Region, 2014�2021 (USD Million)
Table 103 RoW: Market Size For Caramel Ingredients, By Region, 2014�2021 (KT)
Table 104 RoW: Market Size For Caramel Ingredients, By Type, 2014�2021 (USD Million)
Table 105 RoW: Market Size For Caramel Ingredients, By Type, 2014�2021 (KT)
Table 106 RoW: Market Size For Caramel Ingredients, By Application, 2014�2021 (USD Million)
Table 107 RoW: Market Size For Caramel Ingredients, By Application, 2014�2021 (KT)
Table 108 RoW: Beverages Market Size, By Type, 2014�2021 (USD Million)
Table 109 RoW: Beverages Market Size, By Type, 2014�2021 (KT)
Table 110 RoW: Market Size For Caramel Ingredients, By Form, 2014�2021 (USD Million)
Table 111 RoW: Market Size For Caramel Ingredients, By Form, 2014�2021 (KT)
Table 112 Latin America: Market Size For Caramel Ingredients, By Type, 2014�2021 (USD Million)
Table 113 Latin America: Market Size For Caramel Ingredients, By Type, 2014�2021 (KT)
Table 114 Africa: Market Size For Caramel Ingredients, By Type, 2014�2021 (USD Million)
Table 115 Africa: Market Size For Caramel Ingredients, By Type, 2014�2021 (KT)
Table 116 Middle East: Market Size For Caramel Ingredients, By Type, 2014�2021 (USD Million)
Table 117 Middle East: Market Size For Caramel Ingredients, By Type, 2014�2021 (KT)
Table 118 New Product Launches, 2013�2016
Table 119 Expansion, 2012�2016
Table 120 Investments, 2014�2015
Table 121 Acquisitions, 2011�2015
List of Figures (95 Figures)
Figure 1 Caramel Ingredients Market Segmentation
Figure 2 Caramel Ingredients Market: Research Design
Figure 3 Breakdown of Primary Interviews, By Company Type, Designation & Region
Figure 4 Market Size Estimation Methodology: Bottom-Up Approach
Figure 5 Market Size Estimation Methodology: Top-Down Approach
Figure 6 Data Triangulation Methodology
Figure 7 Colors Segment to Dominate the Global Caramel Ingredients Market, By Type, 2016 & 2021
Figure 8 Powder/Granular Form of Caramel to Register the Highest Rate, in Terms of Value Between 2016 & 2021
Figure 9 Beverages Segment to Dominate the Global Caramel Ingredients Market By 2021
Figure 10 Asian Countries to Be the Fastest-Growing in the Global Caramel Ingredients Market, in Terms of Value (2016-2021)
Figure 11 Attractive Growth Opportunities in the Caramel Ingredients Market for Manufacturers, 2016-2021
Figure 12 Caramel Ingredients Market: Asia-Pacific to Grow at the Highest Rate Between 2014 and 2021
Figure 13 Germany Accounted for the Largest Share in the European Caramel Ingredients Market in 2015
Figure 14 Toppings Andflavors Segments to Grow at the Highest Rates From 2016 to 2021, in Terms of Value and Volume Respectively
Figure 15 Beverages Application Dominated the Caramel Ingredients Market Across All Regions in 2015
Figure 16 Asia-Pacific Caramel Ingredients Market to Grow at the Highest Rate From 2016 to 2021
Figure 17 Percentage Change in Population Growth of Key Countries, 2010-2014
Figure 18 GDP of Leading Countries, 2013
Figure 19 Market Segmentation For Caramel Ingredients, By Type
Figure 20 Market Segmentation For Caramel Ingredients, By Application
Figure 21 Market Segmentation For Caramel Ingredients, By Form
Figure 22 Rapidly Increasing Size of the Fast Food Industry is Expected to Lead the Global Caramel Ingredients Market in the Future
Figure 23 Growing Confectionery Sales, 2013�2015
Figure 24 Rapidly Growing Bakery Market, 2010�2015 (USD Billion)
Figure 25 Growth Rate of Global Beverage Sales, 2011�2016
Figure 26 Rising Sugar Prices, 2005�2015 (USD/Kg)
Figure 27 Increasing U.S. Organic Food Sales (2010-2014)
Figure 28 Global Market For Caramel Ingredients: Supply Chain Analysis
Figure 29 Global Market For Caramel Ingredients: Value Chain Analysis
Figure 30 Global Market For Caramel Ingredients: Porters Five Forces Analysis
Figure 31 Colors Segment to Dominate Global Caramel Ingredients Market By 2021
Figure 32 Europe is Projected to Hold the Largest Share in the Global Colors Market in 2021
Figure 33 Europe Dominated the Global Flavors Market in 2015
Figure 34 Asia-Pacific- Fastest Growing Inclusions Market During the Forecast Period (2016-2021)
Figure 35 Asia-Pacific to Grow at the Highest CAGR in the Global Fillings Market During the Forecast Period (2016-2021)
Figure 36 Asia-Pacific to Grow at the Highest CAGR in the Global Toppings Market Between 2016 and 2021
Figure 37 Confectionery Products Accounted for the Largest Share in the Caramel Ingredients Market in 2015
Figure 38 Europe Held the Largest Size of the Caramel Ingredients Market for Beverages Application in 2015
Figure 39 Europe is Projected to Lead the Confectionery Products Segment From 2015 to 2021
Figure 40 North America to Be the Largest Market for Bakery Products Through 2021
Figure 41 North America Captured the Largest ICE Creams & Desserts Market Share in 2016
Figure 42 Liquid Caramel Segment to Dominate the Global Caramel Ingredients Market (2015 vs 2021)
Figure 43 Europe is Estimated to Hold the Largest Share in the Global Liquid Caramel Market By 2021
Figure 44 Europe Dominated the Solid Caramel Market in 2015
Figure 45 Asia-Pacific Powder/Granular Caramel Market is Projected to Grow at the Highest CAGR (2016-2021)
Figure 46 Europe is Projected to Dominate the Global Caramel Ingredients Market By 2021
Figure 47 Regional Snapshot: Asia-Pacific to Be the Most Attractive Market for Caramel Ingredients Manufacturers, 2016-2021
Figure 48 U.S. to Lead the North American Caramel Ingredients Market, 2015 vs 2021
Figure 49 Colors Held the Largest Share in the North American Caramel Ingredients Market in 2015
Figure 50 Confectionery Products Segment Accounted for the Largest Share in the North American Caramel Ingredients Market in 2015
Figure 51 Liquid Caramel Accounted for the Largest Share in the North American Caramel Ingredients Market in 2016
Figure 52 The Colors Segment is Projected to Lead the U.S. Caramel Ingredients Market By 2021
Figure 53 Colors to Dominate the Canadian Caramel Ingredients Market By 2021
Figure 54 Mexican Topings is Expected Fastest Growing Market (2016)
Figure 55 European Caramel Ingredients Market Snapshot: Germany Accounting for the Largest Share
Figure 56 Germany is Expected to Dominate the Caramel Ingredients Market in Europe From 2015 to 2021
Figure 57 Colors Segment Held the Largest Share in the European Caramel Ingredients Market in 2015
Figure 58 Confectionery Products Segment to Lead the European Caramel Ingredients Market By 2021
Figure 59 Powder/Granular Caramel Segment Fastest Growing Market During Forecasted Year (2016-2021)
Figure 60 Colors Segment to Dominate the German Market By 2021
Figure 61 Colors Segment Led the U.K. Market in 2015
Figure 62 Colors Segment Dominated the Market in France in 2015
Figure 63 Colors Acccounted the Largest Italy�s Market From 2016 to 2021
Figure 64 Colors Segment to Lead the Market in Spain By 2021
Figure 65 Colors Segment Dominated the Market in the Rest of Europe, 2015
Figure 66 Asia-Pacific Caramel Ingredients Market Snapshot: China Accounting for the Largest Share
Figure 67 China is Projected to Dominate the Caramel Ingredients Market in Asia-Pacific in 2021
Figure 68 Colors is Estimated to Dominate the Asia-Pacific Caramel Ingredients Market During the Forecast Period
Figure 69 Confectionery Products Segment is Projected to Lead the Asia-Pacific Caramel Ingredients Market in 2021
Figure 70 Liquid Caramel to Lead the Asia-Pacific Caramel Ingredients Market in 2021
Figure 71 Colors to Dominate the Caramel Ingredients Market in China By 2021
Figure 72 Colors Captured the Largest Market Share in Indian Caramel Ingredients Market During the Forecast Period
Figure 73 Colors Segment is Projected to Dominate the Market in Japan From By 2021
Figure 74 Colors Segment to Hold Largest Share in the Market in Australia & New Zealand By 2021
Figure 75 Colors Segment Dominated the Market in the Rest of Asia-Pacific in 2015
Figure 76 Latin America to Lead the RoW Market, 2015 & 2021
Figure 77 Colors Held the Largest Share in the RoW Caramel Ingredients Market in 2015
Figure 78 Confectionery Products Segment Accounted for the Largest Share in the RoW Caramel Ingredients Market in 2015
Figure 79 Liquid Segment is Estimated to Dominate the RoW Caramel Ingredients Market During the Forecast Period
Figure 80 Colors Segment is Projected to Lead the Latin America Caramel Ingredients Market By 2021
Figure 81 Colors Segment to Lead the African Caramel Ingredients Market Through 2021
Figure 82 Colors Segment is Estimated to Capture the Largest Market Share in the Middle East Caramel Ingredients Market During the Forecasted Period
Figure 83 New Product Launches Was Preferred By Key Caramel Ingredient Companies in the Last Five Years (2011-2016)
Figure 84 Strengthening Market Presence Through New Product Launches & Expansion Between 2011 and 2016
Figure 85 New Product Launches: the Key Strategy, 2010�2015
Figure 86 Geographical Revenue Mix of Top Five Market Players
Figure 87 Cargill, Incorporated: Company Snapshot
Figure 88 Cargill, Incorporated: SWOT Analysis
Figure 89 Kerry Group: Company Snapshot
Figure 90 Kerry Group: SWOT Analysis
Figure 91 Sensient Technologies Corporation: Company Snapshot
Figure 92 Sensient Technology Corporation: SWOT Analysis
Figure 93 Puratos Group: Company Snapshot
Figure 94 Puratos Group: SWOT Analysis
Figure 95 Sethness Caramel Color: SWOT Analysis


Growth opportunities and latent adjacency in Caramel Ingredients Market