Dairy Blends Market by Type, Application (Ice Cream, Yogurt, Infant Formula, Bakery Products, Feed, Butter & Cheese Blends, and Beverages), Form (Spreadable, Liquid, and Powder), and Region - Global Forecast to 2022


The dairy blends market is projected to reach USD 3.56 Billion by 2022, at a CAGR of 8.1% from 2016. Dairy blends have a significant impact on food products, in terms of maintaining the quality, flavor, and taste, which has led to its high-demand across the globe.
The years considered for the study are as follows:
- Base year – 2015
- Estimated year – 2016
- Projected year – 2022
- Forecast period – 2016 to 2022
Objectives of the study include:
- To define, segment, and project the size of the global market for dairy blends on the basis of type, application, form, and region
- To provide detailed information about the key factors influencing the growth of the market (drivers, restraints, opportunities, and industry-specific challenges)
- To strategically analyze micro-markets with respect to individual growth trends, future prospects, and their contribution to the total market
- To analyze opportunities in the market for stakeholders and provide details of the competitive landscape of market leaders
- To project the size of the market and its submarkets, in terms of value and volume, with respect to the four main regions (along with their respective key countries): North America, Europe, Asia-Pacific, and Rest of the World (RoW)
- To strategically profile key players and comprehensively analyze their core competencies
- To analyze competitive developments such as acquisitions, expansions, joint ventures, and research & developments in the market
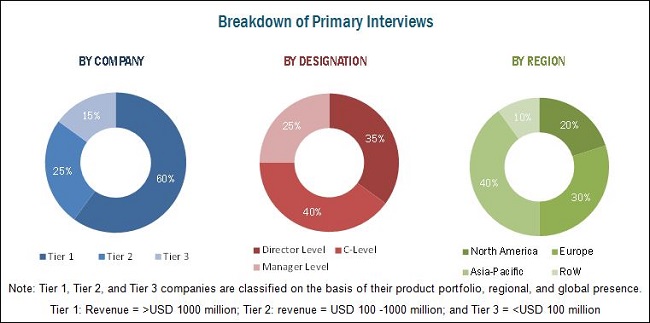
This report includes the estimation of market sizes in terms of value (USD million) and volume (KT). Both top-down and bottom-up approaches have been used to estimate and validate the size of the dairy blends market and various other dependent submarkets. Key players in the market have been identified through secondary sources such as company financials magazines, journals such as Bloomberg Businessweek and, press releases, paid databases; their market shares in their respective regions have been determined through primary and secondary research. All percentage shares, splits, and breakdowns have been determined using secondary sources and were verified through primary sources.
To know about the assumptions considered for the study, download the pdf brochure
Key players in the dairy blends market are Fonterra Co-operative Group Ltd. (New Zealand), Doehler Group (Germany), Agropur ingredients (Canada), Royal FrieslandCampina N.V. ( Netherlands), and Kerry Group (Ireland), Maximum value addition of a product in the global dairy blends industry is observed in the product manufacturing stage. Value addition in the marketing and sales stages varies based on key players, addressable markets, manufacturing units, and end consumers. Key companies that offer dairy blends mainly invest in expansions through acquisitions and the development of new facilities.
Target Audience:
- Government and research organizations
- Dairy blends associations and industrial bodies
- Dairy associations
- Raw material suppliers and distributors
- Dairy blends traders, distributors, and dealers
- Dairy blends manufacturers
- Research and consulting firms
“The study answers several questions for stakeholders, primarily which market segments to focus on in the next two to five years for prioritizing efforts and investments.”
Scope of the Report
This research report categorizes the dairy blends market on the basis of type, application, form, and region.
Based on Type, the market has been segmented as follows:
- Dairy Mixtures
- Dairy/Non-dairy ingredients
- Dairy as functional ingredient
- Dairy as carrier
- Others (combinations, dairy/protein derivatives, and dairy/non-dairy fat component)
Based on Form, the market has been segmented as follows:
- Spreadable
- Powder
- Liquid
Based on Application, the market has been segmented as follows:
- Ice cream
- Yogurt
- Infant formula
- Bakery
- Feed
- Butter & cheese spreadable blends
- Beverages
- Others (cocoa preparations, chocolate, and confectionery)
Based on Region, the market has been segmented as follows:
- North America
- Europe
- Asia-Pacific
- RoW (Argentina, Egypt, Chile, and other Middle Eastern countries)
Available Customizations
With the given market data, MarketsandMarkets offers customizations according to client-specific needs.
The following customization options are available for the report:
Product Analysis
- Product matrix, which gives a detailed comparison of the product portfolio of each company
Regional Analysis
- Further breakdown of the Rest of Europe dairy blends market into Sweden, Poland, Norway, and the Netherlands
- Further breakdown of the Rest of Asia-Pacific dairy blends market into Indonesia and Vietnam
- Further breakdown of the RoW dairy blends market into Africa and the Middle East
Company Information
- Detailed analysis and profiling of additional market players (up to three)
The dairy blends market is projected to reach USD 3.56 Billion by 2022, at a CAGR of 8.1% from 2016. The growth in demand for low-fat spreadables is the main driving factor of this market.
The market, based on type, has been segmented into dairy mixtures, dairy/non-dairy ingredients, dairy as functional ingredient, dairy as carrier, and others. Dairy/non-dairy ingredients accounted for a largest market share in 2015. This type has a wide range of applications in different industries such as infant formula, dairy formulations, bakery, other dairy products, nutritional bars/nutritional formula, cocoa, and confectionery.
The dairy blends market, based on application, has been segmented into ice cream, yogurt, infant formula, bakery, feed, butter & cheese blends, beverages, and others. The bakery segment accounted for the largest share of the market in 2015. Increase in health-consciousness, is fueling the demand for low-calorie bakery products among consumers. This is expected to drive the market for dairy blends as functional ingredients in this particular segment. Dairy blends are cost-effective alternatives to butter, with lower fat content, and do not have the negative impact on the taste of the products like margarine does. Hence, their demand in the bakery industry as a replacement for these two ingredients is increasing.
The market, based on form, has been segmented into spreadable, liquid, and powder. The spreadable segment accounted for the largest share in 2015. The spreadable form is widely used as a substitute for butter and margarine, the demand for which was discussed above. This form has many applications in industries such as bakery, yogurt, ice cream, cheese & butter blends, infant formula, and feed. These factors are increasing the demand for this form of dairy blends.
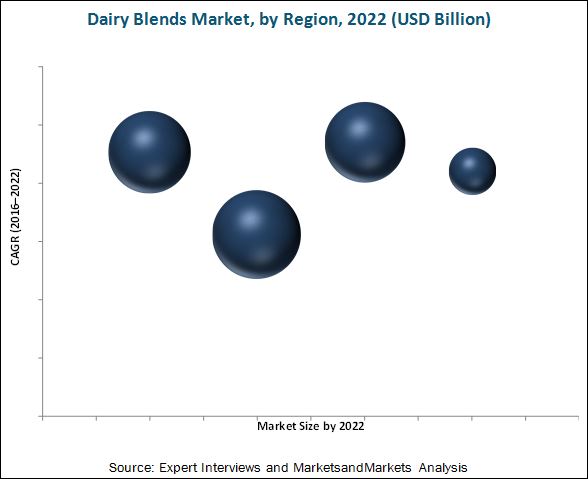
The dairy blends market in Asia-Pacific is projected to grow at the highest CAGR during the forecast period. Key drivers for the growth of this market include increase in disposable income, growth in demand from developing and populous countries such as China, Japan, South Korea, and India, and the presence of a large-scale dairy sector in Australia & New Zealand.
Despite numerous advantages of dairy blends, consumers are reluctant to use them over traditional dairy products. In few developed as well as developing markets, food & beverage manufacturers prefer to use butter, margarine, and other conventional dairy products instead of dairy blends. Concerns among food and beverage manufacturers towards dairy blends that they deteriorate the taste of food products is one of the challenge for the market.
The market is characterized by high competition due to the presence of a number of large and small-scale firms. Acquisitions and expansions were the key strategies adopted by these players to ensure their growth in the market during 2011 to 2016. The market was dominated by players such as Fonterra Co-operative Group Ltd. (New Zealand), Doehler Group (Germany), Agropur ingredients (Canada), Royal FrieslandCampina N.V. ( Netherlands), and Kerry Group (Ireland).
To speak to our analyst for a discussion on the above findings, click Speak to Analyst
 Exclusive indicates content/data unique to MarketsandMarkets and not available with any competitors.
Table of Contents
1 Introduction (Page No. - 13)
1.1 Objectives of the Study
1.2 Market Definition
1.3 Market Scope
1.3.1 Years Considered in the Report
1.4 Currency
1.5 Stakeholders
2 Research Methodology (Page No. - 16)
2.1 Research Data
2.1.1 Secondary Data
2.1.1.1 Key Data From Secondary Sources
2.1.2 Primary Data
2.1.2.1 Key Data From Primary Sources
2.1.2.2 Key Industry Insights
2.1.2.3 Breakdown of Primaries
2.2 Factor Analysis
2.2.1 Introduction
2.2.2 Demand-Side Analysis
2.2.2.1 Developing Economies
2.2.2.2 Growing Middle-Class Population
2.2.3 Supply-Side Analysis
2.3 Market Size Estimation
2.4 Market Breakdown & Data Triangulation
2.4.1 Assumptions
2.4.2 Limitations
3 Executive Summary (Page No. - 26)
4 Premium Insights (Page No. - 30)
4.1 Opportunities in the Market
4.2 Key Dairy Blends Markets
4.3 Life Cycle Analysis: Market, By Region
4.4 Market, By Type
4.5 Europe: Market, By Application & Country
4.6 Market, By Form & Region
4.7 Developed vs Emerging Dairy Blends Markets
5 Market Overview (Page No. - 36)
5.1 Introduction
5.2 Market Segmentation
5.2.1 Type
5.2.2 Application
5.2.3 Form
5.2.4 Region
5.3 Market Dynamics
5.3.1 Drivers
5.3.1.1 Higher Prices of Traditional Dairy Commodities
5.3.1.2 Health Benefits of Dairy Blends
5.3.2 Restraints
5.3.2.1 Low Awareness Among Consumers
5.3.3 Opportunities
5.3.3.1 Emerging Markets
5.3.3.2 Dairy Blends as Additives
5.3.4 Challenges
5.3.4.1 Consumer Attitude Toward Dairy Blends
5.4 Value Chain Analysis
6 Dairy Blends Market, By Type (Page No. - 43)
6.1 Introduction
6.2 Dairy Mixtures
6.3 Dairy/Non-Dairy Ingredients
6.4 Dairy as Functional Ingredient
6.5 Dairy as Carrier
6.6 Others
7 Dairy Blends Market, By Application (Page No. - 52)
7.1 Introduction
7.2 Ice Cream
7.3 Yogurt
7.4 Infant Formula
7.5 Bakery
7.6 Butter & Cheese Blends
7.7 Feed
7.8 Beverage
7.9 Other Applications
8 Dairy Blends Market, By Form (Page No. - 64)
8.1 Introduction
8.2 Spreadable
8.3 Powder
8.4 Liquid
9 Dairy Blends Market, By Region (Page No. - 70)
9.1 Introduction.
9.2 North America
9.2.1 U.S.
9.2.2 Canada
9.2.3 Mexico
9.3 Europe
9.3.1 Germany
9.3.2 France
9.3.3 U.K.
9.3.4 Italy
9.3.5 Rest of Europe
9.4 Asia-Pacific
9.4.1 Australia & New Zealand
9.4.2 China
9.4.3 Japan
9.4.4 India
9.4.5 South Korea
9.4.6 Rest of Asia-Pacific
9.5 Rest of the World (RoW)
9.5.1 Brazil
9.5.2 South Africa
10 Competitive Landscape (Page No. - 109)
10.1 Overview
10.2 Competitive Situations & Trends
10.3 Acquisitions
10.4 Expansions
10.5 Joint Venture, and Partnerships
11 Company Profiles (Page No. - 113)
(Company at A Glance, Recent Financials, Products & Services, Strategies & Insights, & Recent Developments)*
11.1 Introduction
11.2 Fonterra Co-Operative Group Limited
11.3 Cargill, Inc.
11.4 Kerry Group
11.5 Royal Frieslandcampina N.V.
11.6 Agropur Ingredients
11.7 Döhler Group
11.8 Intermix Australia Pty Ltd.
11.9 Advanced Food Products LLC
11.10 Galloway Company, Inc.
11.11 Cape Food Ingredients
*Details on Company at A Glance, Recent Financials, Products & Services, Strategies & Insights, & Recent Developments Might Not Be Captured in Case of Unlisted Companies.
12 Appendix (Page No. - 132)
12.1 Discussion Guide
12.2 Knowledge Store: Marketsandmarkets’ Subscription Portal
12.3 Introducing RT: Real-Time Market Intelligence
12.4 Available Customizations
12.5 Related Reports
List of Tables (93 Tables)
Table 1 Global Dairy Blends Market Snapshot
Table 2 Dairy Blends Market Size, By Type, 2014–2022 (USD Million)
Table 3 Market Size, By Type, 2014–2022 (KT)
Table 4 Dairy Mixtures Market Size, By Region, 2014–2022 (USD Million)
Table 5 Market Size, By Region, 2014–2022 (KT)
Table 6 Dairy/Non-Dairy Ingredients Market Size, By Region, 2014–2022 (USD Million)
Table 7 Market Size, By Region, 2014–2022 (KT)
Table 8 Dairy as Functional Ingredient Market Size, By Region, 2014–2022 (USD Million)
Table 9 Dairy as Functional Ingredient Market Size, By Region, 2014–2022 (KT)
Table 10 Dairy as Carrier Market Size, By Region, 2014–2022 (USD Million)
Table 11 Dairy as Carrier Market Size, By Region, 2014–2022 (KT)
Table 12 Other Types Market Size, By Region, 2014–2022 (USD Million)
Table 13 Other Types Market Size, By Region, 2014–2022 (KT)
Table 14 Dairy Blends Market Size, By Application, 2014–2022 (USD Million)
Table 15 Market Size, By Application, 2014–2022 (KT)
Table 16 Market Size in Ice Cream, By Region, 2014–2022 (USD Million)
Table 17 Market Size in Ice Cream, By Region, 2014–2022 (KT)
Table 18 Market Size in Yogurt, By Region, 2014–2022 (USD Million)
Table 19 Market Size in Yogurt, By Region, 2014–2022 (KT)
Table 20 Market Size in Infant Formula, By Region, 2014–2022 (USD Million)
Table 21 Market Size in Infant Formula, By Region, 2014–2022 (KT)
Table 22 Dairy Blends Market Size in Bakery, By Region, 2014–2022 (USD Million)
Table 23 Market Size in Bakery, By Region, 2014–2022 (KT)
Table 24 Market Size in Butter & Cheese Blends, By Region, 2014–2022 (USD Million)
Table 25 Market Size in Butter & Cheese Blends, By Region, 2014–2022 (KT)
Table 26 Market Size in Feed, By Region, 2014–2022 (USD Million)
Table 27 Market Size in Feed, By Region, 2014–2022 (KT)
Table 28 Market Size in Beverage, By Region, 2014–2022 (USD Million)
Table 29 Market Size in Beverage, By Geography, 2014–2022 (KT)
Table 30 Dairy Blends Market Size in Other Applications, By Region, 2014–2022 (USD Million)
Table 31 Market Size in Other Applications, By Region, 2014–2022 (KT)
Table 32 Dairy Blends Market Size, By Form, 2014–2022 (USD Million)
Table 33 Market Size, By Form, 2014–2022 (KT)
Table 34 Spreadable Dairy Blends Market Size In, By Region, 2014–2022 (USD Million)
Table 35 Spreadable Dairy Blends Market Size, By Region, 2014–2022 (KT)
Table 36 Powdered Dairy Blends Market Size, By Region, 2014–2022 (USD Million)
Table 37 Market Size, By Region, 2014–2022 (KT)
Table 38 Liquid Dairy Blends Market Size, By Region, 2014–2022 (USD Million)
Table 39 Market Size, By Region, 2014–2022 (KT)
Table 40 Market Size, By Region, 2014–2022 (USD Million)
Table 41 Market Size, By Region, 2014–2022 (KT)
Table 42 North America: Market Size, By Country, 2014–2022 (USD Million)
Table 43 North America: Market Size, By Country, 2014–2022 (KT)
Table 44 North America: Market Size, By Application, 2014–2022 (USD Million)
Table 45 North America: Market Size, By Application, 2014–2022 (KT)
Table 46 U.S.: Market Size, By Application, 2014–2022 (USD Million)
Table 47 U.S.: Market Size, By Application, 2014–2022 (KT)
Table 48 Canada: Dairy Blends Market Size, By Application, 2014–2022 (USD Million)
Table 49 Canada: Market Size, By Application, 2014–2022 (KT)
Table 50 Mexico: Market Size, By Application, 2014–2022 (USD Million)
Table 51 Mexico: Market Size, By Application, 2014–2022 (KT)
Table 52 Europe: Market Size, By Country, 2014–2022 (USD Million)
Table 53 Europe: Market Size, By Country, 2014–2022 (KT)
Table 54 Europe: Market Size, By Application, 2014–2022 (USD Million)
Table 55 Europe: Market Size, By Application, 2014–2022 (KT)
Table 56 Germany: Market Size, By Application, 2014–2022 (USD Million)
Table 57 Germany: Market Size, By Application, 2014–2022 (KT)
Table 58 France: Market Size, By Application, 2014–2022 (USD Million)
Table 59 France: Market Size, By Application, 2014–2022 (KT)
Table 60 U.K.: Market Size, By Application, 2014–2022 (USD Million)
Table 61 U.K.: Market Size, By Application, 2014–2022 (KT)
Table 62 Italy: Dairy Blends Market Size, By Application, 2014–2022 (USD Million)
Table 63 Italy: Market Size, By Application, 2014–2022 (KT)
Table 64 Rest of Europe: Market Size, By Application, 2014–2022 (USD Million)
Table 65 Rest of Europe: Market Size, By Application, 2014–2022 (KT)
Table 66 Asia-Pacific: Market Size, By Country/Region, 2014–2022 (USD Million)
Table 67 Asia-Pacific: Market Size, By Country, 2014–2022 (KT)
Table 68 Asia-Pacific: Market Size, By Application, 2014–2022 (USD Million)
Table 69 Asia-Pacific: Market Size, By Application, 2014–2022 (KT)
Table 70 Australia & New Zealand: Dairy Blends Market Size, By Application, 2014–2022 (USD Million)
Table 71 Australia & New Zealand: Market Size, By Application, 2014–2022 (KT)
Table 72 China: Market Size, By Application, 2014–2022 (USD Million)
Table 73 China: Market Size, By Application, 2014–2022 (KT)
Table 74 Japan: Market Size, By Application, 2014–2022 (USD Million)
Table 75 Japan: Market Size, By Application, 2014–2022 (KT)
Table 76 India: Market Size, By Application, 2014–2022 (USD Million)
Table 77 India: Market Size, By Application, 2014–2022 (KT)
Table 78 South Korea: Dairy Blends Market Size, By Application, 2014–2022 (USD Million)
Table 79 South Korea: Market Size, By Application, 2014–2022 (KT)
Table 80 Rest of Asia-Pacific: Market Size, By Application, 2014–2022 (USD Million)
Table 81 Rest of Asia-Pacific: Market Size, By Application, 2014–2022 (KT)
Table 82 RoW: Dairy Blends Market Size, By Region, 2014–2022 (USD Million)
Table 83 RoW: Market Size, By Region, 2014–2022 (KT)
Table 84 RoW: Market Size, By Application, 2014–2022 (USD Million)
Table 85 RoW: Market Size, By Application, 2014–2022 (KT)
Table 86 Brazil: Market Size, By Application, 2014–2022 (USD Million)
Table 87 Brazil: Market Size, By Application, 2014–2022 (KT)
Table 88 South Africa: Dairy Blends Market Size, By Application, 2014–2022 (USD Million)
Table 89 South Africa: Market Size, By Application, 2014–2022 (KT)
Table 90 Acquisitions, 2011–2016
Table 91 Expansions, 2011-2016
Table 92 Joint Venture, and Partnerships, 2011–2016
Table 93 Fonterra Co-Operative Group Limited: Products & Services
List of Figures (45 Figures)
Figure 1 Market: Research Design
Figure 2 Breakdown of Primary Interviews: By Company Type, Designation, and Region
Figure 3 GDP (PPP) of Top Economies, 2015
Figure 4 Market Size Estimation: Bottom-Up Approach
Figure 5 Market Size Estimation Methodology: Top-Down Approach
Figure 6 Market Breakdown & Data Triangulation
Figure 7 Dairy/Non-Dairy Ingredients Segment to Dominate the Global Market, in Terms of Value (2016-2022)
Figure 8 Bakery Products Segment Estimated to Lead the Market in 2016 (USD Million)
Figure 9 Spreadable Form Segment to Lead the Dairy Blends Market (USD Million)
Figure 10 Asia-Pacific Projected to Be the Fastest-Growing Regional Dairy Blends Market
Figure 11 Opportunities in the Market, 2016-2022
Figure 12 Asia-Pacific to Register A High Growth Rate (2016 – 2022)
Figure 13 Asia-Pacific Market Poised for Robust Growth, 2016 to 2022
Figure 14 Europe Estimated to Dominate the Market, By Type, in 2016
Figure 15 Bakery Segment Estimated to Dominate the European Dairy Blends Market in 2016
Figure 16 Powder Segment Projected to Grow at the Highest Rate From 2016 to 2022
Figure 17 China & South Korea Projected to Be the Most Attractive Markets for Dairy Blends, 2016 to 2022
Figure 18 Dairy Blends Market Segmentation
Figure 19Market Segmentation, By Type
Figure 20 Market Segmentation, By Application
Figure 21 Market Segmentation, By Form
Figure 22 Market Segmentation, By Region
Figure 23 Higher Prices of Traditional Dairy Commodities and Multifunctionality of Dairy Blends are Expected to Lead to the Growth of the Global Dairy Blends Market
Figure 24 Production/Processing of Dairy Blends Contributes the Most to the Overall Value
Figure 25 Market, By Type
Figure 26 Dairy/Non-Dairy Ingredients Segment is Projected to Account for the Largest Market Share Through Forecast Period
Figure 27 Market, By Application
Figure 28 The Bakery Segment is Projected to Be the Largest Through Forecast Period
Figure 29 Dairy Blends Market, By Form
Figure 30 The Spreadable Segment is Projected to Be the Largest Through 2022
Figure 31 Regional Snapshot (2016–2022): Asia-Pacific is Projected to Grow at the Highest Rate in Terms of Value
Figure 32 North American Dairy Blends Market Snapshot: the U.S. is Projected to Dominate the Market Through 2022
Figure 33 European Dairy Blends Market Snapshot: Growing Market Demand in France is Driving the Market
Figure 34 Acquisitions & Expansions: Leading Strategies of Key Players
Figure 35 Expansions and Acquisitions Were the Main Strategies Adopted By Players From 2014 to 2016
Figure 36 Acquisition: the Key Strategy, 2011–2016
Figure 37 Fonterra Co-Operative Group Limited: Company Snapshot
Figure 38 Fonterra Co-Operative Group Limited: SWOT Analysis
Figure 39 Cargill, Inc.: Company Snapshot
Figure 40 Cargill, Inc.: SWOT Analysis
Figure 41 Kerry Group: Company Snapshot
Figure 42 Kerry Group: SWOT Analysis
Figure 43 Royal Frieslandcampina N.V.: Company Snapshot
Figure 44 Royal Frieslandcampina N.V.: SWOT Analysis
Figure 45 Agropur Ingredients: Company Snapshot


Growth opportunities and latent adjacency in Dairy Blends Market