Digital Signal Processor Market

Digital Signal Processor Market by Core (Single Core, Multi-Core), Configuration (Low-end, Mid-range, High-end), Type (General-purpose, Application-specific), Category, IC Design, Application, End-User Industry and Region - Global Forecast to 2029

Report Code: SE 1258 May, 2024, by marketsandmarkets.com

Updated on : May 29, 2024

[320 Pages Report] The Digital Signal Processor market size was valued at USD  10.1 billion in 2024 and is estimated to reach USD  14.7 billion by 2029, registering a CAGR of 7.8% during the forecast period. The growth of Digital Signal Processor market is driven by surging adoption of Internet of Things (IoT) and connected devices; increasing trend of digital signal processing in automotive industry; improvements in 5G technology and development of advanced communication infrastructure; and rising demand for Voice over Internet Protocol (VoIP) and Internet Protocol (IP) video services.

Digital Signal Processor Market

Digital Signal Processor Market

Digital Signal Processor Market Forecast to 2029

To know about the assumptions considered for the study, Request for Free Sample Report

Digital Signal Processor Market Dynamics:

Driver: Surging adoption of Internet of Things (IoT) and connected devices

The surge in demand for Internet of Things (IoT) devices and the evolution of edge computing are driving the growth of the digital signal processor industry . IoT devices, ranging from smart home gadgets to industrial sensors, generate vast amounts of data. DSPs are pivotal in efficiently processing this real-time sensor data, filtering out noise, and extracting valuable insights. They excel in tasks such as signal conditioning, making raw data usable for further analysis, and enabling on-device machine learning for applications including anomaly detection and predictive maintenance. Edge computing is driving increased demand for DSPs, as it involves processing data nearer to its origin. This approach results in quicker response times, reduced latency, and improved data security, all contributing to the growing need for DSP technology. DSPs facilitate real-time decision-making in edge computing, reducing bandwidth consumption by processing data locally and improving security by enabling local data analysis on devices.

Restraint: High designing and manufacturing costs

The high costs involved in developing and manufacturing DSPs are restraining the market growth. These costs span multiple phases, starting with extensive research and development. This phase requires substantial investments in skilled personnel, specialized equipment, software tools, and intellectual property (IP) core licenses. DSPs are often integrated with complex algorithms and functionalities, necessitating thorough R&D to ensure optimal performance, power efficiency, and compatibility across diverse applications. The design phase further amplifies costs, involving intricate architectural decisions, layout optimizations, and system-level integration. Customization of DSPs for specific applications or industries adds complexity and increases development expenses.

Opportunities: Increasing demand for DSP chips in consumer electronics industry

DSP chips are fundamental components that significantly enhance the performance and functionality of consumer electronics. In audio devices such as headphones, speakers, and home theatre systems, DSP chips enable advanced audio processing features such as noise cancellation, equalization, and surround sound processing, ensuring high-quality audio playback. Additionally, DSPs are crucial in image and video processing tasks in devices such as digital cameras and smartphones, facilitating functions including image stabilization, autofocus, and video encoding/decoding for improved visual quality. They also play a pivotal role in wireless communication devices by optimizing signal processing algorithms for efficient data transmission and reception, ensuring reliable connectivity in smartphones, tablets, and wearables. Furthermore, DSP chips process data from various sensors used in consumer electronics, providing features such as gesture recognition, activity tracking, and biometric authentication. They are also integral to real-time control and automation applications in smart home devices and in executing AI algorithms for virtual assistant functionalities, making DSPs indispensable components driving innovation in modern digital devices.

Challenge: Navigating complexity and security challenges

The complexity of implementing DSPs poses a formidable challenge for the market players. Specialized programming skills are essential for software development, demanding expertise in signal-processing algorithms, hardware architectures, and low-level programming languages. This requirement makes finding and retaining skilled developers costly and challenges meeting real-time constraints typical of DSP applications. Debugging issues further adds to the complexity, as troubleshooting intricate DSP systems requires a deep understanding of the hardware-software interplay, contributing to longer development cycles and higher costs.

Digital Signal Processor Ecosystem

Digital Signal Processor Market by Ecosystem

Multi Core DSP segment to hold the largest market share in the Core segment in the Digital Signal Processor market during the forecast period.

Multi-Core Digital Signal Processors (MC-DSPs) are crucial components in industrial automation, particularly for achieving precise motor control in robotics and conducting real-time sensor data analysis for autonomous decision-making processes. They are instrumental in ensuring robots can execute tasks with accuracy and repeatability by managing motor speed, torque, and positioning in real time, while also processing data from various sensors like encoders, accelerometers, and proximity sensors. This real-time data analysis enables robots to dynamically respond to changes in their environment, enhancing efficiency. MC-DSPs also play a significant role in high-speed control of machinery and processes, handling complex algorithms necessary for tasks like trajectory planning, path optimization, and synchronization of multiple actuators or axes. This capability is critical for maintaining production efficiency and smooth operation in automated systems.

Mid-range DSP segment to hold the largest market share in the Configuration segment in the Digital Signal Processor market during the forecast period.

Mid-range DSPs are essential components in home theatre systems, significantly enhancing the audio experience by employing advanced signal processing techniques. These DSPs excel in tasks such as room correction, where they analyse room acoustics using a test microphone and apply digital filters to compensate for frequency response irregularities, resulting in a more balanced sound. Additionally, mid-range DSPs optimize speaker performance by implementing electronic crossovers and distance correction, ensuring that audio signals are directed accurately for a cohesive soundstage. They also offer sound enhancement features like virtualization for wider soundscapes, dynamic range control for balanced volume levels, and night mode for quieter listening without compromising clarity. With user-friendly controls allowing for customization of presets, EQ settings, and individual speaker levels, mid-range DSPs empower users to tailor their audio experience to their preferences and listening environments. These DSPs bring benefits such as improved sound quality, enhanced immersion, customizable listening experiences, and simplified setup processes, making them indispensable for crafting a cinematic audio environment in home theatres.

Floating-point digital signal processors (DSPs) segment to hold the largest market share in the category segment in the Digital Signal Processor market during the forecast period.

The demand for real-time processing capabilities in applications like radar signal processing, autonomous vehicles, and medical imaging is a significant driver for the growth of the floating-point DSP market. For instance, in radar signal processing, floating-point DSPs enable swift and accurate execution of algorithms for target detection, tracking, and classification, ensuring timely response to changing scenarios. Similarly, in autonomous vehicles, these processors facilitate real-time decision-making by processing sensor data for tasks like object detection, path planning, and collision avoidance.     

General-purpose digital signal processors (DSPs) segment to hold the largest market share in the type segment in the Digital Signal Processor market during the forecast period.

General-purpose DSPs serve as versatile solutions capable of handling a broad range of signal processing tasks across various domains. Their flexibility makes them indispensable in applications such as telecommunications, audio processing, image processing, and beyond. The driving factors behind the demand for general-purpose DSPs include the increasing need for enhanced computational power, real-time processing capabilities, and efficiency across industries. Additionally, the proliferation of digital technologies and the demand for advanced signal processing functionalities contribute to the growth of this segment.

Embedded segment to hold the largest market share in the IC Design segment in the Digital Signal Processor market during the forecast period.

Embedded Integrated Circuits (ICs) serve as valuable companions to Digital Signal Processors (DSPs), enhancing their capabilities in various applications. DSPs, specialized microprocessors, excel at manipulating digital signals representing real-world phenomena. Embedded ICs, being application-specific circuits integrated onto a single chip, complement DSPs by handling tasks like memory management, peripheral interfacing, or low-power operations. This offloading of tasks improves overall system efficiency, freeing up DSP resources for core signal processing tasks. Embedded ICs also contribute increased functionality to systems, such as analog-to-digital conversion (ADC) or digital-to-analog conversion (DAC), expanding the DSP's capabilities. Modern designs often integrate DSPs and specific embedded ICs into System-on-a-Chip (SoC) solutions, enhancing compactness and efficiency. Examples of applications benefiting from this synergy include mobile phones, noise-cancelling headphones, medical imaging equipment, and industrial control systems. The ongoing trend towards SoCs further streamlines DSP designs, reducing reliance on separate embedded ICs for certain functionalities and emphasizing integrated solutions for enhanced performance and miniaturization.

Audio Processing segment in Application to hold the highest market share of the Digital Signal Processor market during the forecast period

 DSP is crucial for various functions in audio products. It enables tasks like analog-to-digital conversion, noise cancellation, digital equalization, and automated adjustments for optimal sound performance. For example, DSP chips in headphones can cancel out background noise to improve audio clarity, or they can amplify ambient sounds for enhanced situational awareness, as seen in features like Apple's Transparency Mode. The quality of the DSP chip and the algorithms it runs directly impact the user experience, especially in areas like noise cancellation efficiency and sound customization features. Users should consider the type and quality of DSP technology present in audio products before making purchasing decisions to ensure they get the desired audio performance and functionality, particularly if they prioritize features like advanced equalization settings or noise cancellation capabilities.

Consumer electronics segment in end-user industry to hold the highest market share of the Digital Signal Processor market during the forecast period

Companies in the consumer electronics sector are actively taking initiatives to leverage DSP capabilities for these driving factors. They invest in research and development to enhance DSP functionalities, integrate them seamlessly into their product offerings, and optimize performance to meet evolving consumer expectations. Additionally, gaming in consumer electronics extensively utilizes DSPs for audio processing, spatial effects, and real-time performance enhancements, with companies developing specialized DSP solutions and software algorithms to deliver immersive gaming experiences. Overall, the proactive approach of companies in integrating DSPs and driving innovation across audio, video, gaming, and connectivity aspects reinforces the significance of DSPs in shaping the future of consumer electronics.

The Digital Signal Processor market in the Asia Pacific is estimated to grow at a higher CAGR during the forecast period.

The Asia Pacific (APAC) region is experiencing a remarkable surge in the adoption of smart home devices and the manufacturing of consumer electronics, significantly impacting the Digital Signal Processor (DSP) market. This growth trajectory is propelled by factors such as increasing disposable incomes, urbanization, and heightened awareness of smart home technology, will accelerate the market growth. This surge in smart home adoption translates into a rising demand for various smart devices across safety, energy control, climate management, lighting, and voice-enabled categories, each heavily reliant on DSPs for critical functionalities like noise cancellation, image processing, and motor control. Moreover, the APAC region has emerged as a global manufacturing hub for consumer electronics, hosting major players like Samsung, LG, Sony, and Haier, integrating advanced features such as high-resolution displays, immersive sound systems, and AI capabilities into their products, all of which necessitate powerful DSPs for tasks like video processing, audio enhancement, and real-time signal processing for voice assistants. This increasing adoption of smart home devices and advanced features in consumer electronics is driving a robust demand for DSPs in the APAC region, characterized by their superior performance, energy efficiency, real-time processing capabilities, and flexibility for customization, positioning DSPs as integral components in powering the ongoing digital transformation across smart homes and consumer electronics in APAC.

Digital Signal Processor Market by Region

Digital Signal Processor Market by Region

To know about the assumptions considered for the study, download the pdf brochure

Top Digital Signal Processor Companies - Key Market Manufacture :

Major vendors in the Digital Signal Processor companies include are Analog Devices, Inc. (US), Microchip Technology Inc. (US), Texas Instruments Incorporated (US), NXP Semiconductors (Netherlands), Marvell (US), Qualcomm Technologies, Inc. (US), Cirrus Logic, Inc. (US), STMicroelectronics (Switzerland), TOSHIBA ELECTRONIC DEVICES & STORAGE CORPORATION (Japan), Infineon Technologies AG (Germany), and Broadcom (US) among others.

Apart from this, Renesas Electronics Corporation (Japan), Asahi Kasei Microdevices Corporation (Japan), MediaTek Inc. (Taiwan), Cadence Design Systems, Inc. (US), ONSemi (US), Ceva, Inc. (UK), Biamp (US), Dayton Audio (US), NST Audio (UK), VeriSilicon (China), Knowles Electronics, LLC. (US), Kramer (Israel), AUDIOCONTROL (US), Crestron Electronics, Inc. (US), and EFFECT PHOTONICS (Netherlands)  are among a few emerging companies in the Digital Signal Processor market.

Digital Signal Processor Report Scope :

Report Metric

Details

Estimated Market Size USD  10.1 billion in 2024
Projected Market Size USD  14.7 billion by 2029
Growth Rate  At CAGR of 7.8%

Market size available for years

2020—2029

Base year

2023

Forecast period

2024—2029

Segments covered

  • By Type,
  • By Category,
  • By Core,
  • By Configuration,
  • By IC Design,
  • By Application,
  • By End-User Industry, and Region

Geographic regions covered

  • North America,
  • Europe,
  • Asia Pacific, and RoW

Companies covered

The major players include Analog Devices, Inc. (US), Microchip Technology Inc. (US), Texas Instruments Incorporated (US), NXP Semiconductors (Netherlands), Marvell (US), Qualcomm Technologies, Inc. (US), Cirrus Logic, Inc. (US), STMicroelectronics (Switzerland), TOSHIBA ELECTRONIC DEVICES & STORAGE CORPORATION (Japan), Infineon Technologies AG (Germany), and Broadcom (US). and Others- total 26 players have been covered.

Digital Signal Processor Market Highlights

This research report categorizes the Digital Signal Processor  market Type, Category, Core, Configuration, IC Design, Application, End-User Industry, and Region.

Segment

Subsegment

By Core:

  • Single Core DSPs
  • Multi-Core DSPs

By Configuration:

  • Low-end DSP
  • Mid-range DSP
  • High-end DSP

By Type:

  • General-purpose DSPs
  • Application-specific DSPs
  • Programmable DSP

By Category:

  • Fixed Point
  • Floating Point

By IC Design:

  • Standard
  • Embedded

By Application:

  • Audio processing
    • Consumer Electronics
    • Professional Audio Equipment
    • Television and Radio Broadcasting
    • Others
  • Video Processing
  • Image Processing
  • Speech Processing & Recognition
  • Radar Systems
  • Communication Systems
  • Others

By End-User Industry:

  • Consumer Electronics
  • Automotive
  • Industrial Automation
  • Communication & Networking
  • Healthcare
  • Aerospace & Defense
  • Others

By Region:

  • North America
    • US
    • Canada
    • Mexico
  • Europe
    • UK
    • Germany
    • France
    • Italy
    • Rest of Europe
  • Asia Pacific
    • Japan
    • China
    • South Korea
    • India
    • Rest of Asia Pacific
  • Rest of the World (RoW)
    • Middle East
      • GCC
      • Rest of Middle East
    • Africa
    • South America

Recent Developments in Digital Signal Processor Industry :

  • In March 2024, Marvell announced the industry’s first 1.6T PAM4 optical DSP, Nova 2, featuring 200 Gbps electrical and optical interfaces for accelerated infrastructure and AI/ML systems. Nova 2, along with the flagship Nova, addresses the escalating performance demands of cloud infrastructure, generative AI, and high-performance computing. Nova 2 enables the development of industry-standard optical modules with 2x more bandwidth than current modules, doubling network traffic capacity and paving the way for 200G interfaces in accelerated infrastructure.
  • In April 2024, Microchip Technology Inc. completed the acquisition of VSI Co. Ltd., integrating ASA Motion Link technology into its automotive networking portfolio. This move aimed to enhance Microchip's position in the rapidly growing market for ADAS and digital cockpit connectivity, aligning with industry standards and facilitating the development of next-generation software-defined vehicles.

Key Questions Addressed in the Report:

To speak to our analyst for a discussion on the above findings, click Speak to Analyst

TABLE OF CONTENTS
 
1 INTRODUCTION (Page No. - 37)
    1.1 STUDY OBJECTIVES 
    1.2 MARKET DEFINITION 
    1.3 STUDY SCOPE 
           1.3.1 MARKETS COVERED
                    FIGURE 1 DIGITAL SIGNAL PROCESSOR MARKET SEGMENTATION
           1.3.2 INCLUSIONS AND EXCLUSIONS
           1.3.3 REGIONAL SCOPE
           1.3.4 YEARS CONSIDERED
    1.4 CURRENCY CONSIDERED 
    1.5 UNITS CONSIDERED 
    1.6 LIMITATIONS 
    1.7 STAKEHOLDERS 
    1.8 SUMMARY OF CHANGES 
    1.9 IMPACT OF RECESSION 
           FIGURE 2 GDP GROWTH PROJECTION FOR MAJOR ECONOMIES TILL 2023
 
2 RESEARCH METHODOLOGY (Page No. - 44)
    2.1 RESEARCH DATA 
           FIGURE 3 DIGITAL SIGNAL PROCESSOR MARKET: RESEARCH DESIGN
           2.1.1 SECONDARY DATA
                    2.1.1.1 List of key secondary sources
                    2.1.1.2 Key data from secondary sources
           2.1.2 PRIMARY DATA
                    2.1.2.1 List of primary interview participants
                    2.1.2.2 Key data from primary sources
                    2.1.2.3 Key industry insights
                    2.1.2.4 Breakdown of primaries
           2.1.3 SECONDARY AND PRIMARY RESEARCH
                    FIGURE 4 DIGITAL SIGNAL PROCESSOR MARKET: SECONDARY AND PRIMARY RESEARCH
    2.2 MARKET SIZE ESTIMATION METHODLOGY 
           FIGURE 5 DIGITAL SIGNAL PROCESSOR MARKET: PROCESS FLOW OF MARKET SIZE ESTIMATION
           2.2.1 TOP-DOWN APPROACH
                    2.2.1.1 Approach to derive market size using top-down analysis (supply side)
                               FIGURE 6 MARKET: TOP-DOWN APPROACH
                               FIGURE 7 MARKET SIZE ESTIMATION METHODOLOGY
           2.2.2 BOTTOM-UP APPROACH
                    2.2.2.1 Approach to derive market size using bottom-up analysis (demand side)
                               FIGURE 8 MARKET: BOTTOM-UP APPROACH
    2.3 DATA TRIANGULATION 
           FIGURE 9 MARKET: DATA TRIANGULATION
    2.4 RESEARCH ASSUMPTIONS 
           FIGURE 10  MARKET: RESEARCH ASSUMPTIONS
    2.5 RISK ASSESSMENT 
    2.6 PARAMETERS CONSIDERED TO ANALYZE RECESSION IMPACT ON DIGITAL SIGNAL PROCESSOR MARKET 
    2.7 RESEARCH LIMITATIONS 
           FIGURE 11 DIGITAL SIGNAL PROCESSOR MARKET: RESEARCH LIMITATIONS
 
3 EXECUTIVE SUMMARY (Page No. - 57)
    FIGURE 12 MULTI-CORE SEGMENT TO EXHIBIT HIGHER CAGR DURING FORECAST PERIOD
    FIGURE 13 MID-RANGE CONFIGURATION TO DOMINATE MARKET FROM 2024 TO 2029
    FIGURE 14 APPLICATION-SPECIFIC DSPS TO RECORD HIGHEST CAGR BETWEEN 2024 AND 2029
    FIGURE 15 FLOATING-POINT CATEGORY TO REGISTER HIGHER CAGR DURING FORECAST PERIOD
    FIGURE 16 EMBEDDED IC DESIGN TO ACCOUNT FOR LARGER MARKET SHARE IN 2029
    FIGURE 17 AUDIO PROCESSING APPLICATION TO DOMINATE MARKET FROM 2024 TO 2029
    FIGURE 18 HEALTHCARE INDUSTRY TO RECORD HIGHEST CAGR IN MARKET DURING FORECAST PERIOD
    FIGURE 19 ASIA PACIFIC HELD LARGEST SHARE OF GLOBAL DIGITAL SIGNAL PROCESSOR MARKET IN 2023
 
4 PREMIUM INSIGHTS (Page No. - 65)
    4.1 ATTRACTIVE OPPORTUNITIES FOR PLAYERS IN DIGITAL SIGNAL PROCESSOR MARKET 
           FIGURE 20 RISING AUTOMATION AND INTEGRATION OF SAFETY FEATURES INTO AUTOMOBILES TO DRIVE MARKET
    4.2 MARKET, BY CORE 
           FIGURE 21 MULTI-CORE SEGMENT TO ACCOUNT FOR LARGER MARKET SHARE IN 2029
    4.3  MARKET, BY CONFIGURATION 
           FIGURE 22 MID-RANGE SEGMENT TO RECORD HIGHEST CAGR IN MARKET, BY CONFIGURATION, DURING FORECAST PERIOD
    4.4 MARKET, BY TYPE 
           FIGURE 23 GENERAL-PURPOSE SEGMENT TO HOLD LARGEST SHARE OF DIGITAL SIGNAL PROCESSOR MARKET, BY TYPE, IN 2024
    4.5 MARKET, BY CATEGORY 
           FIGURE 24 FLOATING-POINT CATEGORY TO EXHIBIT HIGHER CAGR DURING FORECAST PERIOD
    4.6 MARKET, BY IC DESIGN 
           FIGURE 25 EMBEDDED SEGMENT TO DOMINATE MARKET FROM 2024 TO 2029
    4.7 DIGITAL SIGNAL PROCESSOR MARKET, BY APPLICATION 
           FIGURE 26 SPEECH PROCESSING & RECOGNITION APPLICATION TO RECORD HIGHEST CAGR DURING FORECAST PERIOD
    4.8 MARKET, BY END-USER INDUSTRY 
           FIGURE 27 CONSUMER ELECTRONICS INDUSTRY TO HOLD LARGEST SHARE OF DIGITAL SIGNAL PROCESSOR MARKET IN 2024
    4.9 MARKET, BY COUNTRY 
           FIGURE 28 MARKET IN INDIA TO GROW AT HIGHEST CAGR DURING FORECAST PERIOD
 
5 MARKET OVERVIEW (Page No. - 70)
    5.1 INTRODUCTION 
    5.2 MARKET DYNAMICS 
           FIGURE 29 DIGITAL SIGNAL PROCESSOR MARKET: DRIVERS, RESTRAINTS, OPPORTUNITIES, AND CHALLENGES
           5.2.1 DRIVERS
                    5.2.1.1 Surging adoption of Internet of Things (IoT) and connected devices
                               FIGURE 30 GLOBAL IOT MARKET FORECAST, 2019–2027
                    5.2.1.2 Increasing trend of digital signal processing in automotive industry
                               FIGURE 31 REGISTERED VEHICLES EQUIPPED WITH ADAS, 2020 AND 2026
                    5.2.1.3 Improvements in 5G technology and development of advanced communication infrastructure
                               FIGURE 32 Y-0-Y GROWTH OF GLOBAL 5G CONNECTIONS, Q4 2021–Q4 2022
                    5.2.1.4 Rising demand for Voice over Internet Protocol (VoIP) and Internet Protocol (IP) video services
                               FIGURE 33 IMPACT ANALYSIS: DRIVERS
           5.2.2 RESTRAINTS
                    5.2.2.1 High designing and manufacturing costs
                    5.2.2.2 Limited processing power than GPUs and CPUs
                                     FIGURE 34 IMPACT ANALYSIS: RESTRAINTS
           5.2.3 OPPORTUNITIES
                    5.2.3.1 Increasing demand for DSP chips in consumer electronics industry
                    5.2.3.2 Integration of Al and ML technologies into DSP architectures
                    5.2.3.3 Requirement for high-performance audio and video processing in media & entertainment industry
                    5.2.3.4 Rising demand for DSPs in industrial automation and robotics fields
                               FIGURE 35 IMPACT ANALYSIS: OPPORTUNITIES
           5.2.4 CHALLENGES
                    5.2.4.1 Implementation complexities and security concerns associated with DSPs
                    5.2.4.2 Challenges associated with rapidly evolving technological landscape and standards
                               FIGURE 36 IMPACT ANALYSIS: CHALLENGES
    5.3 TRENDS/DISRUPTIONS IMPACTING CUSTOMERS’ BUSINESSES 
           FIGURE 37 TRENDS/DISRUPTIONS IMPACTING CUSTOMERS’ BUSINESSES
    5.4 PRICING ANALYSIS 
           5.4.1 AVERAGE SELLING PRICE (ASP) TREND OF KEY PLAYERS, BY CORE
                    FIGURE 38 AVERAGE SELLING PRICE (ASP) TREND OF DSPS OFFERED BY KEY PLAYERS, BY CORE (USD)
                    FIGURE 39 INDICATIVE PRICING TREND OF DSPS, 2020–2023 (USD MILLION)
                    TABLE 1 AVERAGE SELLING PRICE (ASP) TREND OF DSPS OFFERED BY KEY PLAYERS, BY CORE (USD)
           5.4.2 AVERAGE SELLING PRICE (ASP) TREND, BY REGION
                    FIGURE 40 AVERAGE SELLING PRICE (ASP) TREND OF SINGLE-CORE DSPS, BY REGION, 2020–2023 (USD)
                    FIGURE 41 AVERAGE SELLING PRICE (ASP) TREND OF MULTI-CORE DSPS, BY REGION, 2020–2023 (USD)
    5.5 VALUE CHAIN ANALYSIS 
           FIGURE 42 DIGITAL SIGNAL PROCESSOR MARKET: VALUE CHAIN ANALYSIS
    5.6 ECOSYSTEM ANALYSIS 
           FIGURE 43 KEY PARTICIPANTS IN DIGITAL SIGNAL PROCESSOR ECOSYSTEM
           TABLE 2 ROLE OF COMPANIES IN DIGITAL SIGNAL PROCESSOR ECOSYSTEM
    5.7 INVESTMENT AND FUNDING SCENARIO 
           FIGURE 44 INVESTMENT AND FUNDING SCENARIO OF START-UPS, 2020–2023 (USD MILLION)
    5.8 TECHNOLOGY ANALYSIS 
           5.8.1 KEY TECHNOLOGIES
                    5.8.1.1 Very-long instruction word (VLIW) architectures
                    5.8.1.2 Multi-core architectures
           5.8.2 COMPLEMENTARY TECHNOLOGIES
                    5.8.2.1 High-speed data connectivity technologies
                    5.8.2.2 Analog-to-digital converters (ADCs) and digital-to-analog converters (DACs)
           5.8.3 ADJACENT TECHNOLOGIES
                    5.8.3.1 Artificial Intelligence (AI)
                    5.8.3.2 Internet of Things (IoT)
    5.9 PATENT ANALYSIS 
           TABLE 3 LIST OF PATENTS, 2016–2022
           FIGURE 45 PATENTS APPLIED AND GRANTED, 2014–2024
    5.10 TRADE ANALYSIS 
           5.10.1 IMPORT SCENARIO (HS CODE 854231)
                    FIGURE 46 IMPORT DATA FOR HS CODE 854231-COMPLIANT PRODUCTS, BY COUNTRY, 2019–2023 (USD MILLION)
           5.10.2 EXPORT SCENARIO (HS CODE 854231)
                    FIGURE 47 EXPORT DATA FOR HS CODE 854231-COMPLIANT PRODUCTS, BY COUNTRY, 2019–2023 (USD MILLION)
    5.11 KEY CONFERENCES AND EVENTS, 2024–2026 
           TABLE 4 DIGITAL SIGNAL PROCESSOR MARKET: LIST OF KEY CONFERENCES AND EVENTS, 2024–2026
    5.12 CASE STUDY ANALYSIS 
           5.12.1 MISTRAL SOLUTIONS OPTIMIZES POWER MANAGEMENT AND OPTICAL LINKS FOR COMMUNICATION AT DEFENSE LAB WITH AIR-COOLED DSPS
           5.12.2 DSP CENTRE OF EXCELLENCE ACCELERATES NETWORKS AND BOOSTS RESOURCE SHARING WITH CUTTING-EDGE DSP TECHNOLOGIES
           5.12.3 SMART FARM PROJECT ENHANCES SPECIES MONITORING AND MANAGEMENT WITH MESH NETWORK AND DSP ALGORITHMS
           5.12.4 ABC HEALTHCARE SOLUTIONS TRANSFORMS HEALTHCARE USING DSP-INTEGRATED MACHINE LEARNING TECHNIQUES
           5.12.5 XYZ ENTERPRISES LEVERAGES DSP SERVICES TO DEVELOP COMPREHENSIVE SOLUTIONS AND EHANCE BIG DATA ANALYTICS CAPABILITIES
    5.13 REGULATORY LANDSCAPE 
           5.13.1 REGULATORY BODIES, GOVERNMENT AGENCIES, AND OTHER ORGANIZATIONS
                    TABLE 5 NORTH AMERICA: LIST OF REGULATORY BODIES, GOVERNMENT AGENCIES, AND OTHER ORGANIZATIONS
                    TABLE 6 EUROPE: LIST OF REGULATORY BODIES, GOVERNMENT AGENCIES, AND OTHER ORGANIZATIONS
                    TABLE 7 ASIA PACIFIC: LIST OF REGULATORY BODIES, GOVERNMENT AGENCIES, AND OTHER ORGANIZATIONS
                    TABLE 8 ROW: LIST OF REGULATORY BODIES, GOVERNMENT AGENCIES, AND OTHER ORGANIZATIONS
           5.13.2 STANDARDS
                    TABLE 9 NORTH AMERICA: SAFETY STANDARDS
                    TABLE 10 EUROPE: SAFETY STANDARDS
                    TABLE 11 ASIA PACIFIC: SAFETY STANDARDS
                    TABLE 12 ROW: SAFETY STANDARDS
    5.14 PORTER’S FIVE FORCES ANALYSIS 
           TABLE 13 PORTER’S FIVE FORCES ANALYSIS
           FIGURE 48 PORTER’S FIVE FORCES ANALYSIS
           5.14.1 THREAT OF NEW ENTRANTS
           5.14.2 THREAT OF SUBSTITUTES
           5.14.3 BARGAINING POWER OF SUPPLIERS
           5.14.4 BARGAINING POWER OF BUYERS
           5.14.5 INTENSITY OF COMPETITIVE RIVALRY
    5.15 KEY STAKEHOLDERS AND BUYING CRITERIA 
           5.15.1 KEY STAKEHOLDERS IN BUYING PROCESS
                    FIGURE 49 INFLUENCE OF STAKEHOLDERS ON BUYING PROCESS FOR TOP THREE END-USER INDUSTRIES
                    TABLE 14 INFLUENCE OF STAKEHOLDERS ON BUYING PROCESS FOR TOP THREE END-USER INDUSTRIES (%)
           5.15.2 BUYING CRITERIA
                    FIGURE 50 KEY BUYING CRITERIA FOR TOP THREE END-USER INDUSTRIES
                    TABLE 15 KEY BUYING CRITERIA FOR TOP THREE END-USER INDUSTRIES
 
6 DIGITAL SIGNAL PROCESSOR MARKET, BY CORE (Page No. - 118)
    6.1 INTRODUCTION 
           FIGURE 51 MULTI-CORE DSPS TO ACCOUNT FOR LARGER MARKET SHARE IN 2029
           TABLE 16 MARKET, BY CORE, 2020–2023 (USD MILLION)
           TABLE 17 MARKET, BY CORE, 2024–2029 (USD MILLION)
           TABLE 18 MARKET, BY CORE, 2020–2023 (MILLION UNITS)
           TABLE 19 MARKET, BY CORE, 2024–2029 (MILLION UNITS)
    6.2 SINGLE-CORE 
           6.2.1 SIMPLICITY AND COST-EFFECTIVENESS TO CONTRIBUTE TO SEGMENTAL GROWTH
                    TABLE 20 SINGLE-CORE: DIGITAL SIGNAL PROCESSOR MARKET, BY APPLICATION, 2020–2023 (USD MILLION)
                    TABLE 21 SINGLE-CORE: MARKET, BY APPLICATION, 2024–2029 (USD MILLION)
                    TABLE 22 SINGLE-CORE: MARKET FOR AUDIO PROCESSING, BY TYPE, 2020–2023 (USD MILLION)
                    TABLE 23 SINGLE-CORE: MARKET FOR AUDIO PROCESSING, BY TYPE, 2024–2029 (USD MILLION)
    6.3 MULTI-CORE 
           6.3.1 REQUIREMENT FOR ADVANCED FEATURES AND FUNCTIONALITIES IN NEXT-GENERATION VEHICLES TO FUEL SEGMENTAL GROWTH
                    TABLE 24 MULTI-CORE: DIGITAL SIGNAL PROCESSOR MARKET, BY APPLICATION, 2020–2023 (USD MILLION)
                    TABLE 25 MULTI-CORE: MARKET, BY APPLICATION, 2024–2029 (USD MILLION)
                    TABLE 26 MULTI-CORE: MARKET FOR AUDIO PROCESSING, BY TYPE, 2020–2023 (USD MILLION)
                    TABLE 27 MULTI-CORE: MARKET FOR AUDIO PROCESSING, BY TYPE, 2024–2029 (USD MILLION)
 
7 DIGITAL SIGNAL PROCESSOR MARKET, BY CONFIGURATION (Page No. - 127)
    7.1 INTRODUCTION 
           TABLE 28 PARAMETERS CONSIDERED TO DIFFERENTIATE DSPS BASED ON CONFIGURATION
           FIGURE 52 HIGH-END SEGMENT TO EXHIBIT HIGHEST CAGR IN MARKET, BY CONFIGURATION, DURING FORECAST PERIOD
           TABLE 29 DIGITAL SIGNAL PROCESSOR MARKET, BY CONFIGURATION, 2020–2023 (USD MILLION)
           TABLE 30  MARKET, BY CONFIGURATION, 2024–2029 (USD MILLION)
    7.2 LOW-END 
           7.2.1 USE IN LOW-POWER, COMPLEX MATHEMATICAL OPERATIONS TO FOSTER SEGMENTAL GROWTH
                    TABLE 31 LOW-END: MARKET, BY END-USER INDUSTRY, 2020–2023 (USD MILLION)
                    TABLE 32 LOW-END: MARKET, BY END-USER INDUSTRY, 2024–2029 (USD MILLION)
    7.3 MID-RANGE 
           7.3.1 ADOPTION TO UPGRADE AUDIO IN AUTOMOTIVE AFTERMARKET SYSTEMS TO EXPEDITE SEGMENTAL GROWTH
                    TABLE 33 MID-RANGE: MARKET, BY END-USER INDUSTRY, 2020–2023 (USD MILLION)
                    TABLE 34 MID-RANGE: MARKET, BY END-USER INDUSTRY, 2024–2029 (USD MILLION)
    7.4 HIGH-END 
           7.4.1 IMPLEMENTATION IN MEDICAL IMAGING AND HIGH-PERFORMANCE COMPUTING TASKS TO FACILITATE SEGMENTAL GROWTH
                    TABLE 35 HIGH-END: MARKET, BY END-USER INDUSTRY, 2020–2023 (USD MILLION)
                    TABLE 36 HIGH-END: MARKET, BY END-USER INDUSTRY, 2024–2029 (USD MILLION)
 
8 DIGITAL SIGNAL PROCESSING MARKET, BY TYPE (Page No. - 135)
    8.1 INTRODUCTION 
           FIGURE 53 APPLICATION-SPECIFIC DSPS TO RECORD HIGHEST CAGR IN DIGITAL SIGNAL PROCESSOR MARKET DURING FORECAST PERIOD
           TABLE 37 DIGITAL SIGNAL PROCESSOR MARKET, BY TYPE, 2020–2023 (USD MILLION)
           TABLE 38 MARKET, BY TYPE, 2024–2029 (USD MILLION)
    8.2 GENERAL-PURPOSE DSPS 
           8.2.1 NEED TO HANDLE DIVERSE SIGNAL PROCESSING ALGORITHMS AND TASKS TO BOOST SEGMENTAL GROWTH
                    TABLE 39 GENERAL-PURPOSE DSPS: MARKET, BY REGION, 2020–2023 (USD MILLION)
                    TABLE 40 GENERAL-PURPOSE DSPS: MARKET, BY REGION, 2024–2029 (USD MILLION)
    8.3 APPLICATION-SPECIFIC DSPS 
           8.3.1 RAPID DIGITAL TRANSFORMATION IN AUTOMOTIVE AND HEALTHCARE SECTORS TO AUGMENT SEGMENTAL GROWTH
                    TABLE 41 APPLICATION-SPECIFIC DSPS: DIGITAL SIGNAL PROCESSOR MARKET, BY REGION, 2020–2023 (USD MILLION)
                    TABLE 42 APPLICATION-SPECIFIC DSPS: MARKET, BY REGION, 2024–2029 (USD MILLION)
    8.4 PROGRAMMABLE DSPS 
           8.4.1 ADOPTION OF ADVANCED TECHNOLOGIES FOR TELECOM AND MULTIMEDIA PROCESSING TO PROPEL MARKET
                    TABLE 43 PROGRAMMABLE DSPS: MARKET, BY REGION, 2020–2023 (USD MILLION)
                    TABLE 44 PROGRAMMABLE DSPS: MARKET, BY REGION, 2024–2029 (USD MILLION)
 
9 DIGITAL SIGNAL PROCESSING MARKET, BY CATEGORY (Page No. - 142)
    9.1 INTRODUCTION 
           FIGURE 54 FLOATING-POINT CATEGORY TO DOMINATE MARKET FROM 2024 TO 2029
           TABLE 45 DIGITAL SIGNAL PROCESSOR MARKET, BY CATEGORY, 2020–2023 (USD MILLION)
           TABLE 46 MARKET, BY CATEGORY, 2024–2029 (USD MILLION)
    9.2 FIXED-POINT 
           9.2.1 RESOURCE EFFICIENCY AND COST-EFFECTIVENESS IN CONSUMER ELECTRONICS APPLICATIONS TO FUEL SEGMENTAL GROWTH
                    TABLE 47 FIXED-POINT: MARKET, BY END-USER INDUSTRY, 2020–2023 (USD MILLION)
                    TABLE 48 FIXED-POINT: MARKET, BY END-USER INDUSTRY, 2024–2029 (USD MILLION)
    9.3 FLOATING-POINT 
           9.3.1 USE TO ADDRESS COMPUTATIONAL REQUIREMENTS OF MODERN SIGNAL PROCESSING ALGORITHMS TO DRIVE MARKET
                    TABLE 49 FLOATING-POINT: MARKET, BY END-USER INDUSTRY, 2020–2023 (USD MILLION)
                    TABLE 50 FLOATING-POINT: MARKET, BY END-USER INDUSTRY, 2024–2029 (USD MILLION)
 
10 DIGITAL SIGNAL PROCESSOR MARKET, BY IC DESIGN (Page No. - 148)
     10.1 INTRODUCTION 
             FIGURE 55 EMBEDDED SEGMENT TO ACCOUNT FOR LARGER SHARE OF MARKET, BY IC DESIGN, IN 2029
             TABLE 51 DIGITAL SIGNAL PROCESSOR MARKET, BY IC DESIGN, 2020–2023 (USD MILLION)
             TABLE 52  MARKET, BY IC DESIGN, 2024–2029 (USD MILLION)
     10.2 STANDARD 
             10.2.1 REQUIREMENT FOR COST-EFFECTIVE AND POWER-EFFICIENT COMPONENTS FOR CONSUMER ELECTRONICS TO FACILITATE SEGMENTAL GROWTH
     10.3 EMBEDDED 
             10.3.1 USE IN PERIPHERAL INTERFACING AND LOW-POWER OPERATIONS TO ACCELERATE SEGMENTAL GROWTH
 
11 DIGITAL SIGNAL PROCESSOR MARKET, BY APPLICATION (Page No. - 152)
     11.1 INTRODUCTION 
           FIGURE 56 SPEECH PROCESSING & RECOGNITION SEGMENT TO RECORD HIGHEST CAGR IN DIGITAL SIGNAL PROCESSOR MARKET, BY APPLICATION, DURING FORECAST PERIOD
           TABLE 53 MARKET, BY APPLICATION, 2020–2023 (USD MILLION)
           TABLE 54 MARKET, BY APPLICATION, 2024–2029 (USD MILLION)
     11.2 AUDIO PROCESSING 
             TABLE 55 AUDIO PROCESSING: MARKET, BY TYPE, 2020–2023 (USD MILLION)
             TABLE 56 AUDIO PROCESSING:  MARKET, BY TYPE, 2024–2029 (USD MILLION)
             TABLE 57 AUDIO PROCESSING:  MARKET, BY CORE, 2020–2023 (USD MILLION)
             TABLE 58 AUDIO PROCESSING: MARKET, BY CORE, 2024–2029 (USD MILLION)
             TABLE 59 AUDIO PROCESSING: MARKET, BY END-USER INDUSTRY, 2020–2023 (USD MILLION)
             TABLE 60 AUDIO PROCESSING: MARKET, BY END-USER INDUSTRY, 2024–2029 (USD MILLION)
             11.2.1 CONSUMER ELECTRONICS
                        11.2.1.1 Growing installation of surround sound home theater systems to accelerate segmental growth
             11.2.2 PROFESSIONAL AUDIO EQUIPMENT
                        11.2.2.1 Increasing reliance on DSP architecture to handle complex algorithms to contribute to segmental growth
             11.2.3 TELEVISION & RADIO BROADCASTING
                        11.2.3.1 Rising integration of audio front-end technology into premium TVs to foster segmental growth
             11.2.4 OTHER AUDIO PROCESSING APPLICATIONS
     11.3 VIDEO PROCESSING 
             11.3.1 DEPLOYMENT OF DSPS TO ENABLE MOTION ESTIMATION AND COMPENSATION FOR SMOOTH VIDEO TRANSITION TO PROPEL MARKET
                        TABLE 61 VIDEO PROCESSING: MARKET, BY CORE, 2020–2023 (USD MILLION)
                        TABLE 62 VIDEO PROCESSING: DIGITAL SIGNAL PROCESSOR MARKET, BY CORE, 2024–2029 (USD MILLION)
                        TABLE 63 VIDEO PROCESSING: MARKET, BY END-USER INDUSTRY, 2020–2023 (USD MILLION)
                        TABLE 64 VIDEO PROCESSING: MARKET, BY END-USER INDUSTRY, 2024–2029 (USD MILLION)
     11.4 RADAR SYSTEMS 
             11.4.1 ADVANCEMENT IN MILITARY TECHNOLOGIES AND NAVIGATION SYSTEMS TO CONTRIBUTE TO SEGMENTAL GROWTH
                        TABLE 65 RADAR SYSTEMS: MARKET, BY CORE, 2020–2023 (USD MILLION)
                        TABLE 66 RADAR SYSTEMS: MARKET, BY CORE, 2024–2029 (USD MILLION)
                        TABLE 67 RADAR SYSTEMS: MARKET, BY END-USER INDUSTRY, 2020–2023 (USD MILLION)
                        TABLE 68 RADAR SYSTEMS: MARKET, BY END-USER INDUSTRY, 2024–2029 (USD MILLION)
     11.5 IMAGE PROCESSING 
             11.5.1 NEED FOR ACCURATE AND TIMELY INTERPRETATION OF VISUAL DATA IN AUTONOMOUS VEHICLES TO BOOST SEGMENTAL GROWTH
                        TABLE 69 IMAGE PROCESSING: MARKET, BY CORE, 2020–2023 (USD MILLION)
                        TABLE 70 IMAGE PROCESSING: MARKET, BY CORE, 2024–2029 (USD MILLION)
                        TABLE 71 IMAGE PROCESSING: ARKET, BY END-USER INDUSTRY, 2020–2023 (USD MILLION)
                        TABLE 72 IMAGE PROCESSING: MARKET, BY END-USER INDUSTRY, 2024–2029 (USD MILLION)
     11.6 SPEECH PROCESSING & RECOGNITION 
             11.6.1 ADOPTION OF NOISE REDUCTION TECHNIQUES TO REDUCE ERRORS IN FEATURE VECTORS AND PHONEMES TO FACILITATE SEGMENTAL GROWTH
                        TABLE 73 SPEECH PROCESSING & RECOGNITION: DIGITAL SIGNAL PROCESSOR MARKET, BY CORE, 2020–2023 (USD MILLION)
                        TABLE 74 SPEECH PROCESSING & RECOGNITION: MARKET, BY CORE, 2024–2029 (USD MILLION)
                        TABLE 75 SPEECH PROCESSING & RECOGNITION: MARKET, BY END-USER INDUSTRY, 2020–2023 (USD MILLION)
                        TABLE 76 SPEECH PROCESSING & RECOGNITION: MARKET, BY END-USER INDUSTRY, 2024–2029 (USD MILLION)
     11.7 COMMUNICATION SYSTEMS 
             11.7.1 ESTABLISHMENT OF 5G BASE STATIONS TO CONTRIBUTE TO SEGMENTAL GROWTH
                        TABLE 77 COMMUNICATION SYSTEMS: DIGITAL SIGNAL PROCESSOR MARKET, BY CORE, 2020–2023 (USD MILLION)
                        TABLE 78 COMMUNICATION SYSTEMS: MARKET, BY CORE, 2024–2029 (USD MILLION)
                        TABLE 79 COMMUNICATION SYSTEMS: MARKET, BY END-USER INDUSTRY, 2020–2023 (USD MILLION)
                        TABLE 80 COMMUNICATION SYSTEMS: MARKET, BY END-USER INDUSTRY, 2024–2029 (USD MILLION)
     11.8 OTHER APPLICATIONS 
             TABLE 81 OTHER APPLICATIONS: MARKET, BY CORE, 2020–2023 (USD MILLION)
             TABLE 82 OTHER APPLICATIONS: DIGITAL SIGNAL PROCESSOR MARKET, BY CORE, 2024–2029 (USD MILLION)
             TABLE 83 OTHER APPLICATIONS: MARKET, BY END-USER INDUSTRY, 2020–2023 (USD MILLION)
             TABLE 84 OTHER APPLICATIONS: MARKET, BY END-USER INDUSTRY, 2024–2029 (USD MILLION)
 
12 DIGITAL SIGNAL PROCESSOR MARKET, BY END-USER INDUSTRY (Page No. - 173)
     12.1 INTRODUCTION 
             FIGURE 57 HEALTHCARE INDUSTRY TO EXHIBIT HIGHEST CAGR IN DIGITAL SIGNAL PROCESSOR MARKET FROM 2024 TO 2029
             TABLE 85 MARKET, BY END-USER INDUSTRY, 2020–2023 (USD MILLION)
             TABLE 86 MARKET, BY END-USER INDUSTRY, 2024–2029 (USD MILLION)
     12.2 CONSUMER ELECTRONICS 
             12.2.1 RISING FOCUS ON DELIVERING IMMERSIVE GAMING EXPERIENCES TO ACCELERATE SEGMENTAL GROWTH
                        TABLE 87 CONSUMER ELECTRONICS: DIGITAL SIGNAL PROCESSOR MARKET, BY APPLICATION, 2020–2023 (USD MILLION)
                        TABLE 88 CONSUMER ELECTRONICS: MARKET, BY APPLICATION, 2024–2029 (USD MILLION)
                        TABLE 89 CONSUMER ELECTRONICS: MARKET, BY REGION, 2020–2023 (USD MILLION)
                        TABLE 90 CONSUMER ELECTRONICS: MARKET, BY REGION, 2024–2029 (USD MILLION)
                        TABLE 91 CONSUMER ELECTRONICS: MARKET, BY CONFIGURATION, 2020–2023 (USD MILLION)
                        TABLE 92 CONSUMER ELECTRONICS: MARKET, BY CONFIGURATION, 2024–2029 (USD MILLION)
                        TABLE 93 CONSUMER ELECTRONICS: MARKET, BY CATEGORY, 2020–2023 (USD MILLION)
                        TABLE 94 CONSUMER ELECTRONICS: DIGITAL SIGNAL PROCESSOR MARKET, BY CATEGORY, 2024–2029 (USD MILLION)
     12.3 AUTOMOTIVE 
             12.3.1 INCREASING NEED FOR REAL-TIME PROCESSING OF MODERN VEHICLE DATA TO FOSTER SEGMENTAL GROWTH
                        TABLE 95 AUTOMOTIVE: MARKET, BY APPLICATION 2020–2023 (USD MILLION)
                        TABLE 96 AUTOMOTIVE: MARKET, BY APPLICATION, 2024–2029 (USD MILLION)
                        TABLE 97 AUTOMOTIVE:  MARKET, BY REGION, 2020–2023 (USD MILLION)
                        TABLE 98 AUTOMOTIVE: MARKET, BY REGION, 2024–2029 (USD MILLION)
                        TABLE 99 AUTOMOTIVE: MARKET, BY CONFIGURATION, 2020–2023 (USD MILLION)
                        TABLE 100 AUTOMOTIVE:  MARKET, BY CONFIGURATION, 2024–2029 (USD MILLION)
                        TABLE 101 AUTOMOTIVE: MARKET, BY CATEGORY, 2020–2023 (USD MILLION)
                        TABLE 102 AUTOMOTIVE: MARKET, BY CATEGORY, 2024–2029 (USD MILLION)
     12.4 INDUSTRIAL AUTOMATION 
             12.4.1 GROWING EMPHASIS ON PRECISE NAVIGATION WITHIN DYNAMIC INDUSTRIAL ENVIRONMENTS TO BOOST SEGMENTAL GROWTH
                        TABLE 103 INDUSTRIAL AUTOMATION: DIGITAL SIGNAL PROCESSOR MARKET, BY APPLICATION, 2020–2023 (USD MILLION)
                        TABLE 104 INDUSTRIAL AUTOMATION: MARKET, BY APPLICATION, 2024–2029 (USD MILLION)
                        TABLE 105 INDUSTRIAL AUTOMATION: MARKET, BY REGION, 2020–2023 (USD MILLION)
                        TABLE 106 INDUSTRIAL AUTOMATION: MARKET, BY REGION, 2024–2029 (USD MILLION)
                        TABLE 107 INDUSTRIAL AUTOMATION: MARKET, BY CONFIGURATION, 2020–2023 (USD MILLION)
                        TABLE 108 INDUSTRIAL AUTOMATION:  MARKET, BY CONFIGURATION, 2024–2029 (USD MILLION)
                        TABLE 109 INDUSTRIAL AUTOMATION: MARKET, BY CATEGORY, 2020–2023 (USD MILLION)
                        TABLE 110 INDUSTRIAL AUTOMATION: MARKET, BY CATEGORY, 2024–2029 (USD MILLION)
     12.5 COMMUNICATION & NETWORKING 
             12.5.1 INCREASING INNOVATION IN SIGNAL PROCESSING TECHNOLOGIES TO BOLSTER SEGMENTAL GROWTH
                        TABLE 111 COMMUNICATION & NETWORKING: MARKET, BY APPLICATION, 2020–2023 (USD MILLION)
                        TABLE 112 COMMUNICATION & NETWORKING: MARKET, BY APPLICATION, 2024–2029 (USD MILLION)
                        TABLE 113 COMMUNICATION & NETWORKING: DIGITAL SIGNAL PROCESSOR MARKET, BY REGION, 2020–2023 (USD MILLION)
                        TABLE 114 COMMUNICATION & NETWORKING: MARKET, BY REGION, 2024–2029 (USD MILLION)
                        TABLE 115 COMMUNICATION & NETWORKING: MARKET, BY CONFIGURATION, 2020–2023 (USD MILLION)
                        TABLE 116 COMMUNICATION & NETWORKING: MARKET, BY CONFIGURATION, 2024–2029 (USD MILLION)
                        TABLE 117 COMMUNICATION & NETWORKING: MARKET, BY CATEGORY, 2020–2023 (USD MILLION)
                        TABLE 118 COMMUNICATION & NETWORKING: MARKET, BY CATEGORY, 2024–2029 (USD MILLION)
     12.6 HEALTHCARE 
             12.6.1 RISING ADOPTION OF IMAGE SIGNAL PROCESSORS IN MRI AND CT SCANS TO CONTRIBUTE TO SEGMENTAL GROWTH
                        TABLE 119 HEALTHCARE: MARKET, BY APPLICATION 2020–2023 (USD MILLION)
                        TABLE 120 HEALTHCARE: MARKET, BY APPLICATION, 2024–2029 (USD MILLION)
                        TABLE 121 HEALTHCARE: DIGITAL SIGNAL PROCESSOR MARKET, BY REGION, 2020–2023 (USD MILLION)
                        TABLE 122 HEALTHCARE: MARKET, BY REGION, 2024–2029 (USD MILLION)
                        TABLE 123 HEALTHCARE: MARKET, BY CONFIGURATION, 2020–2023 (USD MILLION)
                        TABLE 124 HEALTHCARE: MARKET, BY CONFIGURATION, 2024–2029 (USD MILLION)
                        TABLE 125 HEALTHCARE:  MARKET, BY CATEGORY, 2020–2023 (USD MILLION)
                        TABLE 126 HEALTHCARE: DIGITAL SIGNAL PROCESSOR MARKET, BY CATEGORY, 2024–2029 (USD MILLION)
     12.7 AEROSPACE & DEFENSE 
             12.7.1 INCREASING FOCUS ON ENABLING PRECISE MANEUVERS AND AUTOPILOT FUNCTIONALITY TO AUGMENT SEGMENTAL GROWTH
                        TABLE 127 AEROSPACE & DEFENSE:  MARKET, BY APPLICATION 2020–2023 (USD MILLION)
                        TABLE 128 AEROSPACE & DEFENSE: DIGITAL SIGNAL PROCESSOR MARKET, BY APPLICATION, 2024–2029 (USD MILLION)
                        TABLE 129 AEROSPACE & DEFENSE: MARKET, BY REGION, 2020–2023 (USD MILLION)
                        TABLE 130 AEROSPACE & DEFENSE: MARKET, BY REGION, 2024–2029 (USD MILLION)
                        TABLE 131 AEROSPACE & DEFENSE: MARKET, BY CONFIGURATION, 2020–2023 (USD MILLION)
                        TABLE 132 AEROSPACE & DEFENSE: MARKET, BY CONFIGURATION, 2024–2029 (USD MILLION)
                        TABLE 133 AEROSPACE & DEFENSE: MARKET, BY CATEGORY, 2020–2023 (USD MILLION)
                        TABLE 134 AEROSPACE & DEFENSE: MARKET, BY CATEGORY, 2024–2029 (USD MILLION)
     12.8 OTHER END-USER INDUSTRIES 
             TABLE 135 OTHER END-USER INDUSTRIES: MARKET, BY APPLICATION, 2020–2023 (USD MILLION)
             TABLE 136 OTHER END-USER INDUSTRIES: MARKET, BY APPLICATION, 2024–2029 (USD MILLION)
             TABLE 137 OTHER END-USER INDUSTRIES: MARKET, BY REGION, 2020–2023 (USD MILLION)
             TABLE 138 OTHER END-USER INDUSTRIES: MARKET, BY REGION, 2024–2029 (USD MILLION)
             TABLE 139 OTHER END-USER INDUSTRIES: MARKET, BY CONFIGURATION, 2020–2023 (USD MILLION)
             TABLE 140 OTHER END-USER INDUSTRIES: MARKET, BY CONFIGURATION, 2024–2029 (USD MILLION)
             TABLE 141 OTHER END-USER INDUSTRIES: MARKET, BY CATEGORY, 2020–2023 (USD MILLION)
             TABLE 142 OTHER END-USER INDUSTRIES: DIGITAL SIGNAL PROCESSOR MARKET, BY CATEGORY, 2024–2029 (USD MILLION)
 
13 DIGITAL SIGNAL PROCESSOR MARKET, BY REGION (Page No. - 199)
     13.1 INTRODUCTION 
             FIGURE 58 ASIA PACIFIC TO EXHIBIT HIGHEST CAGR FROM 2024 TO 2029
             TABLE 143  MARKET, BY REGION, 2020–2023 (USD MILLION)
             TABLE 144 MARKET, BY REGION, 2024–2029 (USD MILLION)
     13.2 NORTH AMERICA 
             13.2.1 RECESSION IMPACT ON MARKET IN NORTH AMERICA
                        FIGURE 59 NORTH AMERICA: MARKET SNAPSHOT
                        TABLE 145 NORTH AMERICA: MARKET, BY END-USER INDUSTRY, 2020–2023 (USD MILLION)
                        TABLE 146 NORTH AMERICA: DIGITAL SIGNAL PROCESSOR MARKET, BY END-USER INDUSTRY, 2024–2029 (USD MILLION)
                        FIGURE 60 US TO DOMINATE NORTH AMERICAN MARKET DURING FORECAST PERIOD
                        TABLE 147 NORTH AMERICA: MARKET, BY COUNTRY, 2020–2023 (USD MILLION)
                        TABLE 148 NORTH AMERICA:  MARKET, BY COUNTRY, 2024–2029 (USD MILLION)
             13.2.2 US
                        13.2.2.1 Rising autonomous vehicle development and military funding to drive market
             13.2.3 CANADA
                        13.2.3.1 Increasing research on therapeutic and diagnostic equipment to bolster market growth
             13.2.4 MEXICO
                        13.2.4.1 Growing economy and adoption of consumer electronics to accelerate market growth
     13.3 EUROPE 
             13.3.1 RECESSION IMPACT ON DIGITAL SIGNAL PROCESSOR MARKET IN EUROPE
                        FIGURE 61 EUROPE:  MARKET SNAPSHOT
                        TABLE 149 EUROPE: MARKET, BY END-USER INDUSTRY, 2020–2023 (USD MILLION)
                        TABLE 150 EUROPE: MARKET, BY END-USER INDUSTRY, 2024–2029 (USD MILLION)
                        FIGURE 62 GERMANY TO ACCOUNT FOR LARGEST SHARE OF EUROPEAN  MARKET IN 2029
                        TABLE 151 EUROPE:  MARKET, BY COUNTRY, 2020–2023 (USD MILLION)
                        TABLE 152 EUROPE: MARKET, BY COUNTRY, 2024–2029 (USD MILLION)
             13.3.2 GERMANY
                        13.3.2.1 Rising initiatives to promote autonomous vehicle production to facilitate market growth
             13.3.3 UK
                        13.3.3.1 Increasing adoption of 5G network services to fuel market growth
             13.3.4 FRANCE
                        13.3.4.1 Escalating adoption of electric vehicles to accelerate market growth
             13.3.5 ITALY
                        13.3.5.1 Increasing demand for high-speed connectivity to build future-ready smart cities to propel market
             13.3.6 REST OF EUROPE
     13.4 ASIA PACIFIC 
             13.4.1 RECESSION IMPACT ON DIGITAL SIGNAL PROCESSOR MARKET IN ASIA PACIFIC
                        FIGURE 63 ASIA PACIFIC: MARKET SNAPSHOT
                        TABLE 153 ASIA PACIFIC: MARKET, BY END-USER INDUSTRY, 2020–2023 (USD MILLION)
                        TABLE 154 ASIA PACIFIC: MARKET, BY END-USER INDUSTRY, 2024–2029 (USD MILLION)
                        FIGURE 64 INDIA TO REGISTER HIGHEST CAGR IN ASIA PACIFIC MARKET FROM 2024 TO 2029
                        TABLE 155 ASIA PACIFIC: MARKET, BY COUNTRY, 2020–2023 (USD MILLION)
                        TABLE 156 ASIA PACIFIC: MARKET, BY COUNTRY, 2024–2029 (USD MILLION)
             13.4.2 CHINA
                        13.4.2.1 Escalating production of consumer electronics to contribute to segmental growth
             13.4.3 JAPAN
                        13.4.3.1 Mounting demand for industrial robots to augment segmental growth
             13.4.4 SOUTH KOREA
                        13.4.4.1 Rapid advancements in AI infrastructure and smart city development to foster market growth
             13.4.5 INDIA
                        13.4.5.1 Rising automation in manufacturing and 5G network deployment to contribute to market growth
             13.4.6 REST OF ASIA PACIFIC
     13.5 ROW 
             13.5.1 RECESSION IMPACT ON DIGITAL SIGNAL PROCESSOR MARKET IN ROW
                        FIGURE 65 ROW: MARKET SNAPSHOT
                        TABLE 157 ROW: MARKET, BY END-USER INDUSTRY, 2020–2023 (USD MILLION)
                        TABLE 158 ROW: MARKET, BY END-USER INDUSTRY, 2024–2029 (USD MILLION)
                        FIGURE 66 SOUTH AMERICA TO ACCOUNT FOR LARGEST SHARE OF ROW DIGITAL SIGNAL PROCESSOR MARKET IN 2029
                        TABLE 159 ROW:  MARKET, BY REGION, 2020–2023 (USD MILLION)
                        TABLE 160 ROW: MARKET, BY REGION, 2024–2029 (USD MILLION)
             13.5.2 MIDDLE EAST
                        13.5.2.1 Rapid technological advances and digital transformation to fuel market growth
                                     TABLE 161 MIDDLE EAST: MARKET, BY COUNTRY, 2020–2023 (USD MILLION)
                                     TABLE 162 MIDDLE EAST: MARKET, BY COUNTRY, 2024–2029 (USD MILLION)
                        13.5.2.2 GCC countries
                        13.5.2.3 Rest of Middle East
             13.5.3 AFRICA
                        13.5.3.1 Rising focus on developing digital economy to boost market growth
             13.5.4 SOUTH AMERICA
                        13.5.4.1 Increasing demand for electric vehicles and digital transformation to augment market growth
 
14 COMPETITIVE LANDSCAPE (Page No. - 229)
     14.1 OVERVIEW 
     14.2 KEY PLAYER STRATEGIES/RIGHT TO WIN, 2020–2024 
             TABLE 163 DIGITAL SIGNAL PROCESSOR MARKET: OVERVIEW OF STRATEGIES ADOPTED BY KEY PLAYERS, 2020–2024
     14.3 REVENUE ANALYSIS, 2019–2023 
             FIGURE 67 MARKET: REVENUE ANALYSIS OF TOP FIVE PLAYERS, 2019–2023
     14.4 MARKET SHARE ANALYSIS, 2023 
             TABLE 164 MARKET: DEGREE OF COMPETITION
             FIGURE 68 MARKET SHARE ANALYSIS, 2023
     14.5 COMPANY VALUATION AND FINANCIAL METRICS 
             FIGURE 69 COMPANY VALUATION
             FIGURE 70 FINANCIAL METRICS
     14.6 BRAND/PRODUCT COMPARISON 
             FIGURE 71 BRAND/PRODUCT COMPARISON
     14.7 COMPANY EVALUATION MATRIX: KEY PLAYERS, 2023 
             14.7.1 STARS
             14.7.2 EMERGING LEADERS
             14.7.3 PERVASIVE PLAYERS
             14.7.4 PARTICIPANTS
                        FIGURE 72 DIGITAL SIGNAL PROCESSOR MARKET: COMPANY EVALUATION MATRIX (KEY PLAYERS), 2023
             14.7.5 COMPANY FOOTPRINT: KEY PLAYERS, 2023
                        14.7.5.1 Company footprint
                                     FIGURE 73 MARKET: COMPANY FOOTPRINT
                        14.7.5.2 Type footprint
                                     TABLE 165 MARKET: TYPE FOOTPRINT
                        14.7.5.3 IC design footprint
                                     TABLE 166  MARKET: IC DESIGN FOOTPRINT
                        14.7.5.4 Category footprint
                                     TABLE 167 MARKET: CATEGORY FOOTPRINT
                        14.7.5.5 Core footprint
                                     TABLE 168 MARKET: CORE FOOTPRINT
                        14.7.5.6 Configuration footprint
                                     TABLE 169 MARKET: CONFIGURATION FOOTPRINT
                        14.7.5.7 Application footprint
                                     TABLE 170 MARKET: APPLICATION FOOTPRINT
                        14.7.5.8 End-user industry footprint
                                     TABLE 171 MARKET: END-USER INDUSTRY FOOTPRINT
                        14.7.5.9 Region footprint
                                     TABLE 172 MARKET: REGION FOOTPRINT
     14.8 COMPANY EVALUATION MATRIX: START-UPS/SMES, 2023 
             14.8.1 PROGRESSIVE COMPANIES
             14.8.2 RESPONSIVE COMPANIES
             14.8.3 DYNAMIC COMPANIES
             14.8.4 STARTING BLOCKS
                        FIGURE 74 DIGITAL SIGNAL PROCESSOR MARKET: COMPANY EVALUATION MATRIX (START-UPS/SMES), 2023
             14.8.5 COMPETITIVE BENCHMARKING
                        14.8.5.1 Detailed list of key start-ups/SMEs
                                     TABLE 173 MARKET: DETAILED LIST OF KEY START-UPS/SMES
                        14.8.5.2 Competitive benchmarking of key start-ups/SMEs
           FIGURE 75 DIGITAL SIGNAL PROCESSOR MARKET: COMPETITIVE BENCHMARKING OF KEY START-UPS/SMES
     14.9 COMPETITIVE SCENARIO AND TRENDS 
             14.9.1 PRODUCT LAUNCHES
                        TABLE 174 MARKET: PRODUCT LAUNCHES, JANUARY 2020–MARCH 2024
             14.9.2 DEALS
                        TABLE 175 MARKET: DEALS, JANUARY 2020–MARCH 2024
             14.9.3 EXPANSIONS
                        TABLE 176 MARKET: EXPANSIONS, JANUARY 2020–MARCH 2024
             14.9.4 OTHERS
                        TABLE 177 MARKET: OTHERS, JANUARY 2020–MARCH 2024
 
15 COMPANY PROFILES (Page No. - 251)
     15.1 KEY PLAYERS 
(Business overview, Products/Solutions/Services offered, Recent developments, Deals, MnM view, Key strengths/Right to win, Strategic choices, and Weaknesses and Competitive threats)*  
             15.1.1 ANALOG DEVICES, INC.
                        TABLE 178 ANALOG DEVICES, INC.: COMPANY OVERVIEW
                        FIGURE 76 ANALOG DEVICES, INC.: COMPANY SNAPSHOT
                        TABLE 179 ANALOG DEVICES, INC.: PRODUCTS/SOLUTIONS/SERVICES OFFERED
                        TABLE 180 ANALOG DEVICES, INC.: DEALS
             15.1.2 MICROCHIP TECHNOLOGY INC.
                        TABLE 181 MICROCHIP TECHNOLOGY INC.: COMPANY OVERVIEW
                        FIGURE 77 MICROCHIP TECHNOLOGY INC.: COMPANY SNAPSHOT
                        TABLE 182 MICROCHIP TECHNOLOGY INC.: PRODUCTS/SOLUTIONS/SERVICES OFFERED
                        TABLE 183 MICROCHIP TECHNOLOGY INC.: PRODUCT LAUNCHES
                        TABLE 184 MICROCHIP TECHNOLOGY INC.: DEALS
                        TABLE 185 MICROCHIP TECHNOLOGY INC.: EXPANSIONS
                        TABLE 186 MICROCHIP TECHNOLOGY INC.: OTHERS
             15.1.3 TEXAS INSTRUMENTS INCORPORATED
                        TABLE 187 TEXAS INSTRUMENTS INCORPORATED: COMPANY OVERVIEW
                        FIGURE 78 TEXAS INSTRUMENTS INCORPORATED: COMPANY SNAPSHOT
                        TABLE 188 TEXAS INSTRUMENTS INCORPORATED: PRODUCTS/SOLUTIONS/SERVICES OFFERED
             15.1.4 NXP SEMICONDUCTORS
                        TABLE 189 NXP SEMICONDUCTORS: COMPANY OVERVIEW
                        FIGURE 79 NXP SEMICONDUCTORS: COMPANY SNAPSHOT
                        TABLE 190 NXP SEMICONDUCTORS: PRODUCTS/SOLUTIONS/SERVICES OFFERED
                        TABLE 191 NXP SEMICONDUCTORS: DEALS
                        TABLE 192 NXP SEMICONDUCTORS: OTHERS
             15.1.5 MARVELL
                        TABLE 193 MARVELL: COMPANY OVERVIEW
                        FIGURE 80 MARVELL: COMPANY SNAPSHOT
                        TABLE 194 MARVELL: PRODUCTS/SOLUTIONS/SERVICES OFFERED
                        TABLE 195 MARVELL: PRODUCT LAUNCHES
                        TABLE 196 MARVELL: EXPANSIONS
             15.1.6 QUALCOMM TECHNOLOGIES, INC.
                        TABLE 197 QUALCOMM TECHNOLOGIES, INC.: COMPANY OVERVIEW
                        FIGURE 81 QUALCOMM TECHNOLOGIES, INC.: COMPANY SNAPSHOT
                        TABLE 198 QUALCOMM TECHNOLOGIES, INC.: PRODUCTS/SOLUTIONS/SERVICES OFFERED
                        TABLE 199 QUALCOMM TECHNOLOGIES, INC.: DEALS
             15.1.7 CIRRUS LOGIC, INC.
                        TABLE 200 CIRRUS LOGIC, INC.: COMPANY OVERVIEW
                        FIGURE 82 CIRRUS LOGIC, INC.: COMPANY SNAPSHOT
                        TABLE 201 CIRRUS LOGIC, INC.: PRODUCTS/SOLUTIONS/SERVICES OFFERED
                        TABLE 202 CIRRUS LOGIC, INC.: DEALS
             15.1.8 STMICROELECTRONICS
                        TABLE 203 STMICROELECTRONICS: COMPANY OVERVIEW
                        FIGURE 83 STMICROELECTRONICS: COMPANY SNAPSHOT
                        TABLE 204 STMICROELECTRONICS: PRODUCTS/SOLUTIONS/SERVICES OFFERED
                        TABLE 205 STMICROELECTRONICS: PRODUCT LAUNCHES
                        TABLE 206 STMICROELECTRONICS: DEALS
             15.1.9 TOSHIBA ELECTRONIC DEVICES & STORAGE CORPORATION
                        TABLE 207 TOSHIBA ELECTRONIC DEVICES & STORAGE CORPORATION: COMPANY OVERVIEW
                        FIGURE 84 TOSHIBA ELECTRONIC DEVICES & STORAGE CORPORATION: COMPANY SNAPSHOT
                        TABLE 208 TOSHIBA ELECTRONIC DEVICES & STORAGE CORPORATION: PRODUCTS/SOLUTIONS/SERVICES OFFERED
             15.1.10 INFINEON TECHNOLOGIES AG
                        TABLE 209 INFINEON TECHNOLOGIES AG: COMPANY OVERVIEW
                        FIGURE 85 INFINEON TECHNOLOGIES AG: COMPANY SNAPSHOT
                        TABLE 210 INFINEON TECHNOLOGIES AG: PRODUCTS/SOLUTIONS/SERVICES OFFERED
             15.1.11 BROADCOM
                        TABLE 211 BROADCOM: COMPANY OVERVIEW
                        FIGURE 86 BROADCOM: COMPANY SNAPSHOT
                        TABLE 212 BROADCOM: PRODUCTS/SOLUTIONS/SERVICES OFFERED
                        TABLE 213 BROADCOM: PRODUCT LAUNCHES
     15.2 OTHER PLAYERS 
             15.2.1 RENESAS ELECTRONICS CORPORATION
             15.2.2 ASAHI KASEI CORPORATION
             15.2.3 MEDIATEK INC.
             15.2.4 CADENCE DESIGN SYSTEMS, INC.
             15.2.5 ONSEMI
             15.2.6 CEVA, INC.
             15.2.7 BIAMP
             15.2.8 DAYTON AUDIO
             15.2.9 NST AUDIO
             15.2.10 VERISILICON
             15.2.11 KNOWLES ELECTRONICS, LLC.
             15.2.12 KRAMER
             15.2.13 AUDIOCONTROL
             15.2.14 CRESTRON ELECTRONICS, INC.
             15.2.15 EFFECT PHOTONICS
*Details on Business overview, Products/Solutions/Services offered, Recent developments, Deals, MnM view, Key strengths/Right to win, Strategic choices, and Weaknesses and Competitive threats might not be captured in case of unlisted companies.  
 
16 APPENDIX (Page No. - 312)
     16.1 INSIGHTS FROM INDUSTRY EXPERTS 
     16.2 DISCUSSION GUIDE 
     16.3 KNOWLEDGESTORE: MARKETSANDMARKETS’ SUBSCRIPTION PORTAL 
     16.4 CUSTOMIZATION OPTIONS 
     16.5 RELATED REPORTS 
     16.6 AUTHOR DETAILS 


The research study involved the extensive use of secondary sources, directories, and databases (annual reports or presentations of companies, industry association publications, directories, technical handbooks, World Economic Outlook (WEO), trade websites, Hoovers, Bloomberg Businessweek, Factiva, and OneSource) to identify and collect information useful for this technical, market-oriented, and commercial study of the Digital Signal Processor  market. Primary sources mainly comprise several experts from the core and related industries, along with preferred suppliers, manufacturers, distributors, service providers, system providers, technology developers, alliances, and standards and certification organizations related to various phases of this industry’s value chain.

Secondary Research

Various secondary sources have been referred to in the secondary research process for identifying and collecting information important for this study. The secondary sources include annual reports, press releases, and investor presentations of companies; white papers; journals and certified publications; and articles from recognized authors, websites, directories, and databases. Secondary research has been conducted to obtain key information about the industry’s supply chain, market’s value chain, the total pool of key players, market segmentation according to the industry trends (to the bottom-most level), geographic markets, and key developments from both market- and technology-oriented perspectives. The secondary data has been collected and analyzed to determine the overall market size, further validated by primary research.

Primary Research

In the primary research process, various primary sources from the supply and demand sides have been interviewed to obtain qualitative and quantitative information for this report. The primary sources from the supply side include industry experts, such as CEOs, vice presidents, marketing directors, technology & innovation directors, and related key executives from key companies and organizations operating in the Digital Signal Processor  market across four major regions: North America, Europe, Asia Pacific, and RoW (South America, Africa, Middle East). Primary data has been collected through questionnaires, e-mails, and telephonic interviews. Approximately 40% and 60% of primary interviews have been conducted from the demand and supply sides, respectively.

Digital Signal Processor Market
 Size, and Share

To know about the assumptions considered for the study, download the pdf brochure

Market Size Estimation

In the complete market engineering process, both top-down and bottom-up approaches have been used along with several data triangulation methods to perform market estimation and forecasting for the overall market segments and subsegments listed in this report. Key players in the market have been identified through secondary research, and their market shares in the respective regions have been determined through primary and secondary research. This entire procedure includes the study of annual and financial reports of the top market players and extensive interviews for key insights (quantitative and qualitative) with industry experts (CEOs, VPs, directors, and marketing executives).

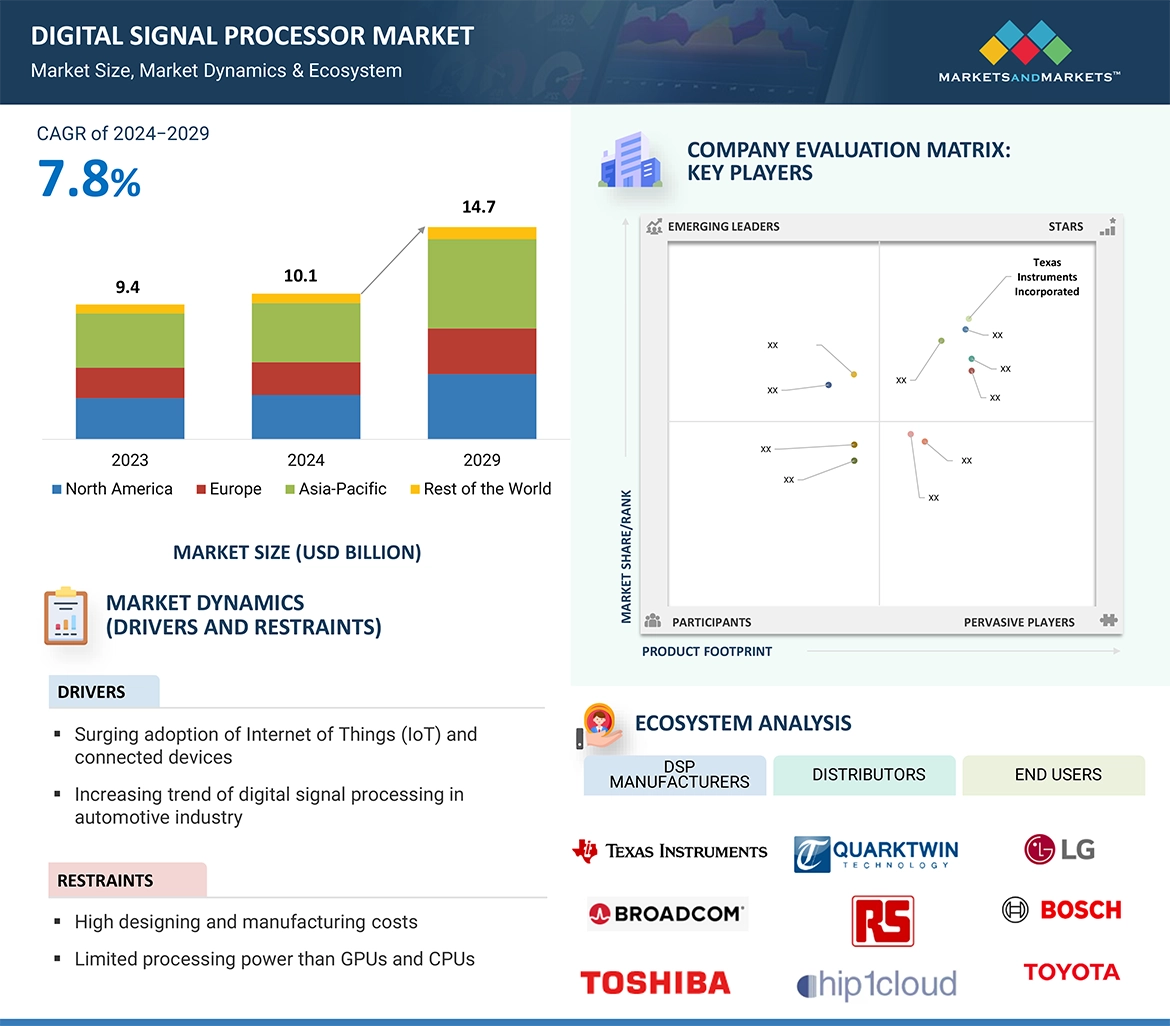
In this approach, important players, such Analog Devices, Inc. (US), Microchip Technology Inc. (US), Texas Instruments Incorporated (US), NXP Semiconductors (Netherlands), and Marvell (US), have been identified. After confirming these companies through primary interviews with industry experts, their total revenue has been estimated by referring to annual reports, SEC filings, and paid databases. Revenues of these companies pertaining to the business units (Bus) that offer Digital Signal Processor  have been identified through similar sources. Industry experts have reconfirmed these revenues through primary interviews.

Digital Signal Processor  Market: Bottom-Up Approach

Digital Signal Processor Market
 Size, and Bottom-Up Approach

The bottom-up approach has been employed to arrive at the overall size of the Digital Signal Processor  market from the revenues of key players and their share in the market.

Digital Signal Processor  Market: Top-Down Approach

Digital Signal Processor Market
 Size, and Top-Down Approach

In the top-down approach, the overall market size has been used to estimate the size of the individual markets (mentioned in the market segmentation) through percentage splits from secondary and primary research. The most appropriate immediate parent market size has been used to implement the top-down approach to calculate the market size of specific segments. The top-down approach has been implemented for the data extracted from the secondary research to validate the market size obtained.

Each company’s market share has been estimated to verify the revenue shares used earlier in the supply-side approach. The overall parent market size and individual market sizes were determined and confirmed in this study by the data triangulation method and the validation of data through primaries. The data triangulation method used in this study is explained in the next section.

Data Triangulation

After arriving at the overall market size from the market size estimation process explained earlier, the total market was split into several segments and subsegments. Data triangulation and market breakdown procedures have been employed to complete the overall market engineering process and arrive at the exact statistics for all segments and subsegments, wherever applicable. The data has been triangulated by studying various factors and trends from both the demand and supply sides. Along with this, the Digital Signal Processor  market has been validated using both top-down and bottom-up approaches.

Market Definition

A digital signal processor (DSP) is an integrated circuit (IC), or IP core designed for efficient digital signal processing. It converts analog signals to digital, processes them using algorithms for tasks like filtering and compression, and outputs digital or converted analog signals. DSPs excel in real-time signal handling, performing complex math operations swiftly and power-efficiently. They find applications in audio processing, video processing, image processing, speech processing & recognition, radar systems, communication systems, and others. DSPs are programmable and often used to offload advanced tasks from CPUs, sometimes paired with specialized hardware for enhanced power efficiency and performance.

Key Stakeholders

  • Digital Signal Processor  products and solutions providers
  • Electronic design automation (EDA) and design tool vendors
  • Wafer manufacturers
  • Government bodies, venture capitalists, and private equity firms
  • Integrated device manufacturers (IDMs)
  • Owners of intellectual property related to DSP
  • DSP technology platform developers
  • Digital Signal Processor  consulting companies
  • Digital Signal Processor related associations, organizations, forums, and alliances
  • Government and corporate offices
  • Venture capitalists, private equity firms, and start-up companies
  • Distributors and traders
  • Research organizations
  • Semiconductor Foundry Service Provider

Report Objectives

  • To define, describe, and forecast the global Digital Signal Processor  market, in terms of value, based on Type, Category, Core, Configuration, IC Design, Application, End-User Industry, and geography
  • To describe and forecast the global Digital Signal Processor  market size, by Type, in terms of volume
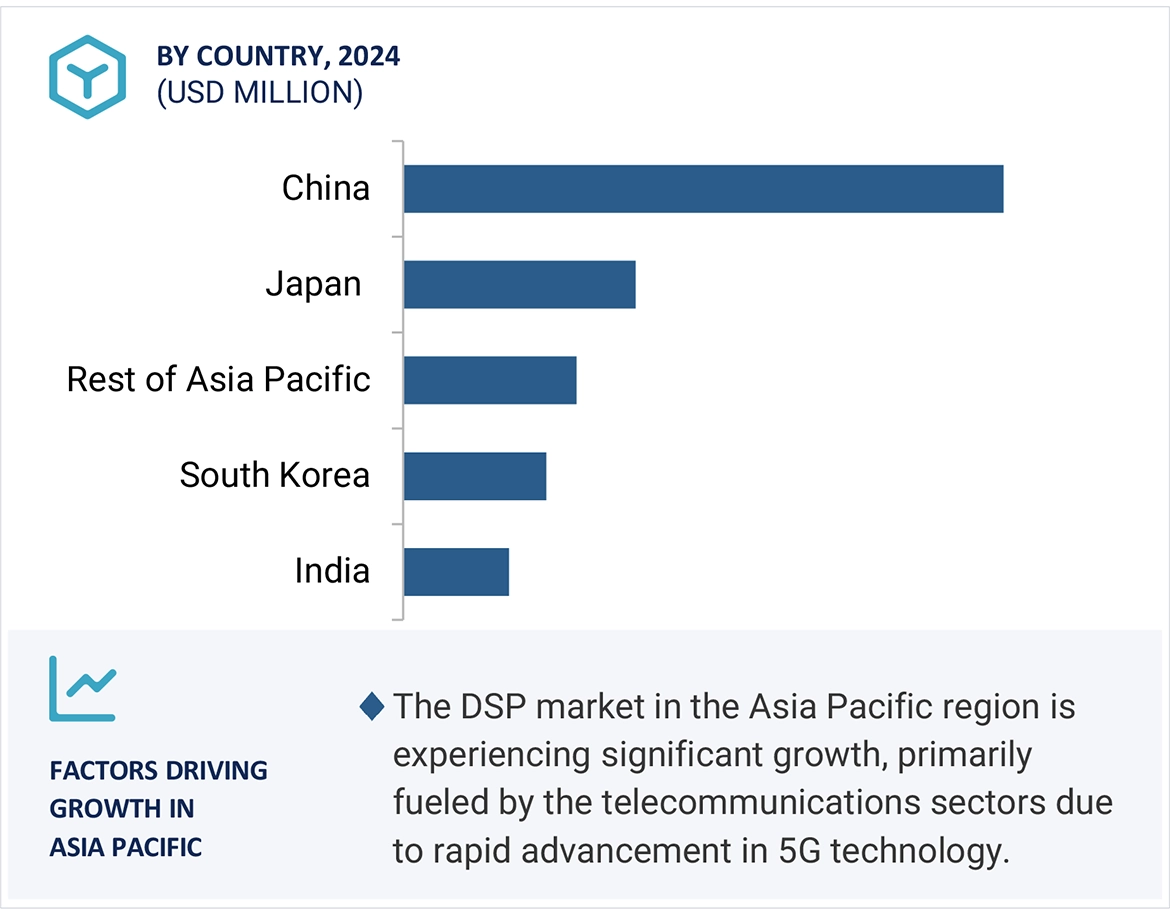
  • To forecast the market size, in terms of value, for various segments, with respect to four main regions—North America, Europe, Asia Pacific, and Rest of the World (RoW)
  • To provide detailed information regarding the major factors influencing the growth of the Digital Signal Processor  market (drivers, restraints, opportunities, and industry-specific challenges)
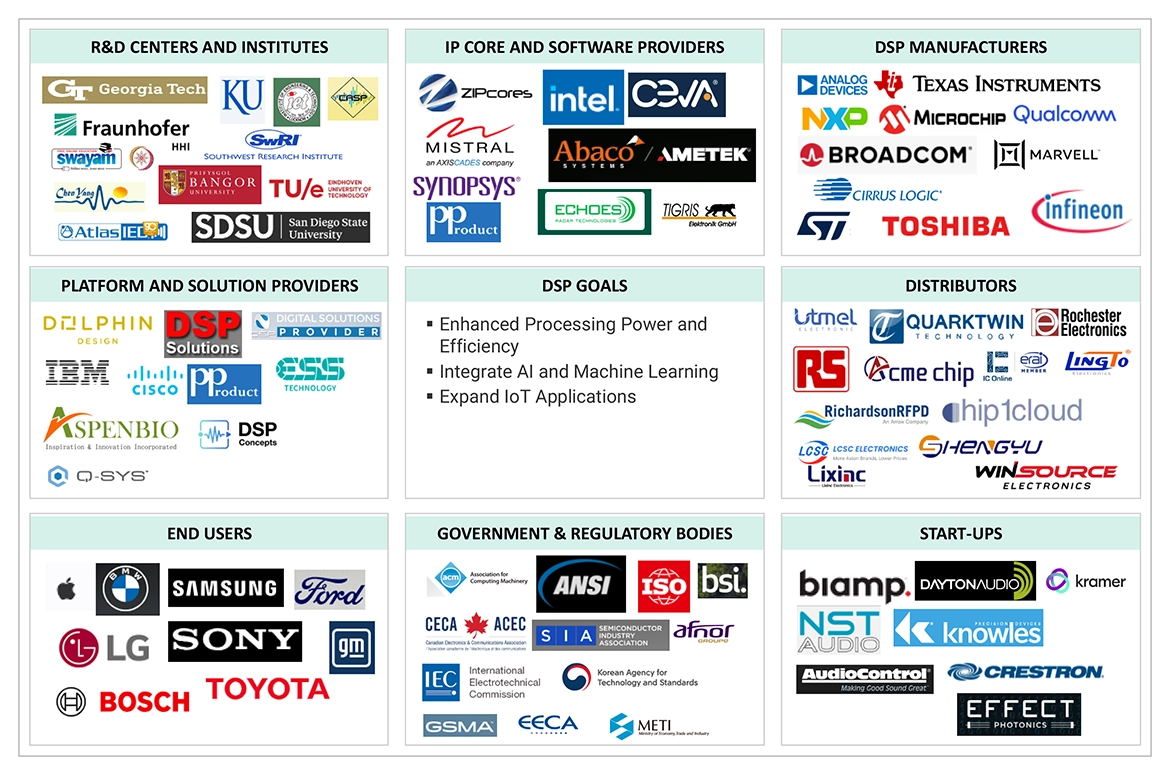
  • To provide an ecosystem analysis, case study analysis, patent analysis, technology analysis, ASP analysis, Porter’s Five Forces analysis, and regulations pertaining to the market.
  • To offer a comprehensive overview of the value chain of Digital Signal Processor  market ecosystem
  • To strategically analyze micromarkets1 with respect to individual growth trends, prospects, and contributions to the total market
  • To analyze opportunities for the market stakeholders by identifying high-growth segments of the Digital Signal Processor  market
  • To benchmark players within the market using the proprietary Competitive Leadership Mapping framework, which analyzes market players on various parameters within the broad categories of market rank and product offering
  • To strategically profile the key players and comprehensively analyze their market shares and core competencies2 and provide a detailed competitive landscape for market leaders
  • To analyze competitive developments such as partnerships, collaborations, agreements, and joint ventures; mergers and acquisitions; expansions; and product launches and developments in the Digital Signal Processor  market
  • To evaluate the impact of the recession on the Digital Signal Processor  market

Available Customizations

With the given market data, MarketsandMarkets offers customizations according to the company’s specific needs. The following customization options are available for the report:

Company Information

  • Detailed analysis and profiling of additional market players (up to 7)
Custom Market Research Services

We will customize the research for you, in case the report listed above does not meet with your exact requirements. Our custom research will comprehensively cover the business information you require to help you arrive at strategic and profitable business decisions.

Request Customization
Report Code
SE 1258
Published ON
May, 2024
Choose License Type
BUY NOW
  • SHARE
X
Request Customization
Speak to Analyst
Speak to Analyst
OR FACE-TO-FACE MEETING
PERSONALIZE THIS RESEARCH
  • Triangulate with your Own Data
  • Get Data as per your Format and Definition
  • Gain a Deeper Dive on a Specific Application, Geography, Customer or Competitor
  • Any level of Personalization
REQUEST A FREE CUSTOMIZATION
LET US HELP YOU!
  • What are the Known and Unknown Adjacencies Impacting the Digital Signal Processor Market
  • What will your New Revenue Sources be?
  • Who will be your Top Customer; what will make them switch?
  • Defend your Market Share or Win Competitors
  • Get a Scorecard for Target Partners
CUSTOMIZED WORKSHOP REQUEST
  • Call Us
  • +1-888-600-6441 (Corporate office hours)
  • +1-888-600-6441 (US/Can toll free)
  • +44-800-368-9399 (UK office hours)
CONNECT WITH US
ABOUT TRUST ONLINE
©2024 MarketsandMarkets Research Private Ltd. All rights reserved
DMCA.com Protection Status Website Feedback