District Heating Market by Heat Source (Coal, Natural Gas, Renewables, Oil & Petroleum Products), Component (Boiler, Heat Exchanger), Plant Type (Boiler Plants, CHP), Application (Residential, Commercial, Industrial) and Region - Global Forecast to 2027
The global district heating market is estimated at USD 167.8 Billion in 2022 and is projected to reach USD 226.5 Billion by 2027, registering a CAGR of 6.2% during the forecast period.
Increasing integration of renewable energy in district heating, advantages over individual in-building heating systems, and policy initiatives by governments and associations are among the factors driving the growth of the district heating industry.
Global District Heating Market Trends
To know about the assumptions considered for the study, Request for Free Sample Report
District Heating Market Dynamics:
Driver: Growing urbanization and industrialization
Urbanization is one of the megatrends in the world; continuous urban development is boosting the demand for district heating. Public expenditures have been increasing due to the rising population shift from rural to urban areas.
Consequently, there has been a steady rise in the demand for heating; as a result, substantial investments have been made in the district heating sector. Growing urbanization leads to organized infrastructure developments suitable for district heating solutions. Growing urban cities create a demand for sustainable, efficient, and reliable utility services, including district heating and electricity production. According to new United Nations projections, urbanization, the gradual shift in human population residence from rural to urban areas, combined with overall population growth, could add another 2.5 billion people to urban areas by 2050.
District heating solutions procure heat from several sources, including industrial surplus heat, renewables, CHP, and boilers. The huge amount of heat generated from industries and data centres due to growing industrialization can be used for district heating, which, in turn, helps achieve economic efficiency. Hence, growing urbanization drives the district heating market, whereas increasing industrialization helps meet the heat requirement for district heating.
Restraint: Reduced effectiveness in small heating loads and space constraints for distribution grids
District heating is suitable for large-scale projects by big developers. This is primarily because small-scale developers, although aware of the benefits of district heating, do not adopt it in conjunction with neighboring developers due to their different construction schedules and investments.
As a result, small-scale developers opt for conventional heating as per their schedule. District heating arrangements are common in all new projects where space for a pipe network can be planned during building construction. However, in old buildings, sufficient space for a pipe network may not be available, limiting its penetration. Installation of distribution pipes in pre-existing cities/districts, which were initially not planned to have such a system, is one of the major restraints for the adoption of district heating systems.
Opportunity: Integration of multiple energy source
One of district heating systems' main advantages is their ability to integrate multiple energy sources, including waste heat and renewables. Nonetheless, according to IEA, nearly 90% of global heat production in 2020 was from fossil fuels, primarily coal (45%), natural gas (40%), and oil (5%), down from 95% in 2000.
More heat source diversification (particularly from fossil fuels to renewables, electricity, and excess heat) and the integration of large-scale heat pumps will accelerate the transition to lower-temperature and more flexible district heating networks—a transition from third-generation to fourth-generation district heating. Meanwhile, fifth-generation district heating, introduced in 2015, refers to combined district heating and cooling networks that operate at room temperature and use distributed heat pumps. In addition to network modifications, the deployment of low-temperature district heating networks must be coordinated with building energy efficiency improvements, as improved building energy performance is compatible with low-temperature heat supply.
Challenge: Difficulty in load prediction and better utilization of heating systems
For the cost-effective operation of district heating systems, the base heating load of the system needs to be planned to operate with higher efficiency. Hence, proper prediction of future growth in heating requirements is essential.
Although this can be managed by implementing the project in phases, proper baseload and peak load planning will affect the efficiency of central heating plant operations. A change in climatic conditions every day can also affect the heating requirements in a region. Overall, proper load planning and the need for better utilization of heating systems remain the major challenges for the market.
District Heating Market Segment Overview
By heat source, natural gas segment is expected to grow with the second highest CAGR during the forecast period
The natural gas heat source segment is anticipated to record the second highest CAGR of 5.9% during the forecast period. It is mainly used for district heating as it is more effective than electric heat pumps.
This fuel can also be used in centralized systems to produce comfortable heating with absorption machines that use natural gas to create hot steam. Moreover, the majority of the residential sector in the US uses natural gas for space heating and water heating.
According to the Energy Information Administration (EIA), the majority of natural gas used in homes is for space heating, which includes both air and water. In 2021, the residential sector accounted for about 15% of the total US natural gas consumption, and natural gas was the source of about 23% of the US residential sector's total energy consumption.
By plant type, CHP plant segment is expected to grow with the highest CAGR during the forecast period
The CHP segment is anticipated to record the second highest CAGR of 6.9% during the forecast period. CHP plants help reduce capital investment, provide economies of scale, reduce heat losses to the environment, and substitute the use of fossil fuels for district heating, which, in turn, leads to the reduction of greenhouse gas emissions.
They significantly increase power plant efficiency thus, reducing fuel costs, and carbon emissions, and reducing damage to the local environment. The implementation of CHP plants is often driven by the requirements of mission-critical facilities such as hospitals, data centres, research labs, etc.
CHP plants in district heating systems are well suited as they expand the potential thermal load, reduce the requirement for capital investment, and provide economies of scale that enable technologies such as thermal energy storage to be more economical. These factors are expected to drive the growth of the district heating market for CHP plants.
By application, residential application segment is expected to grow with the highest CAGR during the forecast period
The residential application segment is expected to witness the highest CAGR of 6.9% during the forecast period. Residential applications include single-family houses and apartments (hotels, buildings, and multi-housing).
The adoption of district heating in single-family houses is lower than that of apartments due to the cost-effectiveness of other heating options like furnaces and fireplaces. Additionally, district heating allows residents to share the cost of heating a building. With this type of system, the owners of residences in a building make savings on the initial outlay, as only one boiler needs to be bought and installed, rather than one in each residence.
The maintenance of the heating system is also shared between the building's residents and is cheaper than maintaining multiple individual boilers. In addition, technological advancements in smart home applications play a major role in increasing the demand for district heating in residential segment.
In 2027, Asia Pacific is projected to hold the largest share of the overall district heating market
District Heating Market by Region
To know about the assumptions considered for the study, download the pdf brochure
The study contains insights from various industry experts, ranging from component suppliers to Tier 1 companies and OEMs. The break-up of the primaries is as follows:
- By Company Type - Tier 1 – 10%, Tier 2 – 20%, Tier 3 – 70%
- By Designation— C level - 40%, Managers - 30%, Other Level - 30%
- By Region—Americas - 40%, Asia Pacific - 20%, Europe - 40%
Europe captured the largest share of ~67% in the district heating market in 2021 and the same trend is expected in the near future. The growth is also attributed to increasing urbanization, the growing demand for energy-efficient systems, and rising government regulations for reducing greenhouse gas emissions. Moreover, strict emission limits set by various environmental associations support the development of the district heating industry in Europe. For instance, in December 2021, the European Union planned the European Green Deal to decarbonize the EU’s building stock by 2050. Under this plan, the renovation of residential, commercial, and industrial buildings across Europe was done to reduce greenhouse gas emissions and decarbonize buildings through district heating. Furthermore, the increasing focus of the Environmental Protection Agency (EPA) on reducing emission levels across the world and aiming for net-zero carbon emissions by 2050 is expected to drive the district heating market growth.
“Americas: To grow at second highest CAGR in 2027”
The Americas is expected to witness the second highest CAGR of 8.4% during the forecast period. The region has always been leading in terms of the adoption of advanced technologies including digitalization. 
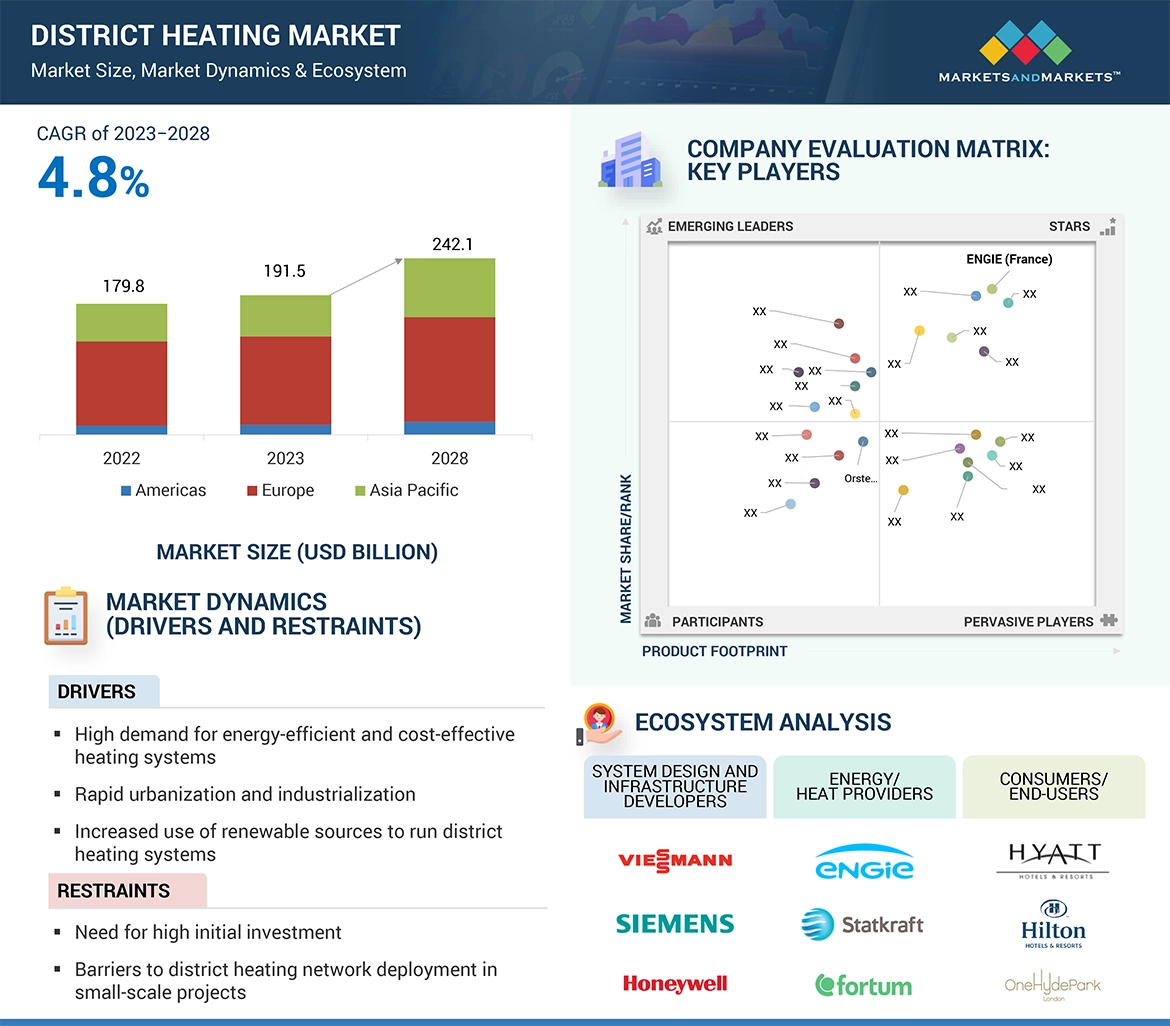
According to the International District Energy Association (IDEA), the region has taken initiatives toward the development of district heating solutions. These initiatives are driving the demand for district heating systems in the American market.
Key Market Players in District Heating Market
Fortum (Finland), Vattenfall (Sweden), ENGIE (France), Danfoss (Denmark), Statkraft (Norway), LOGSTOR (Denmark), Vital Energiv (UK), Kelag (Austria), SHINRYO CORPORATION (Japan) are some of the key players in the district heating industry.
District Heating Market Report Scope
Report Metric |
Details |
Market Size Value in 2022 |
USD 167.8 Billion by 2027 |
Revenue Forecast in 2027 |
USD 226.5 Billion |
Growth Rate |
6.2% |
Market Size Availability for Years |
2018–2027 |
Base Year |
2021 |
Forecast Period |
2022–2027 |
Forecast Units |
Value (USD) |
Segments Covered |
By heat source, plant type, application, and region |
Geographies Covered |
North America, Europe, Asia Pacific, and RoW |
Companies Covered |
Fortum (Finland), Vattenfall (Sweden), ENGIE (France), Danfoss (Denmark), Statkraft (Norway), LOGSTOR (Denmark), Vital Energiv (UK), Kelag (Austria), SHINRYO CORPORATION (Japan) are some of the key players in the district heating market. |
District Heating Industry Highlights
This research report categorizes the district heating market based on heat source, plant type, application, and region.
Aspect |
Details |
Based On Heat Source |
|
Based on Component |
|
Based on Plant Type |
|
Based On Application |
|
Based On Region |
|
Recent Developments
- In March 2022, Fortum and Microsoft announced a novel partnership in which Fortum will collect the surplus heat produced by a new data centre to be constructed by Microsoft in the Finnish capital of Helsinki. The data centres will run entirely on emission-free electricity, and Fortum will use the server cooling process to transfer clean heat to nearby homes, businesses, and other buildings connected to its district heating system. The data centre will have the largest waste heat recycling concept in the entire world.
- In March 2022, Ameresco, Inc., a leading cleantech integrator specializing in energy efficiency and renewable energy, announced that it had been chosen as a partner in the Bristol City Leap project, a 20-year concession to decarbonize the city. Ameresco, in collaboration with Vattenfall Heat UK, will work through a unique public-private partnership structure to provide services such as energy efficiency upgrades, wind and solar services, project financing, long-term operation and maintenance, and more. The Bristol City Leap project will run for 20 years, aiming for net zero goals through a series of energy and infrastructure investment opportunities that will attract approximately £1 billion in inward investment.
- In April 2022, the Danfoss Heat Recovery Unit (HRU) is intended to recover waste heat from CO2 refrigeration systems. The reclaimed heat can be used for domestic heating purposes such as store heating and hot water as well as sold to local district heating companies where possible.
Frequently Asked Questions (FAQ):
What is the market size of district heating?
The size of the district heating market is anticipated to increase from USD 167.8 Billion in 2022 to USD 226.5 Billion by 2027, growing at a CAGR of 6.2%.
What are the major benefits of district heating?
District heating can be more benificial than individual heating systems, as it allows for economies of scale and can reduce energy waste. It also offers a more reliable and sustainable source of heat compared to individual heating systems, as well as reducing greenhouse gas emissions.
Who are the key players in the District Heating Market?
Key players in the district heating market include Fortum (Finland), Vattenfall (Sweden), ENGIE (France), Danfoss (Denmark), Statkraft (Norway), LOGSTOR (Denmark), Vital Energi (UK), Kelag (Austria), SHINRYO CORPORATION (Japan).
What are the challenges faced by the district heating market?
The challenges faced by the district heating market include regulatory barriers, high initial costs, and competition from alternative heating sources such as natural gas and renewable energy.
What are the future trends in the district heating market?
The future trends in the district heating market include the increasing use of renewable energy sources such as solar and geothermal, the integration of smart technologies, and the expansion of district heating into new markets.
To speak to our analyst for a discussion on the above findings, click Speak to Analyst
TABLE OF CONTENTS
1 INTRODUCTION (Page No. - 28)
1.1 STUDY OBJECTIVES
1.2 MARKET DEFINITION
1.2.1 INCLUSIONS AND EXCLUSIONS
1.3 STUDY SCOPE
1.3.1 MARKETS COVERED
FIGURE 1 DISTRICT HEATING MARKET SEGMENTATION
1.3.2 GEOGRAPHIC SCOPE
1.3.3 YEARS CONSIDERED
1.4 CURRENCY CONSIDERED
1.5 STAKEHOLDERS
1.6 SUMMARY OF CHANGES
2 RESEARCH METHODOLOGY (Page No. - 32)
2.1 RESEARCH DATA
FIGURE 2 DISTRICT HEATING INDUSTRY : RESEARCH DESIGN
2.1.1 SECONDARY AND PRIMARY RESEARCH
2.1.2 SECONDARY DATA
2.1.2.1 List of key secondary sources
2.1.2.2 Key data from secondary sources
2.1.3 PRIMARY DATA
2.1.3.1 List of key primary interview participants
2.1.3.2 Breakdown of primaries
FIGURE 3 BREAKDOWN OF PRIMARIES
2.1.3.3 Key data from primary sources
2.1.3.4 Key industry insights
2.2 FACTOR ANALYSIS
2.2.1 SUPPLY-SIDE ANALYSIS
FIGURE 4 MARKET SIZE ESTIMATION METHODOLOGY: APPROACH 1 (SUPPLY-SIDE ANALYSIS) – REVENUES GENERATED BY COMPANIES FROM SALES OF PRODUCTS OFFERED IN DISTRICT HEATING MARKET
2.3 MARKET SIZE ESTIMATION
FIGURE 5 MARKET SIZE ESTIMATION METHODOLOGY: SUPPLY-SIDE ANALYSIS
2.3.1 BOTTOM-UP APPROACH
2.3.1.1 Approach for obtaining market share using bottom-up analysis (demand-side)
FIGURE 6 MARKET SIZE ESTIMATION METHODOLOGY: BOTTOM-UP APPROACH
2.3.2 TOP-DOWN APPROACH
2.3.2.1 Approach for obtaining market share using top-down analysis (supply-side)
FIGURE 7 MARKET SIZE ESTIMATION METHODOLOGY: TOP-DOWN APPROACH
2.3.3 GROWTH PROJECTION AND FORECASTING ASSUMPTIONS
TABLE 1 MARKET GROWTH ASSUMPTIONS
2.4 DATA TRIANGULATION
FIGURE 8 DISTRICT HEATING ECOSYSTEM : DATA TRIANGULATION
2.5 ASSUMPTIONS
TABLE 2 KEY ASSUMPTIONS: MACRO AND MICRO-ECONOMIC ENVIRONMENT
2.6 LIMITATIONS
2.7 RISK ASSESSMENT
TABLE 3 RISK ASSESSMENT: DISTRICT HEATING MARKET
3 EXECUTIVE SUMMARY (Page No. - 45)
FIGURE 9 RENEWABLES TO WITNESS HIGHEST CAGR DURING FORECAST PERIOD
FIGURE 10 CHP IS PROJECTED TO WITNESS HIGHEST CAGR DURING FORECAST PERIOD
FIGURE 11 EUROPE TO LEAD MARKET, IN TERMS OF SHARE, FROM 2022 TO 2027
4 PREMIUM INSIGHTS (Page No. - 48)
4.1 ATTRACTIVE GROWTH OPPORTUNITIES FOR PLAYERS IN DISTRICT HEATING INDUSTRY
FIGURE 12 GROWING ADOPTION OF DISTRICT HEATING TO COUNTER FRIGID WEATHER TO BOOST MARKET
4.2 MARKET, BY PLANT TYPE
FIGURE 13 CHP SEGMENT TO CONTINUE TO HOLD LARGEST SHARE OF MARKET DURING FORECAST PERIOD
4.3 MARKET, BY APPLICATION
FIGURE 14 RESIDENTIAL APPLICATION TO WITNESS HIGHEST CAGR IN INDUSTRY DURING FORECAST PERIOD
4.4 MARKET, BY REGION
FIGURE 15 EUROPE TO HOLD LARGEST SHARE OF MARKET IN 2027
4.5 MARKET, BY COUNTRY
FIGURE 16 CHINA TO RECORD HIGHEST CAGR IN OVERALL MARKET DURING FORECAST PERIOD
5 MARKET OVERVIEW (Page No. - 51)
5.1 INTRODUCTION
5.2 MARKET DYNAMICS
FIGURE 17 DISTRICT HEATING MARKET: DRIVERS, RESTRAINTS, OPPORTUNITIES, AND CHALLENGES
5.2.1 DRIVERS
5.2.1.1 Increasing demand for energy-efficient and cost-effective heating systems
5.2.1.2 Growing urbanization and industrialization
5.2.1.3 Increasing integration of renewable energy in district heating
5.2.1.4 Advantages over individual in-building heating systems
5.2.1.5 Rising number of policy initiatives by governments and associations
5.2.2 RESTRAINTS
5.2.2.1 High infrastructure and maintenance costs
5.2.2.2 Reduced effectiveness in small heating loads
5.2.3 OPPORTUNITIES
5.2.3.1 Rising demand for energy-efficient and sustainable heating technologies
5.2.3.2 Increasing integration of multiple energy sources
5.2.3.3 Growing technological advancements and digitalization
5.2.3.4 Rising number of initiatives related to clean energy production
5.2.4 CHALLENGES
5.2.4.1 Need for robust transportation equipment
5.2.4.2 Difficulty in load prediction and better utilization of heating systems
5.3 VALUE CHAIN ANALYSIS
FIGURE 18 VALUE CHAIN ANALYSIS: DISTRICT HEATING MARKET
5.4 PORTER’S FIVE FORCE ANALYSIS
TABLE 4 DISTRICT HEATING ECOSYSTEM: PORTER’S FIVE FORCES ANALYSIS
FIGURE 19 PORTER’S FIVE FORCES ANALYSIS: IMPACT OF EACH FORCE ON MARKET
5.4.1 BARGAINING POWER OF SUPPLIERS
5.4.2 BARGAINING POWER OF BUYERS
5.4.3 THREAT OF NEW ENTRANTS
5.4.4 THREAT OF SUBSTITUTES
5.4.5 INTENSITY OF COMPETITIVE RIVALRY
5.5 AVERAGE SELLING PRICE ANALYSIS
5.5.1 AVERAGE SELLING PRICES OF DISTRICT HEATING OFFERED BY KEY PLAYERS
FIGURE 20 AVERAGE SELLING PRICES OF DISTRICT HEATING OFFERED BY KEY PLAYERS
TABLE 5 AVERAGE SELLING PRICES OF DISTRICT HEATING OFFERED BY KEY PLAYERS (USD/MWH)
5.5.2 AVERAGE SELLING PRICE TREND
TABLE 6 AVERAGE SELLING PRICES: MARKET, BY APPLICATION (USD/MWH)
FIGURE 21 AVERAGE SELLING PRICES: MARKET, BY APPLICATION (USD/MWH)
5.6 KEY STAKEHOLDERS AND BUYING CRITERIA
5.6.1 KEY STAKEHOLDERS IN BUYING PROCESS
FIGURE 22 INFLUENCE OF STAKEHOLDERS ON BUYING PROCESSES FOR TOP THREE APPLICATIONS
TABLE 7 INFLUENCE OF STAKEHOLDERS ON BUYING PROCESSES FOR TOP THREE APPLICATIONS (%)
5.6.2 BUYING CRITERIA
FIGURE 23 KEY BUYING CRITERIA FOR TOP THREE APPLICATIONS
TABLE 8 KEY BUYING CRITERIA FOR TOP 3 APPLICATIONS
5.7 TRADE ANALYSIS
5.7.1 TRADE ANALYSIS FOR DISTRICT HEATING
TABLE 9 HEAT PUMPS: GLOBAL IMPORTS DATA, 2017–2021 (USD MILLION)
TABLE 10 HEAT PUMPS: GLOBAL EXPORTS DATA, 2017–2021 (USD MILLION)
5.8 ECOSYSTEM
FIGURE 24 DISTRICT HEATING MARKET: ECOSYSTEM
TABLE 11 MARKET: ECOSYSTEM
FIGURE 25 TRENDS/DISRUPTION IMPACTING DISTRICT HEATING INDUSTRY
5.9 CASE STUDY ANALYSIS
5.9.1 FORTUM AND MICROSOFT DATA CENTRE PROJECT ADVANCES CLIMATE GOAL
5.9.2 TEKNOPARK ISTANBUL, TURKEY, USES DISTRICT ENERGY AS HEATING AND COOLING SOLUTION
5.9.3 CAMDEN LOCK DISTRICT HEATING NETWORK
5.9.4 SURPLUS HEAT FROM DATA CENTRE USED FOR DISTRICT HEATING
5.1 PATENT ANALYSIS
FIGURE 26 PATENTS GRANTED WORLDWIDE, 2012–2021
TABLE 12 TOP 20 PATENT OWNERS, 2012–2021
FIGURE 27 TOP 10 COMPANIES WITH HIGHEST NUMBER OF PATENTS, 2012–2021
5.11 TECHNOLOGY ANALYSIS
5.11.1 USE OF BIOFUELS
5.11.2 GEOTHERMAL DISTRICT HEATING
5.11.3 DISTRICT HEATING USING WASTE HEAT FROM HYDROGEN PRODUCTION
5.11.4 FIFTH-GENERATION DISTRICT HEATING
5.11.5 NUCLEAR ENERGY FOR DISTRICT HEATING
5.11.6 RESIDENTIAL CONSTRUCTION INDUSTRY
5.12 MARKET REGULATIONS AND STANDARDS
5.12.1 STANDARDS
5.13 KEY CONFERENCES AND EVENTS, 2022–2023
TABLE 13 DISTRICT HEATING ECOSYSTEM: DETAILED LIST OF CONFERENCES AND EVENTS
5.14 STANDARDS AND REGULATORY LANDSCAPE
5.14.1 REGULATORY BODIES, GOVERNMENT AGENCIES, AND OTHER ORGANIZATIONS
TABLE 14 AMERICAS: LIST OF REGULATORY BODIES, GOVERNMENT AGENCIES, AND OTHER ORGANIZATIONS
TABLE 15 EUROPE: LIST OF REGULATORY BODIES, GOVERNMENT AGENCIES, AND OTHER ORGANIZATIONS
TABLE 16 ASIA PACIFIC: LIST OF REGULATORY BODIES, GOVERNMENT AGENCIES, AND OTHER ORGANIZATIONS
5.15 TARIFF ANALYSIS
TABLE 17 TARIFF FOR HS CODE 841861 EXPORTED BY CHINA (2021)
TABLE 18 TARIFF FOR HS CODE 841861 EXPORTED BY FRANCE (2021)
6 DISTRICT HEATING MARKET, BY COMPONENT (Page No. - 78)
6.1 INTRODUCTION
6.2 BOILERS
6.2.1 BOILERS MORE ENERGY-EFFICIENT THAN STANDARD FORCED AIR SYSTEMS
6.3 INSULATED PIPELINES
6.3.1 INSULATED PIPELINES MAINTAIN TEMPERATURE OF HOT WATER IN PIPELINES
6.4 PUMPS
6.4.1 PUMPS CREATE BALANCE AND INTEGRATION ACROSS ENERGY SYSTEMS
6.5 HEAT EXCHANGERS
6.5.1 HEAT EXCHANGERS MAXIMIZE USE OF HEAT AVAILABLE FROM CIRCULATED WATER
6.6 HEAT METERS
6.6.1 HEAT METERS MEASURE AMOUNT OF HEAT DELIVERED
7 DISTRICT HEATING INDUSTRY, BY HEAT SOURCE (Page No. - 81)
7.1 INTRODUCTION
FIGURE 28 NATURAL GAS IS PROJECTED TO HOLD LARGEST SHARE OF MARKET, BY HEAT SOURCE IN 2027
TABLE 19 MARKET, BY HEAT SOURCE, 2018–2021 (USD BILLION)
TABLE 20 MARKET, BY HEAT SOURCE, 2022–2027 (USD BILLION)
7.2 COAL
7.2.1 COAL PROVIDES POWERFUL AND SAFE HEAT WHILE SAVING SIGNIFICANT AMOUNT OF MONEY
TABLE 21 COAL: MARKET, BY REGION, 2018–2021 (USD BILLION)
TABLE 22 COAL: MARKET, BY REGION, 2022–2027 (USD BILLION)
7.3 NATURAL GAS
7.3.1 NATURAL GAS HIGHLY EFFICIENT BASED ON NET CALORIFIC VALUE
TABLE 23 NATURAL GAS: MARKET, BY REGION, 2018–2021 (USD BILLION)
TABLE 24 NATURAL GAS: MARKET, BY REGION, 2022–2027 (USD BILLION)
7.4 RENEWABLES
7.4.1 DISTRICT HEATING USING RENEWABLE HEAT SOURCES HELPS FULFIL RISING URBAN ENERGY NEEDS
TABLE 25 RENEWABLES: MARKET, BY REGION, 2018–2021 (USD BILLION)
TABLE 26 RENEWABLES: MARKET, BY REGION, 2022–2027 (USD BILLION)
7.5 OIL & PETROLEUM PRODUCTS
7.5.1 OIL AND PETROLEUM PRODUCTS OFTEN USED ONLY AS BACKUP FUEL SOURCES
TABLE 27 OIL AND PETROLEUM PRODUCTS: MARKET, BY REGION, 2018–2021 (USD BILLION)
TABLE 28 OIL AND PETROLEUM PRODUCTS: MARKET, BY REGION, 2022–2027 (USD BILLION)
7.6 OTHERS
TABLE 29 OTHERS: DISTRICT HEATING SIZE, BY REGION, 2018–2021 (USD BILLION)
TABLE 30 OTHERS: MARKET, BY REGION, 2022–2027 (USD BILLION)
8 DISTRICT HEATING MARKET, BY PLANT TYPE (Page No. - 89)
8.1 INTRODUCTION
FIGURE 29 CHP PLANTS TO OCCUPY LARGEST MARKET SHARE IN 2027
TABLE 31 GLOBAL MARKET, BY PLANT TYPE, 2018–2021 (USD BILLION)
TABLE 32 GLOBAL MARKET, BY PLANT TYPE, 2022–2027 (USD BILLION)
8.2 BOILER PLANTS
8.2.1 BOILER PLANTS TO WITNESS SECOND-HIGHEST CAGR DURING FORECAST PERIOD
TABLE 33 BOILER PLANTS: MARKET, BY REGION, 2018–2021 (USD BILLION)
TABLE 34 BOILER PLANTS: DISTRICT HEATING INDUSTRY, BY REGION, 2022–2027 (USD BILLION)
8.3 COMBINED HEAT AND POWER
8.3.1 LOW CAPITAL INVESTMENTS AND REDUCED HEAT LOSSES TO BOOST MARKET
TABLE 35 CHP: MARKET, BY REGION, 2018–2021 (USD BILLION)
TABLE 36 CHP: MARKET, BY REGION, 2022–2027 (USD BILLION)
8.4 OTHERS
TABLE 37 OTHERS: MARKET, BY REGION, 2018–2021 (USD BILLION)
TABLE 38 OTHERS: MARKET, BY REGION, 2022–2027 (USD BILLION)
9 DISTRICT HEATING MARKET, BY APPLICATION (Page No. - 94)
9.1 INTRODUCTION
FIGURE 30 RESIDENTIAL SEGMENT IS PROJECTED TO HOLD LARGEST MARKET SHARE IN 2027
TABLE 39 MARKET, BY APPLICATION, 2018–2021 (USD BILLION)
TABLE 40 MARKET, BY APPLICATION, 2022–2027 (USD BILLION)
9.2 RESIDENTIAL
9.2.1 DISTRICT HEATING ALLOWS RESIDENTS TO SHARE COST OF HEATING BUILDING
TABLE 41 RESIDENTIAL: MARKET, BY REGION, 2018–2021 (USD BILLION)
TABLE 42 RESIDENTIAL: MARKET, BY REGION, 2022–2027 (USD BILLION)
9.3 COMMERCIAL
9.3.1 ADVANTAGES INCLUDING REDUCED RUNNING COSTS AND LOWER GREENHOUSE GAS EMISSIONS TO BOOST MARKET
TABLE 43 COMMERCIAL: MARKET, BY REGION, 2018–2021 (USD BILLION)
TABLE 44 COMMERCIAL: MARKET, BY REGION, 2022–2027 (USD BILLION)
9.4 INDUSTRIAL
9.4.1 GROWING INDUSTRIALIZATION TO DRIVE MARKET
TABLE 45 INDUSTRIAL: MARKET, BY REGION, 2018–2021 (USD BILLION)
TABLE 46 INDUSTRIAL: MARKET, BY REGION, 2022–2027 (USD BILLION)
10 GEOGRAPHIC ANALYSIS (Page No. - 100)
10.1 INTRODUCTION
FIGURE 31 EUROPE IS PROJECTED TO OCCUPY LARGEST MARKET SHARE IN 2027
TABLE 47 MARKET, BY REGION, 2018–2021 (USD BILLION)
TABLE 48 MARKET, BY REGION, 2022–2027 (USD BILLION)
10.2 AMERICAS
FIGURE 32 AMERICAS: SNAPSHOT OF DISTRICT HEATING MARKET
TABLE 49 AMERICAS: MARKET, BY COUNTRY, 2018–2021 (USD BILLION)
TABLE 50 AMERICAS: MARKET, BY COUNTRY, 2022–2027 (USD BILLION)
TABLE 51 AMERICAS: MARKET, BY APPLICATION, 2018–2021 (USD BILLION)
TABLE 52 AMERICAS: MARKET, BY APPLICATION, 2022–2027 (USD BILLION)
TABLE 53 AMERICAS: MARKET, BY HEAT SOURCE, 2018–2021 (USD BILLION)
TABLE 54 AMERICAS: MARKET, BY HEAT SOURCE, 2022–2027 (USD BILLION)
TABLE 55 AMERICAS: MARKET, PLANT TYPE, 2018–2021 (USD BILLION)
TABLE 56 AMERICAS: MARKET, PLANT TYPE, 2022–2027 (USD BILLION)
10.2.1 US
10.2.1.1 Growing modern construction techniques in residential and commercial buildings
TABLE 57 US: MARKET, BY APPLICATION, 2018–2021 (USD BILLION)
TABLE 58 US: INDUSTRY, BY APPLICATION, 2022–2027 (USD BILLION)
TABLE 59 US: MARKET, BY HEAT SOURCE, 2018–2021 (USD MILLION)
TABLE 60 US: MARKET, BY HEAT SOURCE, 2022–2027 (USD MILLION)
TABLE 61 US: MARKET, PLANT TYPE, 2018–2021 (USD BILLION)
TABLE 62 US: MARKET, PLANT TYPE, 2022–2027 (USD BILLION)
10.2.2 CANADA
10.2.2.1 Rising government initiatives to reduce greenhouse gas emissions
TABLE 63 CANADA: MARKET, BY APPLICATION, 2018–2021 (USD BILLION)
TABLE 64 CANADA: MARKET, BY APPLICATION, 2022–2027 (USD BILLION)
TABLE 65 CANADA: DISTRICT HEATING MARKET, BY HEAT SOURCE, 2018–2021 (USD MILLION)
TABLE 66 CANADA: MARKET, BY HEAT SOURCE, 2022–2027 (USD MILLION)
TABLE 67 CANADA: MARKET, PLANT TYPE, 2018–2021 (USD BILLION)
TABLE 68 CANADA: MARKET, PLANT TYPE, 2022–2027 (USD BILLION)
10.2.3 SOUTH AMERICA
10.2.3.1 Surging government initiatives to increase public-private partnerships to scale up district heating
TABLE 69 SOUTH AMERICA: MARKET, BY APPLICATION, 2018–2021 (USD BILLION)
TABLE 70 SOUTH AMERICA: MARKET, BY APPLICATION, 2022–2027 (USD BILLION)
TABLE 71 SOUTH AMERICA: MARKET, BY HEAT SOURCE, 2018–2021 (USD MILLION)
TABLE 72 SOUTH AMERICA: MARKET, BY HEAT SOURCE, 2022–2027 (USD MILLION)
TABLE 73 SOUTH AMERICA: MARKET, PLANT TYPE, 2018–2021 (USD MILLION)
TABLE 74 SOUTH AMERICA: MARKET, PLANT TYPE, 2022–2027 (USD MILLION)
10.3 EUROPE
FIGURE 33 EUROPE: SNAPSHOT OF DISTRICT HEATING INDUSTRY
TABLE 75 EUROPE: MARKET, BY COUNTRY, 2018–2021 (USD BILLION)
TABLE 76 EUROPE: MARKET, BY COUNTRY, 2022–2027 (USD BILLION)
TABLE 77 EUROPE: MARKET, BY APPLICATION, 2018–2021 (USD BILLION)
TABLE 78 EUROPE: MARKET, BY APPLICATION, 2022–2027 (USD BILLION)
FIGURE 34 RESIDENTIAL SEGMENT IS PROJECTED TO OCCUPY LARGEST SHARE OF MARKET IN EUROPE IN 2027
TABLE 79 EUROPE: MARKET, BY HEAT SOURCE, 2018–2021 (USD BILLION)
TABLE 80 EUROPE: MARKET, BY HEAT SOURCE, 2022–2027 (USD BILLION)
TABLE 81 EUROPE: MARKET, PLANT TYPE, 2018–2021 (USD BILLION)
TABLE 82 EUROPE: MARKET, PLANT TYPE, 2022–2027 (USD BILLION)
10.3.1 GERMANY
10.3.1.1 Increasing number of new district heating networks
TABLE 83 GERMANY: MARKET, BY APPLICATION, 2018–2021 (USD BILLION)
TABLE 84 GERMANY: MARKET, BY APPLICATION, 2022–2027 (USD BILLION)
TABLE 85 GERMANY: MARKET, BY HEAT SOURCE, 2018–2021 (USD BILLION)
TABLE 86 GERMANY: DISTRICT HEATING MARKET, BY HEAT SOURCE, 2022–2027 (USD BILLION)
TABLE 87 GERMANY: MARKET, PLANT TYPE, 2018–2021 (USD BILLION)
TABLE 88 GERMANY: MARKET, PLANT TYPE, 2022–2027 (USD BILLION)
10.3.2 FRANCE
10.3.2.1 Rising residential building permits and low housing loan interest rates
TABLE 89 FRANCE: MARKET, BY APPLICATION, 2018–2021 (USD BILLION)
TABLE 90 FRANCE: MARKET, BY APPLICATION, 2022–2027 (USD BILLION)
TABLE 91 FRANCE: INDUSTRY, BY HEAT SOURCE, 2018–2021 (USD MILLION)
TABLE 92 FRANCE: MARKET, BY HEAT SOURCE, 2022–2027 (USD MILLION)
TABLE 93 FRANCE: MARKET, PLANT TYPE, 2018–2021 (USD BILLION)
TABLE 94 FRANCE: MARKET, PLANT TYPE, 2022–2027 (USD BILLION)
10.3.3 UK
10.3.3.1 Increasing government initiatives to achieve net-zero greenhouse gas emissions
TABLE 95 UK: MARKET, BY APPLICATION, 2018–2021 (USD BILLION)
TABLE 96 UK: MARKET, BY APPLICATION, 2022–2027 (USD BILLION)
TABLE 97 UK: MARKET, BY HEAT SOURCE, 2018–2021 (USD MILLION)
TABLE 98 UK: DISTRICT HEATING MARKET SIZE, BY HEAT SOURCE, 2022–2027 (USD MILLION)
TABLE 99 UK: MARKET, PLANT TYPE, 2018–2021 (USD BILLION)
TABLE 100 UK: MARKET, PLANT TYPE, 2022–2027 (USD BILLION)
10.3.4 RUSSIA
10.3.4.1 Russia has largest and oldest district heating systems globally
TABLE 101 RUSSIA: MARKET, BY APPLICATION, 2018–2021 (USD BILLION)
TABLE 102 RUSSIA: MARKET, BY APPLICATION, 2022–2027 (USD BILLION)
TABLE 103 RUSSIA: MARKET, BY HEAT SOURCE, 2018–2021 (USD BILLION)
TABLE 104 RUSSIA: MARKET, BY HEAT SOURCE, 2022–2027 (USD BILLION)
TABLE 105 RUSSIA: MARKET, PLANT TYPE, 2018–2021 (USD BILLION)
TABLE 106 RUSSIA: MARKET, PLANT TYPE, 2022–2027 (USD BILLION)
10.3.5 SWEDEN
10.3.5.1 Sweden has world’s most integrated and developed systems for district heating
TABLE 107 SWEDEN: MARKET, BY APPLICATION, 2018–2021 (USD BILLION)
TABLE 108 SWEDEN: MARKET, BY APPLICATION, 2022–2027 (USD BILLION)
TABLE 109 SWEDEN: MARKET, BY HEAT SOURCE, 2018–2021 (USD BILLION)
TABLE 110 SWEDEN: MARKET, BY HEAT SOURCE, 2022–2027 (USD BILLION)
TABLE 111 SWEDEN: MARKET, PLANT TYPE, 2018–2021 (USD BILLION)
TABLE 112 SWEDEN: DISTRICT HEATING MARKET, PLANT TYPE, 2022–2027 (USD BILLION)
10.3.6 DENMARK
10.3.6.1 Denmark has six large central district-heating areas
TABLE 113 DENMARK: MARKET, BY APPLICATION, 2018–2021 (USD BILLION)
TABLE 114 DENMARK: MARKET, BY APPLICATION, 2022–2027 (USD BILLION)
TABLE 115 DENMARK: MARKET, BY HEAT SOURCE, 2018–2021 (USD MILLION)
TABLE 116 DENMARK: MARKET, BY HEAT SOURCE, 2022–2027 (USD MILLION)
TABLE 117 DENMARK: MARKET, PLANT TYPE, 2018–2021 (USD BILLION)
TABLE 118 DENMARK: MARKET, PLANT TYPE, 2022–2027 (USD BILLION)
10.3.7 OTHER SCANDINAVIAN COUNTRIES
TABLE 119 OTHER SCANDINAVIAN COUNTRIES: MARKET, BY APPLICATION, 2018–2021 (USD BILLION)
TABLE 120 OTHER SCANDINAVIAN COUNTRIES: MARKET, BY APPLICATION, 2022–2027 (USD BILLION)
TABLE 121 OTHER SCANDINAVIAN COUNTRIES: MARKET, BY HEAT SOURCE, 2018–2021 (USD BILLION)
TABLE 122 OTHER SCANDINAVIAN COUNTRIES: MARKET, BY HEAT SOURCE, 2022–2027 (USD BILLION)
TABLE 123 OTHER SCANDINAVIAN COUNTRIES: MARKET, PLANT TYPE, 2018–2021 (USD BILLION)
TABLE 124 OTHER SCANDINAVIAN COUNTRIES: MARKET, PLANT TYPE, 2022–2027 (USD BILLION)
10.3.8 REST OF EUROPE
TABLE 125 REST OF EUROPE: MARKET, BY APPLICATION, 2018–2021 (USD BILLION)
TABLE 126 REST OF EUROPE: MARKET, BY APPLICATION, 2022–2027 (USD BILLION)
TABLE 127 REST OF EUROPE: MARKET, BY HEAT SOURCE, 2018–2021 (USD MILLION)
TABLE 128 REST OF EUROPE: MARKET, BY HEAT SOURCE, 2022–2027 (USD MILLION)
TABLE 129 REST OF EUROPE: MARKET, PLANT TYPE, 2018–2021 (USD BILLION)
TABLE 130 REST OF EUROPE: MARKET, PLANT TYPE, 2022–2027 (USD BILLION)
10.4 ASIA PACIFIC
FIGURE 35 ASIA PACIFIC: SNAPSHOT OF MARKET
TABLE 131 ASIA PACIFIC: MARKET, BY COUNTRY, 2018–2021 (USD BILLION)
TABLE 132 ASIA PACIFIC: MARKET, BY COUNTRY, 2022–2027 (USD BILLION)
TABLE 133 ASIA PACIFIC: MARKET, BY APPLICATION, 2018–2021 (USD BILLION)
TABLE 134 ASIA PACIFIC: MARKET, BY APPLICATION, 2022–2027 (USD BILLION)
FIGURE 36 RESIDENTIAL SEGMENT IS PROJECTED TO OCCUPY LARGEST SHARE OF MARKET IN ASIA PACIFIC IN 2027
TABLE 135 ASIA PACIFIC: MARKET, BY HEAT SOURCE, 2018–2021 (USD BILLION)
TABLE 136 ASIA PACIFIC: MARKET, BY HEAT SOURCE, 2022–2027 (USD BILLION)
TABLE 137 ASIA PACIFIC: MARKET, PLANT TYPE, 2018–2021 (USD BILLION)
TABLE 138 ASIA PACIFIC: MARKET, PLANT TYPE, 2022–2027 (USD BILLION)
10.4.1 CHINA
10.4.1.1 Rapidly growing urbanization to propel market growth
TABLE 139 CHINA: MARKET, BY APPLICATION, 2018–2021 (USD BILLION)
TABLE 140 CHINA: MARKET, BY APPLICATION, 2022–2027 (USD BILLION)
TABLE 141 CHINA: MARKET, BY HEAT SOURCE, 2018–2021 (USD BILLION)
TABLE 142 CHINA: MARKET, BY HEAT SOURCE, 2022–2027 (USD BILLION)
TABLE 143 CHINA: MARKET, PLANT TYPE, 2018–2021 (USD BILLION)
TABLE 144 CHINA: DISTRICT HEATING ECOSYSTEM, PLANT TYPE, 2022–2027 (USD BILLION)
10.4.2 JAPAN
10.4.2.1 Growing government initiatives to drive market
TABLE 145 JAPAN: MARKET, BY APPLICATION, 2018–2021 (USD BILLION)
TABLE 146 JAPAN: MARKET, BY APPLICATION, 2022–2027 (USD BILLION)
TABLE 147 JAPAN: MARKET, BY HEAT SOURCE, 2018–2021 (USD BILLION)
TABLE 148 JAPAN: MARKET, BY HEAT SOURCE, 2022–2027 (USD BILLION)
TABLE 149 JAPAN: MARKET, PLANT TYPE, 2018–2021 (USD BILLION)
TABLE 150 JAPAN: MARKET, PLANT TYPE, 2022–2027 (USD BILLION)
10.4.3 SOUTH KOREA
10.4.3.1 Continuously increasing households connected with district heating
TABLE 151 SOUTH KOREA: MARKET, BY APPLICATION, 2018–2021 (USD BILLION)
TABLE 152 SOUTH KOREA: MARKET, BY APPLICATION, 2022–2027 (USD BILLION)
TABLE 153 SOUTH KOREA: MARKET, BY HEAT SOURCE, 2018–2021 (USD BILLION)
TABLE 154 SOUTH KOREA: MARKET, BY HEAT SOURCE, 2022–2027 (USD BILLION)
TABLE 155 SOUTH KOREA: MARKET, PLANT TYPE, 2018–2021 (USD BILLION)
TABLE 156 SOUTH KOREA: MARKET, PLANT TYPE, 2022–2027 (USD BILLION)
11 COMPETITIVE LANDSCAPE (Page No. - 143)
11.1 OVERVIEW
11.2 5-YEAR COMPANY REVENUE ANALYSIS
FIGURE 37 5-YEAR REVENUE ANALYSIS OF TOP FIVE PLAYERS IN MARKET, 2017 TO 2021
11.3 COMPANY EVALUATION QUADRANT
11.3.1 STARS
11.3.2 EMERGING LEADERS
11.3.3 PERVASIVE PLAYERS
11.3.4 PARTICIPANTS
FIGURE 38 DISTRICT HEATING INDUSTRY: KEY COMPANY EVALUATION QUADRANT, 2021
11.4 COMPANY FOOTPRINT
TABLE 157 COMPANY FOOTPRINT: DISTRICT HEATING MARKET
TABLE 158 COMPANY HEAT SOURCE FOOTPRINT: MARKET
TABLE 159 COMPANY APPLICATION FOOTPRINT: MARKET
TABLE 160 COMPANY REGION FOOTPRINT: MARKET
11.5 START-UPS/SMALL AND MEDIUM-SIZED ENTERPRISES (SME) EVALUATION MATRIX
TABLE 161 LIST OF KEY SMES/START-UPS IN MARKET
TABLE 162 START-UPS/SMALL AND MEDIUM-SIZED ENTERPRISES (SMES) IN DISTRICT HEATING INDUSTRY
TABLE 163 MARKET: COMPETITIVE BENCHMARKING OF KEY START-UPS/SMES (APPLICATION FOOTPRINT)
TABLE 164 MARKET: COMPETITIVE BENCHMARKING OF KEY START-UPS/SMES (REGION FOOTPRINT)
11.5.1 PROGRESSIVE COMPANIES
11.5.2 RESPONSIVE COMPANIES
11.5.3 DYNAMIC COMPANIES
11.5.4 STARTING BLOCKS
FIGURE 39 START-UPS/SME EVALUATION MATRIX
11.6 COMPETITIVE SCENARIOS AND TRENDS
11.6.1 PRODUCT LAUNCHES
TABLE 165 PRODUCT LAUNCHES, MAY 2020–APRIL 2022
11.6.2 DEALS
TABLE 166 DEALS, MAY 2020–APRIL 2022
12 COMPANY PROFILES (Page No. - 158)
12.1 KEY PLAYERS
(Business Overview, Products/Services/Solutions Offered, Recent Developments, and MnM View)*
12.1.1 FORTUM
TABLE 167 FORTUM: COMPANY OVERVIEW
FIGURE 40 FORTUM: COMPANY SNAPSHOT
12.1.2 VATTENFALL
TABLE 168 VATTENFALL: COMPANY OVERVIEW
FIGURE 41 VATTENFALL: COMPANY SNAPSHOT
12.1.3 ENGIE
TABLE 169 ENGIE: COMPANY OVERVIEW
FIGURE 42 ENGIE: COMPANY SNAPSHOT
12.1.4 DANFOSS
TABLE 170 DANFOSS: COMPANY OVERVIEW
FIGURE 43 DANFOSS: COMPANY SNAPSHOT
12.1.5 STATKRAFT
TABLE 171 STATKRAFT: COMPANY OVERVIEW
FIGURE 44 STATKRAFT: COMPANY SNAPSHOT
12.1.6 LOGSTOR
TABLE 172 LOGSTOR: COMPANY OVERVIEW
12.1.7 VITAL ENERGI
TABLE 173 VITAL ENERGI: COMPANY OVERVIEW
12.1.8 KELAG
TABLE 174 KELAG: COMPANY OVERVIEW
12.1.9 SHINRYO CORPORATION
TABLE 175 SHINRYO CORPORATION: COMPANY OVERVIEW
FIGURE 45 SHINRYO CORPORATION: COMPANY SNAPSHOT
* Business Overview, Products/Services/Solutions Offered, Recent Developments, and MnM View might not be captured in case of unlisted companies.
12.2 OTHER PLAYERS
12.2.1 GOTEBORG ENERGI
12.2.2 GENERAL ELECTRIC
12.2.3 FVB ENERGY
12.2.4 ALFA LAVAL
12.2.5 RAMBOLL GROUP
12.2.6 SAVON VOIMA
12.2.7 ENWAVE ENERGY
12.2.8 ORSTED
12.2.9 HELEN LTD
12.2.10 KEPPEL CORPORATION
12.2.11 STEAG GMBH
12.2.12 HAFSLUND ECO
12.2.13 CLEARWAY COMMUNITY ENERGY
12.2.14 UNIPER SE
12.2.15 VEOLIA
12.2.16 DALL ENERGY
13 APPENDIX (Page No. - 204)
13.1 DISCUSSION GUIDE
13.2 KNOWLEDGESTORE: MARKETSANDMARKETS’ SUBSCRIPTION PORTAL
13.3 CUSTOMIZATION OPTIONS
13.4 RELATED REPORTS
13.5 AUTHOR DETAILS
The study involved four major activities in estimating the size of the district heating market. Exhaustive secondary research has been carried out to collect information on the market, the peer markets, and the parent market. Both top-down and bottom-up approaches have been employed to estimate the total market size. Market breakdown and data triangulation methods have also been used to estimate the market for segments and subsegments.
Secondary Research
Revenues of companies offering district heating have been obtained from the secondary data available through paid and unpaid sources. The revenues have also been derived by analyzing the product portfolio of key companies, and these companies have been rated according to the performance and quality of their products.
In the secondary research process, various sources have been referred to for identifying and collecting information for this study on the district heating industry. Secondary sources considered for this research study include government sources; corporate filings; and trade, business, and professional associations. Secondary data has been collected and analyzed to arrive at the overall market size, which has been further validated through primary research.
Secondary research has been mainly used to obtain key information about the supply chain of district heating to identify key players based on their products and prevailing industry trends in the district heating market by heat source, by plant type, application, and region. Secondary research also helped obtain market information- and technology-oriented key developments undertaken by market players to expand their presence and increase their market share.
Primary Research
Extensive primary research has been conducted after understanding and analyzing the current scenario of market through secondary research. Several primary interviews have been conducted with the key opinion leaders from demand and supply sides across four main regions—the Americas, Europe, and Asia Pacific. Approximately 25% of the primary interviews have been conducted with the demand-side respondents, while approximately 75% have been conducted with the supply-side respondents. The primary data has been collected through questionnaires, emails, and telephonic interviews
After interacting with industry experts, brief sessions were conducted with highly experienced independent consultants to reinforce the findings from our primaries. This, along with the in-house subject matter experts’ opinions, has led us to the findings as described in the remainder of this report. The breakdown of primary respondents is as follows:
To know about the assumptions considered for the study, download the pdf brochure
Market Size Estimation
The bottom-up procedure has been employed to arrive at the overall size of the district heating market.
- Identifying approximate revenues of companies involved in the district heating ecosystem
- Identifying different offerings of district heating
- Analyzing the global penetration of each offering of district heating through secondary and primary research
- Conducting multiple discussion sessions with key opinion leaders to understand the district heating systems and their applications; analyzing the breakup of the work carried out by each key company
- Verifying and crosschecking estimates at every level with key opinion leaders, including chief executive officers (CEO), directors, and operation managers, and then finally, with the domain experts of MarketsandMarkets
- Studying various paid and unpaid sources of information such as press releases, white papers, and databases of the company- and region-specific developments undertaken in market
The top-down approach has been used to estimate and validate the total size of market.
- Focusing initially on the top-line investments and expenditures made in the district heating ecosystem; further splitting into offering and listing key developments in key market areas
- Identifying all major players offering a variety of district heating systems, which were verified through secondary research and a brief discussion with industry experts
- Analyzing revenues, product mix, and geographic presence for which district heating systems are offered by all identified players to estimate and arrive at the percentage splits for all key segments
- Discussing these splits with industry experts to validate the information and identify key growth domains across all major segments
- Breaking down the total market based on verified splits and key growth domains across all segments
Data Triangulation
After arriving at the overall market size-using the market size estimation processes as explained above—the market has been split into several segments and subsegments. To complete the entire market engineering process and arrive at the exact statistics of each market segment and subsegment, data triangulation, and market breakdown procedures have been employed, wherever applicable. The data has been triangulated by studying various factors and trends from both the demand and supply sides in the district heating market.
Report Objectives
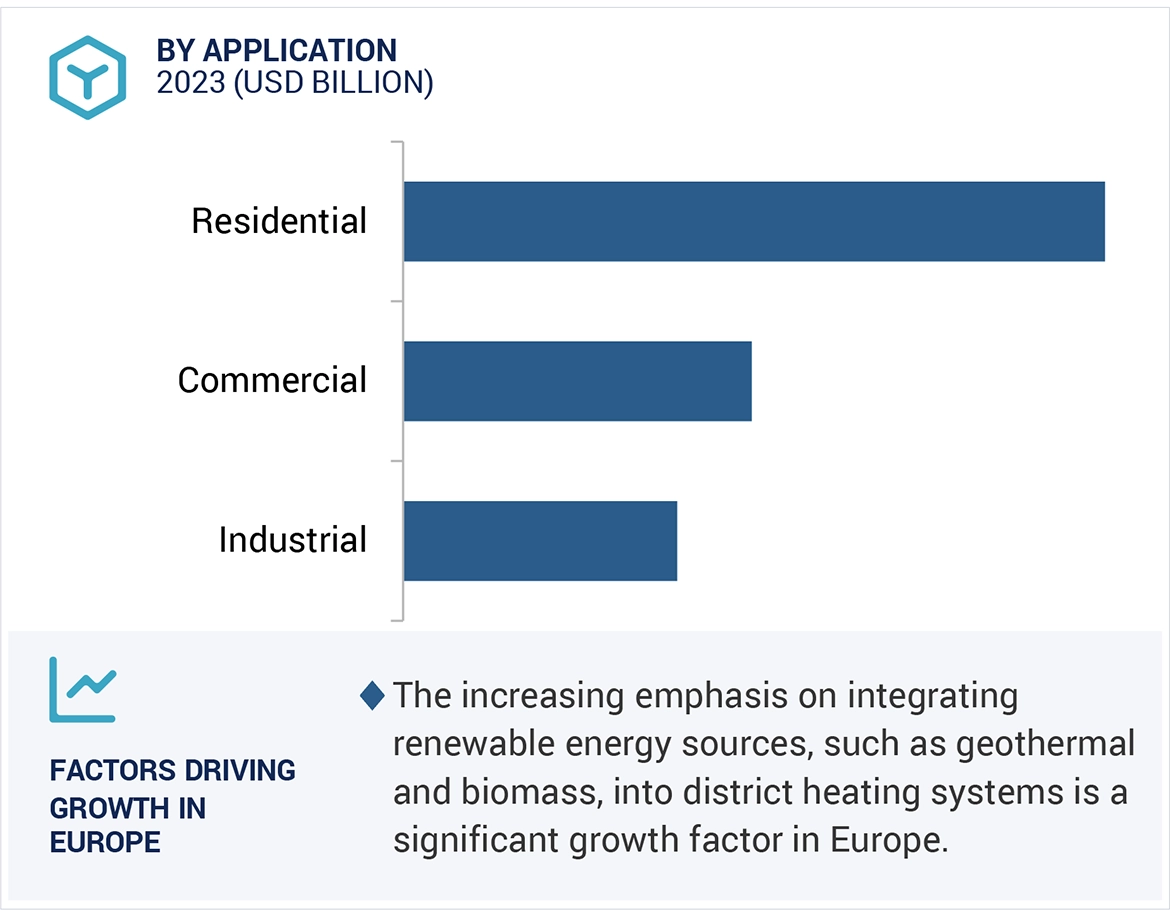
- To describe and forecast the size of the district heating industry, in terms of value, by heat source, plant type, and application
- To describe and forecast the market size of various segments across three key regions—the Americas, Europe, and Asia Pacific, in terms of value
- To provide detailed information regarding the drivers, restraints, opportunities, and challenges influencing the growth of market
- To provide an overview of the value chain pertaining to the district heating ecosystem, along with the average selling prices of district heating systems
- To strategically analyze the ecosystem, tariffs and regulations, patent landscape, Porter’s five forces, regulations, import and export scenarios, trade landscape, and case studies pertaining to the market under study
- To strategically analyze micromarkets1 with regard to individual growth trends, prospects, and contributions to the overall market
- To analyze opportunities in the market for stakeholders by identifying high-growth segments
- To provide details of the competitive landscape for market leaders
- To analyze competitive developments such as product launches and developments, agreements, partnerships, acquisitions, and collaborations in the district heating ecosystem
- To profile key players in market and comprehensively analyze their market ranking based on their revenue, market share, and core competencies2
- Updated market developments of profiled players: The current report includes the market developments from May 2020 to April 2022.
Available customizations:
With the given market data, MarketsandMarkets offers customizations according to the specific requirements of companies. The following customization options are available for the report:
- Detailed analysis and profiling of additional market players based on various blocks of the supply chain
Growth opportunities and latent adjacency in District Heating Market