Feed Flavors and Sweeteners Market by Type (Feed Flavors and Feed Sweeteners), Livestock (Ruminants, Swine, Poultry, Aquatic Animals), Form (Dry and Liquid), Source (Natural and Synthetic) and Region - Global Forecast to 2022


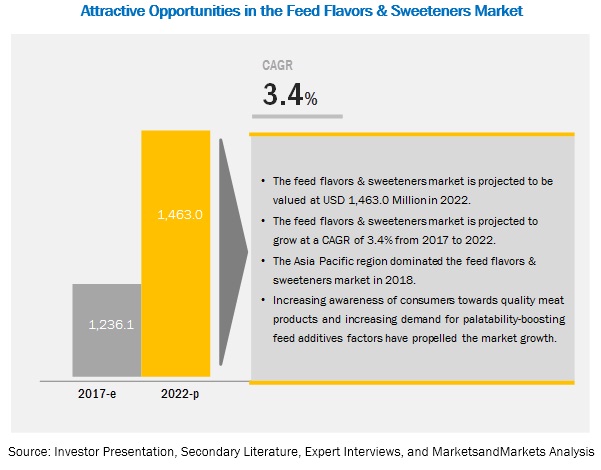
[153 Pages Report] MarketsandMarkets forecasts the feed flavors & sweeteners market to grow from USD 1.2 billion in 2017 to USD 1.5 billion by 2022, at a Compound Annual Growth Rate (CAGR) of 3.4% during the forecast period. The major factors that are expected to be driving the feed flavors & sweeteners market are increasing demand for palatability-boosting feed additives and increasing awareness of consumers towards quality meat products. The objective of the report is to define, describe, and forecast the feed flavors & sweeteners market size based on type, livestock, source, form, and region
See how this study impacted revenues for other players in Feed Flavors and Sweeteners Market
Client’s Problem Statement
The client approached MarketsandMarkets for advice on the commercialization of their range of feed flavors and sweeteners in the North American region. The client wanted to expand market presence in the Americas so as to reduce the competition in the market.
MnM Approach
MnM provided detailed information on the various product launches and the competitive brands in the market. The report was able to answer key concerns about future markets, key players, and competitive strategies, and emerging technologies.
Revenue Impact (RI)
Our report on the feed flavors and sweeteners market estimated the market potential at USD 1.5 billion by 2023 and provided a detailed analysis of the various largest and fastest-growing markets. It also offered insights into the possible areas for investments. MnM’s advisory body was able to assist the client in identifying the appropriate distribution partner for the penetration of their products in the North American market. The client is looking forward to more such collaborations with MarketsandMarkets. This is because our report helped them analyze and suggested acquisitions in the flavors market. For instance, the client acquired the North American coatings and seasonings business of Southeastern Mills based in Rome, Georgia, that complemented the performance in meat. Our findings helped them in their analysis and acquisition. This company complements its ingredient systems to deliver superior flavors and textures for meat products. This is expected to boost its revenue in the Southern US by ~USD 5 million.
By type, the flavors segment is expected to grow at the highest growth rate during the forecast period
Among the types segment, the flavors segment is expected to grow at the highest CAGR during the forecast period. Feed flavors enhance the taste and smell of feed to maintain feed consumption by maximizing feed intake, thereby improving the performance of the livestock.
By livestock, the swine segment to record the highest CAGR during the forecast period
The swine livestock type is expected to witness a faster growth rate in this market, as swine experiences various physical, physiological, and behavioral changes during these three different phases of their lifespan that may lead to the decreased feed intake and extreme weight loss. To evade these problems, palatants feed additives such as sweeteners and flavors are mixed in the diets of pigs. These additives aid in increasing the feed intake and improve growth performance of these animals.
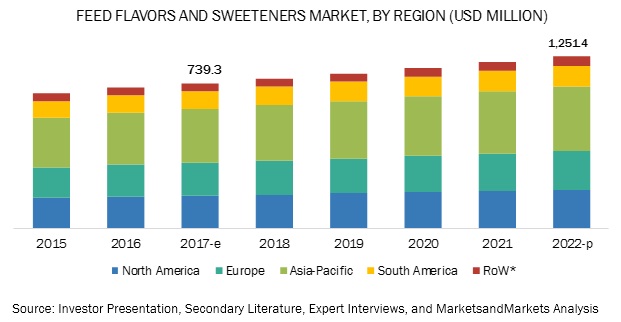
Asia Pacific to account for the largest market size during the forecast period.
Asia Pacific is expected to hold the largest market size in the feed flavors & sweeteners market during the forecast period, followed by the European region. The highest market share of Asia Pacific is due to ise in disposable income has led to an increase in urbanization and rapid industrialization. The region is heterogeneous, with diversity in income level, technology, and demands of end consumers to provide superior-quality feed to livestock, as the awareness among the consumers regarding the impact of quality feed provided to the livestock on the quality of the animal-based products is increasing, leading to enhanced scope for future growth.
Market Dynamics
Driver: Increasing awareness of consumers towards quality meat products
Consumers all over the globe are increasingly demanding quality meat due to the growing awareness regarding the nutritional dynamics of these products. According to The Food and Agriculture Organization (FAO), animals provide over 33% of protein consumed in human diets and around 16% of food energy. Besides, income growth, urbanization, and changes in lifestyles are the major factors impacting the demand for high-quality food. Consumers are now becoming more aware of the quality of food they consume, and the benefits associated with food products. As a result, the production of healthy and quality livestock has become important, leading to the surge in demand for quality feed with better palatability. Therefore, flavors and sweeteners products are anticipated to experience a robust demand in coming years.
Owing to the consumers’ rising demand for superior-quality meat products, high-end food service sector and supermarkets offering premium brands are now constantly demanding quality meat. This factor instigated livestock producers to provide quality and healthy livestock in order to satisfy the quality standards required by various food players and different markets across the globe. According to The Australian Competition and Consumer Commission (ACCC), “Exports to the European Union are largely high-quality products servicing the high-end food service sector and premium supermarket brands. The need to meet quality and import requirements results in processors sourcing cattle against stringent specifications. These import and quality requirements also mean that cattle producers specialize in preparing animals for the EU market to a certain extent.” To be able to fulfill such quality standards, livestock producers all over the world are emphasizing on animal diet as well as on food additives that increase the feed intake of livestock.
Restraints: Lack of awareness in developing countries
The livestock sector is still evolving in developing countries such as Argentina, India and Brazil. However, a majority of these countries still depend on forages, crop residue, and open grazing to feed the livestock and do not emphasize on the feed quality or palatability. According to the Planning Commission of India (now replaced by successor think tank National Institution for Transforming India), “only about half of the annual fodder requirement is met from the cultivated fodder and crop residues, whereas open grazing and fodder availability from common property resources like forests, pastures, village commons, etc. fulfills the remaining half of the annual fodder requirement.” These conventional methods of feeding animals restrict the growth of the commercial animal feed industry and thereby the growth of the animal feed additives market. Livestock producers and farmers in these countries are still unaware regarding feed additives such as flavors and sweeteners and benefits associated with them. Highly populous and rapidly developing countries, such as India, where livestock production is a major part of agriculture economy are yet to evolve in terms of modern feed additives solution. Nevertheless, better promotional and educational activities about the benefits of flavors and sweeteners products may create huge potential for palatable feed additives in these countries.
Opportunity: Implementation of standardized and commercial husbandry practices to improve the quality of meat products
The rising meat consumption along with growing demand for quality meat products has increased the importance of quality feed as well as better and palatable feed additives in the livestock industry. Increase in the per capita income, improved standard of living, and rise in awareness towards better health has subsequently resulted into the increased demand for quality protein food sources such as meat and other animal-based products. In response to the growing demand for these products, standardized and commercial animal husbandry techniques and practices came into existence and are widely being adopted all over the globe. Better hygiene, animal health programs, and provision of premium quality animal feed with better taste and texture are some of the important factors that are emphasized by these husbandries so that quality meat and dairy products will be produced pertaining to the standards set by regulatory bodies.
Government monitoring agencies such as the U.S. Food and Drug Administration (USFDA) and European Food Safety Authority have imposed rules regarding the quality of food that is to be delivered to consumers. According to the FDA, meat composition, fat content, color, flavor, and protein content are some of the attributes that define the quality of meat. Hence, to fulfill these quality standards and to produce healthy livestock, a huge demand for effective and palatability enhancing feed ingredients is observed from several husbandries and commercial farms. Thus, increasing number of standardized husbandries and commercial farms are anticipated to build new opportunities for feed flavors and sweeteners players.
Challenge: Fluctuating price of raw materials
The fluctuating price of raw materials is the major challenge being faced by feed flavors and sweeteners players. The prices of raw materials such as citrus fruits and butter are highly unstable, which result in the high cost of production and impacts the prices of the final products. Citrus flavored feeds are majorly consumed by livestock animals compared to other flavors, and therefore they are demanded by livestock producers. However, the fluctuation in the prices of citrus fruits such as orange and grapefruit has been a significant challenge for animal feed flavor producers and has been impacting the price of final citrus flavor feed products.
Scope of the Report
|
Report Metric |
Details |
|
Market size available for years |
2016–2022 |
|
Base year considered |
2016 |
|
Forecast period |
2017–2022 |
|
Forecast units |
Million (USD) |
|
Segments covered |
Type (feed flavors and sweeteners), Livestock (ruminants, swine, poultry, aquatic animals, and others), Form (dry, liquid), Source (natural and synthetic), and Region |
|
Geographies covered |
North America, Europe, Asia Pacific, South America, and Row |
|
Companies covered |
Nutriad International Dendermonde (Belgium), and Pancosma (Switzerland), Alltech (U.S.), FeedStimulants (Netherlands) and BIOMIN Holding GmbH (Austria), DuPont (US), Norel S.A. (Spain) and Prinova Group LLC (US), Agri-Flavors, Inc. (US), Origination O2D, Inc. (US), Kerry Group Plc (Ireland) and Pestell Minerals & Ingredients Inc. (Canada). |
The research report categorizes the feed flavors & sweeteners to forecast the revenues and analyze the trends in each of the following sub-segments:
The Feed Flavors & Sweeteners Market, By Type:
- Feed flavors
- Feed sweeteners
The Feed Flavors & Sweeteners Market By Livestock:
- Ruminants
- Swine
- Poultry
- Aquatic animals
- Others
The Feed Flavors & Sweeteners Market By Form:
- Dry
- Liquid
The Feed Flavors & Sweeteners Market By Source:
- Natural
- Synthetic
The Feed Flavors & Sweeteners Market By Region:
- North America
- Europe
- Asia Pacific
- South America
- RoW
Key Market Players
Nutriad International Dendermonde (Belgium), and Pancosma (Switzerland), Alltech (U.S.), FeedStimulants (Netherlands) and BIOMIN Holding GmbH (Austria), DuPont (US), Norel S.A. (Spain) and Prinova Group LLC (US), Agri-Flavors, Inc. (US), Origination O2D, Inc. (US), Kerry Group Plc (Ireland) and Pestell Minerals & Ingredients Inc. (Canada).
Nutriad International Dendermonde (Belgium), and Pancosma (Switzerland) are the visionary leaders in the animal feed flavors and sweeteners market. These players have broad product offerings that cater to most of the regions, globally. Visionary leaders primarily focus on acquiring the leading market position through their strong financial capabilities and their well-established brand equity.
Recent Developments
- In May 2017, Alltech acquired WestFeeds, which is one of the leading feed nutrition company in Montana. WestFeeds has a strong reputation as a producer of high-quality animal nutrition products which would help Alltech to fulfil the nutrition requirement of the North American livestock producers and also strengthen its market position in this region.
- In June 2017, Norel opened a new branch ‘Norel Brasil’ in Sao Paulo, Brazil. This expansion helped this company to introduce its products into the Brazilian market. It is a great opportunity for this company to service directly Norel core products such as organic minerals, flavors, butyrates, medium chain fatty acid salts, preservatives, fats or rumen enhancers into this competitive market.
- In March 2017, Nutriad opened a new palatability factory in Nantong, China. Flavors and sweeteners products would be manufactured in this new state-of-the-art production facility. In addition, the newest recently developed palatability products developed from their laboratories in Europe will be produced in this facility in future.
- In October 2016, Norel launched APETENZYMA 1590 TS, which is an innovative molasses flavor. It is reinforced with the sweet taste from stevia and thaumatine. This new flavor gives a highly attractive and persistent molasses smell to the feed and also confers a smooth and lasting sweetness.
Critical questions the report answers:
- Where will all these developments take the industry in the long term?
- What are the upcoming trends for the feed flavors & sweeteners market?
- Which segment provides the most opportunity for growth?
- Who are the leading vendors operating in this market?
- What are the opportunities for new market entrants?
To speak to our analyst for a discussion on the above findings, click Speak to Analyst
 Exclusive indicates content/data unique to MarketsandMarkets and not available with any competitors.
Table of Contents
1 Introduction (Page No. - 14)
1.1 Objectives of the Study
1.2 Market Definition
1.3 Market Scope
1.4 Periodization Considered
1.5 Currency Considered
1.6 Units Considered
1.7 Stakeholders
2 Research Methodology (Page No. - 18)
2.1 Research Data
2.1.1 Secondary Research
2.1.2 Primary Research
2.1.2.1 Breakdown of Primaries
2.2 Market Size Estimation
2.3 Market Breakdown & Data Triangulation
2.4 Macroeconomic Indicators
2.4.1 Growth in the Animal Feed Production
2.4.2 Growing Livestock Population
2.5 Assumptions
2.6 Limitations
3 Executive Summary (Page No. - 26)
4 Premium Insights (Page No. - 30)
4.1 Opportunities in the Global Market
4.2 Feed Flavors & Sweeteners Market, By Type & Region
4.3 Asia-Pacific: Feed Flavors & Sweeteners Market, By Livestock & Country
4.4 Market, By Livestock & Region
4.5 Market, By Source, 2017 vs 2022
4.6 Market, By Form, 2017 vs 2022
4.7 Feed Flavors and Sweeteners Market, By Sub-Type
4.8 Feed Sweeteners Market, By Type & Region
5 Market Overview (Page No. - 34)
5.1 Market Dynamics
5.1.1 Introduction
5.1.2 Drivers
5.1.2.1 Increasing Awareness of Consumers Towards Quality Meat Products
5.1.2.2 Increasing Demand for Palatability-Boosting Feed Additives
5.1.2.3 Growing Meat and Dairy Products Industries
5.1.3 Restraints
5.1.3.1 Lack of Awareness in Developing Countries
5.1.4 Opportunities
5.1.4.1 Implementation of Standardized and Commercial Husbandry Practices to Improve the Quality of Meat Products
5.1.5 Challenges
5.1.5.1 Fluctuating Price of Raw Materials
5.2 Value Chain
5.3 Supply Chain
5.4 Regulatory Framework
5.4.1 Introduction
5.4.1.1 North American Regulations
5.4.1.2 European Regulations
5.4.1.3 Other Regulations
6 Market for Feed Flavors & Sweeteners, By Type (Page No. - 46)
6.1 Introduction
6.2 Feed Flavors
6.2.1 Fruits
6.2.2 Spices
6.2.3 Butter
6.2.4 Others
6.3 Feed Sweeteners
6.3.1 Glycyrrhizin
6.3.2 Saccharine
6.3.3 Neohesperidine Dihydrochalcone
6.3.4 Others
7 Market for Feed Flavors & Sweeteners, By Livestock (Page No. - 57)
7.1 Introduction
7.2 Ruminants
7.2.1 Calves
7.2.2 Dairy Cattle
7.2.3 Beef Cattle
7.2.4 Others
7.3 Swine
7.3.1 Starter
7.3.2 Grower
7.3.3 Sow
7.4 Poultry
7.4.1 Broilers
7.4.2 Breeders
7.4.3 Layers
7.5 Aquaculture
7.6 Others
8 Market for Feed Flavors & Sweeteners, By Form (Page No. - 70)
8.1 Introduction
8.2 Dry
8.3 Liquid
9 Market for Feed Flavors & Sweeteners, By Source (Page No. - 74)
9.1 Introduction
9.2 Natural
9.3 Synthetic
10 Feed Flavors & Sweeteners Market, By Region (Page No. - 79)
10.1 Introduction
10.2 North America
10.2.1 US
10.2.2 Canada
10.2.3 Mexico
10.3 Europe
10.3.1 UK
10.3.2 France
10.3.3 Italy
10.3.4 Spain
10.3.5 Germany
10.3.6 Rest of Europe
10.4 Asia Pacific
10.4.1 China
10.4.2 India
10.4.3 Japan
10.4.4 Thailand
10.4.5 Vietnam
10.4.6 Rest of Asia Pacific
10.5 South America
10.5.1 Brazil
10.5.2 Argentina
10.5.3 Rest of South America
10.6 Rest of the World (RoW)
10.6.1 The Middle East
10.6.2 Africa
11 Company Profiles (Page No. - 120)
11.1 Dupont
(Business Overview, Strength of Product Portfolio, Business Strategy Excellence, Products Offered, and Recent Developments)*
11.2 Kerry Group
11.3 Grupo Ferrer Internacional
11.4 Prinova Group
11.5 Solvay
11.6 Alltech
11.7 Norel
11.8 Biomin Holding
11.9 Pancosma
11.10 Nutriad International Dendermonde
11.11 Kemin Industries
11.12 Phytobiotics Futterzusatzstoffe
*Details on Business Overview, Strength of Product Portfolio, Business Strategy Excellence, Products Offered, and Recent Developments Might Not Be Captured in Case of Unlisted Companies.
12 Appendix (Page No. - 145)
12.1 Insights of Industry Experts
12.2 Discussion Guide
12.3 Knowledge Store: Marketsandmarkets’ Subscription Portal
12.4 Introducing RT: Real-Time Market Intelligence
12.5 Available Customizations
12.6 Related Reports
12.7 Author Details
List of Tables (102 Tables)
Table 1 Regulation of Synthetic Sweeteners Via the Feed Law
Table 2 Feed Flavors & Sweeteners Market Size, By Type, 2015–2022 (USD Million)
Table 3 Market Size, By Type, 2015–2022 (KT)
Table 4 Feed Flavors Market Size, By Type, 2015–2022 (USD Million)
Table 5 Feed Flavors Market Size, By Type, 2015–2022 (KT)
Table 6 Feed Flavors Market Size, By Region, 2015–2022 (USD Million)
Table 7 Fruits: Feed Flavors Market Size, By Region, 2015–2022 (USD Million)
Table 8 Spices: Feed Flavors Market Size, By Region, 2015–2022 (USD Million)
Table 9 Butter: Feed Flavors Market Size, By Region, 2015–2022 (USD Million)
Table 10 Others: Feed Flavors Market Size, By Region, 2015–2022 (USD Million)
Table 11 Feed Sweeteners Market Size, By Type, 2015–2022 (USD Million)
Table 12 Feed Sweeteners Market Size, By Type, 2015–2022 (KT)
Table 13 Feed Sweeteners Market Size, By Region, 2015–2022 (USD Million)
Table 14 Glycyrrhizin: Feed Sweeteners Market Size, By Region, 2015–2022 (USD Million)
Table 15 Saccharine: Feed Sweeteners Market Size, By Region, 2015–2022 (USD Million)
Table 16 Neohesperidine Dihydrochalcone: Feed Sweeteners Market Size, By Region, 2015–2022 (USD Million)
Table 17 Others: Feed Sweeteners Market Size, By Region, 2015–2022 (USD Million)
Table 18 Feed Flavors & Sweeteners Market Size, By Livestock, 2015–2022 (USD Million)
Table 19 Market Size, By Livestock, 2015–2022 (KT)
Table 20 Feed Flavors & Sweeteners for Ruminants Market Size, By Region, 2015–2022 (USD Million)
Table 21 Feed Flavors & Sweeteners for Ruminants Market Size, By Region, 2015–2022 (KT)
Table 22 Feed Flavors & Sweeteners for Ruminants Market Size, By Type, 2015–2022 (USD Million)
Table 23 Feed Flavors & Sweeteners for Swine Market Size, By Region, 2015–2022 (USD Million)
Table 24 Feed Flavors & Sweeteners for Swine Market Size, By Region, 2015–2022 (KT)
Table 25 Feed Flavors & Sweeteners for Swine Market Size, By Type, 2015–2022 (USD Million)
Table 26 Feed Flavors & Sweeteners for Poultry Market Size, By Region, 2015–2022 (USD Million)
Table 27 Feed Flavors & Sweeteners for Poultry Market Size, By Region, 2015–2022 (KT)
Table 28 Feed Flavors & Sweeteners for Poultry Market Size, By Type, 2015–2022 (USD Million)
Table 29 Feed Flavors & Sweeteners for Aquaculture Market Size, By Region, 2015–2022 (USD Million)
Table 30 Feed Flavors & Sweeteners for Aquaculture Market Size, By Region, 2015–2022 (KT)
Table 31 Feed Flavors & Sweeteners for Others Market Size, By Region, 2015–2022 (USD Million)
Table 32 Feed Flavors & Sweeteners for Others Market Size, By Region, 2015–2022 (KT)
Table 33 Feed Flavors & Sweeteners Market Size, By Form, 2015–2022 (USD Million)
Table 34 Market Size for Feed Flavors & Sweeteners, By Form, 2015–2022 (KT)
Table 35 Dry Feed Flavors & Sweeteners Market Size, By Region, 2015–2022 (USD Million)
Table 36 Liquid Feed Flavors & Sweeteners Market Size, By Region, 2015–2022 (USD Million)
Table 37 Feed Flavors & Sweeteners Market Size, By Source, 2015–2022 (USD Million)
Table 38 Market Size, By Source, 2015–2022 (KT)
Table 39 Natural Feed Flavors & Sweeteners Market Size, By Region, 2015–2022 (USD Million)
Table 40 Synthetic Feed Flavors & Sweeteners Market Size, By Region, 2015–2022 (USD Million)
Table 41 Feed Flavors & Sweeteners Market Size, By Region, 2015–2022 (USD Million)
Table 42 Market Size, By Region, 2015–2022 (KT)
Table 43 North America: Feed Flavors & Sweeteners Market Size, By Country, 2015–2022 (USD Million)
Table 44 North America: Market Size, By Type, 2015–2022 (USD Million)
Table 45 North America: Feed Flavors Market Size, By Type, 2015–2022 (USD Million)
Table 46 North America: Feed Sweeteners Market Size, By Type, 2015–2022 (USD Million)
Table 47 North America: Market Size for Feed Flavors & Sweeteners, By Livestock, 2015–2022 (USD Million)
Table 48 North America: Market Size, By Livestock, 2015–2022 (KT)
Table 49 North America: Market Size, By Form, 2015–2022 (USD Million)
Table 50 North America: Feed Flavors & Sweeteners Market Size, By Source, 2015–2022 (USD Million)
Table 51 US: Feed Flavors & Sweeteners Market Size, By Livestock, 2015–2022 (USD Million)
Table 52 Canada: Feed Flavors & Sweeteners Market Size, By Livestock, 2015–2022 (USD Million)
Table 53 Mexico: Market Size for Feed Flavors & Sweeteners, By Livestock, 2015–2022 (USD Million)
Table 54 Europe: Market Size, By Country, 2015–2022 (USD Million)
Table 55 Europe: Market Size for Feed Flavors & Sweeteners, By Type, 2015–2022 (USD Million)
Table 56 Europe: Feed Flavors Market Size, By Type, 2015–2022 (USD Million)
Table 57 Europe: Feed Sweeteners Market Size, By Type, 2015–2022 (USD Million)
Table 58 Europe: Market Size for Feed Flavors & Sweeteners, By Livestock, 2015–2022 (USD Million)
Table 59 Europe: Market Size, By Livestock, 2015–2022 (KT)
Table 60 Europe: Market Size, By Form, 2015–2022 (USD Million)
Table 61 Europe: Market Size, By Source, 2015–2022 (USD Million)
Table 62 UK: Feed Flavors & Sweeteners Market Size, By Livestock, 2015–2022 (USD Million)
Table 63 France: Feed Flavors & Sweeteners Market Size, By Livestock, 2015–2022 (USD Million)
Table 64 Italy: Feed Flavors & Sweeteners Market Size, By Livestock, 2015–2022 (USD Million)
Table 65 Spain: Feed Flavors & Sweeteners Market Size, By Livestock, 2015–2022 (USD Million)
Table 66 Germany: Feed Flavors & Sweeteners Market Size, By Livestock, 2015–2022 (USD Million)
Table 67 Rest of Europe: Feed Flavors & Sweeteners Market Size, By Livestock, 2015–2022 (USD Million)
Table 68 Asia Pacific: Feed Flavors & Sweeteners Market Size, By Country, 2015–2022 (USD Million)
Table 69 Asia Pacific: Market Size, By Type, 2015–2022 (USD Million)
Table 70 Asia Pacific: Feed Flavors Market Size, By Type, 2015–2022 (USD Million)
Table 71 Asia Pacific: Feed Sweeteners Market Size, By Type, 2015–2022 (USD Million)
Table 72 Asia Pacific: Market Size for Feed Flavors & Sweeteners, By Livestock, 2015–2022 (USD Million)
Table 73 Asia Pacific: Market Size, By Livestock, 2015–2022 (KT)
Table 74 Asia Pacific: Market Size, By Form, 2015–2022 (USD Million)
Table 75 Asia Pacific: Market Size, By Source, 2015–2022 (USD Million)
Table 76 China: Feed Flavors & Sweeteners Market Size, By Livestock, 2015–2022 (USD Million)
Table 77 India: Market Size for Feed Flavors & Sweeteners, By Livestock, 2015–2022 (USD Million)
Table 78 Japan: Feed Flavors & Sweeteners Market Size, By Livestock, 2015–2022 (USD Million)
Table 79 Thailand: Market Size for Feed Flavors & Sweeteners, By Livestock, 2015–2022 (USD Million)
Table 80 Vietnam: Feed Flavors & Sweeteners Market Size, By Livestock, 2015–2022 (USD Million)
Table 81 Rest of Asia Pacific: Feed Flavors & Sweeteners Market Size, By Livestock, 2015–2022 (USD Million)
Table 82 South America: Feed Flavors & Sweeteners Market Size, By Country, 2015–2022 (USD Million)
Table 83 South America: Market Size, By Type, 2015–2022 (USD Million)
Table 84 South America: Feed Flavors Market Size, By Type, 2015–2022 (USD Million)
Table 85 South America: Feed Sweeteners Market Size, By Type, 2015–2022 (USD Million)
Table 86 South America: Feed Flavors & Sweeteners Market Size, By Livestock, 2015–2022 (USD Million)
Table 87 South America: Market Size, By Livestock, 2015–2022 (KT)
Table 88 South America:Market Size, By Form, 2015–2022 (USD Million)
Table 89 South America: Market Size, By Source, 2015–2022 (USD Million)
Table 90 Brazil: Feed Flavors & Sweeteners Market Size, By Livestock, 2015–2022 (USD Million)
Table 91 Argentina: Feed Flavors & Sweeteners Market Size, By Livestock, 2015–2022 (USD Million)
Table 92 Rest of South America: Feed Flavors & Sweeteners Market Size, By Livestock, 2015–2022 (USD Million)
Table 93 RoW: Feed Flavors & Sweeteners Market Size, By Region, 2015–2022 (USD Million)
Table 94 RoW: Market Size, By Type, 2015–2022 (USD Million)
Table 95 RoW: Feed Flavors Market Size, By Type, 2015–2022 (USD Million)
Table 96 RoW: Feed Sweeteners Market Size, By Type, 2015–2022 (USD Million)
Table 97 RoW: Feed Flavors & Sweeteners Market Size, By Livestock, 2015–2022 (USD Million)
Table 98 Rest of the World: Feed Flavors & Sweeteners Market Size, By Livestock, 2015–2022 (KT)
Table 99 RoW: Market Size, By Form, 2015–2022 (USD Million)
Table 100 RoW: Market Size, By Source, 2015–2022 (USD Million)
Table 101 The Middle East: Market Size for Feed Flavors & Sweeteners, By Livestock, 2015–2022 (USD Million)
Table 102 Africa: Feed Flavors & Sweeteners Market Size, By Livestock, 2015–2022 (USD Million)
List of Figures (44 Figures)
Figure 1 Feed Flavors and Sweeteners Market Segmentation
Figure 2 Feed Flavors and Sweeteners Market: Geographic Segmentation
Figure 3 Feed Flavors and Sweeteners Market: Research Design
Figure 4 Feed Flavors and Sweeteners Market Size Estimation Methodology: Bottom-Up Approach
Figure 5 Market Size Estimation Methodology: Top-Down Approach
Figure 6 Data Triangulation Methodology
Figure 7 Global Compound Feed Production in 2015 (Million Tons)
Figure 8 Global Feed Production in 2016 (Million Metric Tons)
Figure 9 Growth in Livestock Population, 2010 vs 2014 (Million)
Figure 10 Poultry Population Forecast, 2010–2050 (Billion)
Figure 11 Feed Flavors & Sweeteners Market Size, By Type, 2017 vs 2022
Figure 12 Market Size, By Livestock, 2017 vs 2022
Figure 13 Market Size, By Source, 2017 vs 2022
Figure 14 Market Size, By Form, 2017 vs 2022
Figure 15 Asia Pacific is Projected to Grow at the Highest Rate During the Forecast Period
Figure 16 Growing Meat and Dairy Products Industries to Drive the Global Market
Figure 17 Feed Flavors Segment Estimated to Record the Largest Share Across All the Regions in 2017
Figure 18 Swine Segment to Hold the Largest Share in Asia Pacific, 2017
Figure 19 Ruminants Estimated to Be the Largest Segment in All the Regions Except Asia Pacific in 2017
Figure 20 Natural Feed Flavors & Sweeteners Estimated to Hold the Largest Share in 2017
Figure 21 Dry Segment Estimated to Hold the Largest Market Share in 2017
Figure 22 Spices Segment Estimated to Hold the Largest Share in 2017
Figure 23 Saccharine Segment Estimated to Hold the Largest Share in 2017
Figure 24 Feed Flavors & Sweeteners Market: Drivers, Restraints, Opportunities, and Challenges
Figure 25 Number of Taste Buds, By Species
Figure 26 World Meat Consumption Share, By Type, 2015
Figure 27 Pork Production, 2013–2016 (Million Pounds)
Figure 28 Global Meat Consumption Growth Trend, 2000–2030 (Million Tons)
Figure 29 Average Citrus Fruit Prices Per Pound, 2010–2014 (USD)
Figure 30 Animal Feed Flavors & Sweeteners Market: Value Chain
Figure 31 Animal Feed Flavors & Sweeteners Market: Supply Chain
Figure 32 Feed Flavors is Projected to Be the Fastest-Growing Segment Between 2017 & 2022
Figure 33 Asia Pacific Projected to Be the Fastest-Growing Region Between 2017 & 2022
Figure 34 Asia Pacific is Projected to Be the Fastest-Growing Market Between 2017 & 2022
Figure 35 Swine is Projected to Be the Fastest-Growing Segment Between 2017 & 2022
Figure 36 Feed Flavors & Sweeteners for Ruminants Market Size, By Region, 2017 vs 2022
Figure 37 Liquid Feed Flavors & Sweeteners Segment Projected to Be the Fastest-Growing Between 2017 & 2022 (USD Million)
Figure 38 Natural Segment is Projected to Be the Fastest-Growing Segment Between 2017 & 2022
Figure 39 Geographic Snapshot (2017–2022): China is Projected to Grow at the Highest CAGR and is Emerging as A New Hotspot
Figure 40 North America: Feed Flavors & Sweeteners Market Snapshot
Figure 41 Asia Pacific: Feed Flavors & Sweeteners Market Snapshot
Figure 42 Dupont: Company Snapshot
Figure 43 Kerry Group: Company Snapshot
Figure 44 Solvay: Company Snapshot


Growth opportunities and latent adjacency in Feed Flavors and Sweeteners Market
Does this report provide market for Indonesia Feed flavors and sweeteners market ?
The segmentation seems to be fine. I have a few questions which I need answers for 1. Do you have segmented natural and synthetic sources in detail? 2. What is covered under ruminants, swine, and poultry? Have you segmented them further in the report? 3. This article shows many key market players. Do you have their market share in feed flavors and sweeteners?
Which countries are covered in the South American region? What segments are covered under feed flavors?
Is pet food included in the scope?