Beta-Glucan Market

Beta-Glucan Market by Source (Cereal, Mushroom, Yeast and Seaweed), Application (Food & Beverage, Personal Care, Pharmaceutical, Dietary Supplement, Animal Feed), and Region (North America, Europe, APAC, Latin America and RoW) - Global Forecast to 2028

Report Code: FB 5113 Apr, 2023, by marketsandmarkets.com

[268 Pages Report] The beta-glucan market is estimated at USD 501 million in 2023 and is projected to reach USD 734 million by 2028, at a CAGR of 7.9% from 2023 to 2028. The increased demand for nutrients for the human body has resulted from urbanisation and a fast-paced lifestyle. As a result, Food Additives have been mixed into food products. Natural food additives boost the nutritious content of the foods they are mixed with without causing any harm. Natural ingredients are in high demand in both the conventional and organic food industries. According to article by BakeryandSnacks (leading online news source for the bakery and snacks sectors) 2022, natural ingredients are leading consumer trends: approximately 47% of global consumers ask for natural products, and 55% of respondents look for natural features when buying products in at least one category. Natural food additives are in high demand because of stringent EU regulations prohibiting the use of synthetic additives. As a result, the Food Additives market has grown exponentially. Beta-glucan is one such food Additive derived from many sources such as cereals & grains, yeast, mushroom and seaweed. Beta-glucan is a safe and naturally occurring potent Biological Response Modifier (BRM), which nutritionally activates the immune response. The demand for food products laced with Beta-glucan is increasing in order to maintain a healthy lifestyle.

Beta-Glucan Market

To know about the assumptions considered for the study, Request for Free Sample Report

Beta-Glucan Market

To know about the assumptions considered for the study, download the pdf brochure

Beta-Glucan Market Dynamics

Driver: Growing application of beta-glucan in different industries

Beta-Glucan has been extensively researched for its potential health benefits, including immune modulation, anti-inflammatory effects, and cholesterol-lowering properties. However, in recent years, there has been a growing interest in the application of beta-glucan in various industries beyond the food and dietary supplement sectors. Such as Beta-glucan has been investigated for its potential use in food packaging as a biodegradable and renewable alternative to petroleum-based plastics. A study published in the Journal of Applied Polymer Science in 2020 reported that beta-glucan-based films showed good mechanical properties and had potential as an edible coating for fruits and vegetables. The European Commission's Joint Research Centre has also investigated the use of beta-glucan as a coating for paper-based packaging to improve its water resistance and durability. Commercially, In 2021, the food packaging company Biopack launched a beta-glucan-based coating for paper-based packaging. The coating is designed to improve the water resistance and durability of the packaging while also making it more environmentally friendly.

Restraint: Price volatility of raw materials

The price volatility of raw materials is a significant restraint in the beta-glucan market. One recent example of price volatility in the beta-glucan market is the impact of weather patterns on the price of oats, which is a common source of beta-glucan. In 2018, a severe drought in Scandinavia caused the price of oats to rise significantly. This had a ripple effect on the price of beta-glucan products that rely on oats as a raw material, making them more expensive for consumers. The same year, the price of beta-glucan derived from yeast also increased due to rising demand for the ingredient in the food and beverage industry.

Opportunity: Growing demand for natural and plant-based ingredients

Developing countries such as China, India, and countries in the Middle East & Africa, in the coming years, are expected to experience a sharp upsurge in demand for beta-glucan extracted from different raw materials. This demand is attributed to be driven by an increase in the consumption of healthy foods, nutraceuticals, and personal care products. In addition, these regions also provide cost optimization in terms of production, labor cost, and processing. High demand, coupled with a low cost of production, is a key feature that is expected to support beta-glucan manufacturers to enter into new geographies. The growing demand for natural and plant-based ingredients is creating an opportunity for the beta glucan market to expand. Beta glucan, a naturally occurring polysaccharide found in oats, barley, and other sources, aligns with this trend and can provide a range of health benefits. According to a report by the United States Department of Agriculture (USDA) from 2020, the demand for natural and organic products is increasing, with sales of organic food in the United States reaching USD 6.4 billion in 2020, a 12.4% increase from 2019. The report also notes that consumers are increasingly seeking out products with natural and minimally processed ingredients, which includes beta glucan as a natural and minimally processed ingredient.

Recent commercial examples of the use of beta glucan in natural and plant-based products further demonstrate the opportunity for the beta glucan market. In 2021, the plant-based meat company Beyond Meat announced the launch of their Beyond Chicken Tenders, which are made with a blend of plant-based proteins and contain beta glucan as a natural binder. This product highlights the potential for beta glucan to provide a natural alternative to synthetic binders and improve the texture and taste of plant-based meat alternatives. Another example comes from the personal care industry, where beta glucan is used as an ingredient in natural and plant-based skincare products. In 2022, The Body Shop launched their new Drops of Youth™ Concentrate, which contains beta glucan to improve skin hydration and firmness. The use of beta glucan aligns with the Body Shop's commitment to using natural and sustainably sourced ingredients in their products.

Challenge: Lack of consumer awareness

The lack of awareness of beta glucan and its potential applications is a significant challenge for the industry. Many consumers and food manufacturers may not be familiar with the ingredient, which can limit demand for beta glucan-containing products and slow the growth of the market. For example, a study published in the Journal of Nutrition Education and Behavior in 2018 found that while consumers were generally aware of the health benefits of oatmeal, they were less familiar with the specific health benefits of beta glucan. The study suggested that increasing consumer awareness of beta glucan's health benefits could be a way to increase demand for beta glucan-containing products. The government can play a role in increasing awareness of beta glucan and its potential applications. For instance, the United States Department of Agriculture (USDA) has published research on the health benefits of beta glucan, including its potential role in reducing cholesterol levels and improving heart health. Additionally, the European Food Safety Authority (EFSA) has approved health claims related to beta glucan, such as its ability to lower blood cholesterol levels.

Beta-Glucan Market Ecosystem

Prominent companies in this market include well-established, financially stable manufacturers of Beta-glucam. These companies have been operating in the market for several years and possess a diversified product portfolio, state-of-the-art technologies, and strong global sales and marketing networks. Prominent companies in this market include Tate & Lyle PLC (England), Kerry Group PLC (Ireland), Koninklijke DSM NV (Netherlands), International Flavors & Fragrances INC. (US), Merck (US).

Beta-Glucan Market Size, and Share

Based on Source, Grains & Cereals segment is estimated to account for the largest market share of the beta-glucan market

The market for cereal grains as a source of beta-glucan is expected to grow in the coming years, driven by increasing consumer demand for healthier and functional foods. Beta-glucan is a type of dietary fiber found in the cell walls of cereals such as oats, barley, and rye. It has been shown to have various health benefits, including reducing cholesterol levels, improving heart health, and boosting the immune system.

Oats are the most common source of beta-glucan, and the demand for oat-based products is expected to grow significantly in the coming years. The rising popularity of oat milk and oat-based snacks is a testament to this trend. Barley and rye are also potential sources of beta-glucan, and their demand is expected to increase as well.

Moreover, the COVID-19 pandemic has led to a shift in consumer behavior towards healthier and immune-boosting foods, which has further increased the demand for beta-glucan-rich cereals. In conclusion, the market for cereal grains as a source of beta-glucan is expected to grow significantly in the coming years, driven by increasing consumer demand for functional and healthier foods. The industry players are also investing in research and development to develop new products and enhance the existing ones, which will further boost the market growth. Like, companies are developing innovative formulations that combine beta-glucan with other ingredients to create unique products with enhanced health benefits. For instance, In 2019, Kellogg's launched a new product called "Hi! Happy Inside" breakfast cereal, which is marketed as a digestive wellness cereal that includes beta-glucan from wheat as one of its key ingredients.

By category soluble segment of the beta-glucan market by category is projected to witness the highest CAGR during the forecast period.

Soluble beta glucan is a type of soluble fiber that is found in many foods, such as oats, barley, and mushrooms. It has been shown to have numerous health benefits, including reducing cholesterol levels, improving immune function, and potentially reducing the risk of certain types of cancer.

One of the reasons for this growth in demand is the increasing number of scientific studies that have demonstrated the health benefits of soluble beta glucan. For example, a 2020 review article published in the journal Nutrients concluded that consuming beta glucan from oats or barley can reduce total and LDL cholesterol levels, which are risk factors for cardiovascular disease. The authors also noted that beta glucan may have other cardiovascular benefits, such as reducing inflammation and improving endothelial function.

Based on application, Food & beverage segment are anticipated to dominate the market.

The consumption of beta-glucan has been linked to several health benefits, including reducing the risk of chronic diseases such as diabetes, heart disease, and certain types of cancer. The US FDA has approved the use of health claims related to beta-glucan, stating that "soluble fiber from certain foods, such as oats and barley, as part of a diet low in saturated fat and cholesterol, may reduce the risk of heart disease."

Recently, in 2021, the Swedish oat milk company Oatly launched a new line of oat milk products in the United States that are fortified with beta-glucan. The products, called "Oatly+ Beta-Glucan," are marketed as a way to support heart health and overall wellness. Thus, the growing demand for beta-glucan in the food and beverage industry is driven by increasing awareness of its health benefits, particularly in the prevention and management of chronic diseases.

The North America market is projected to contribute the largest share for the beta-glucan market

The North American beta-glucan market is led by its broad applications in various products along with their health benefits. The key market players in the North American beta-glucan market include Merck (U.S.), and Lesaffre (U.S.). Technological advancements have made beta-glucan available for a wide range of applications in the food & beverage sector in the form of thickening agents, fat substitutes, dietary fiber, and hypocholesterolemic agents; these are likely to drive the growth in the region.

Consumers in the US are calorie-conscious, due to which low-calorie and low-fat food products are popular in the country. The increase in the prevalence of obesity and cardiac diseases has led to a surge in demand for natural and low-calorie ingredient-based food products among consumers. According to the Centre for Disease Control & Prevention (CDC) and from the data provided by National Health and Nutrition Examination Survey, in the US, from the report, 2019-2020 shows that the prevalence of obesity among adults has increased to 42.4% in 2018 to 2020.

The rise in incidences of obesity, heart diseases, diabetes, and other health issues has led to a surge in demand for healthy ingredient-based products manufactured. Consumers in North America are gradually becoming aware of the health benefits of oat beta-glucan and its significance in enhancing body immunity. This, in turn, is projected to drive the growth of the beta-glucan market in this region. The growth of the food industry and the increase in usage of healthy food ingredients and additives in Canada and Mexico have contributed to the growth of the beta-glucan market in North America. Food manufacturers are therefore concentrating on different applications of beta-glucan products.

Beta-Glucan Market Size, and Share

Key Market Players

The key players in this include Tate & Lyle PLC (London), Kerry Group PLC (Ireland), Koninklijke DSM NV (Netherlands), International Flavors & Fragrances INC. (US), Merck (US), Lesaffre Human Care  (France), Kemin Industries (US), Angel Yeast Co. Ltd (China), Lallemand (Canada), Ohly GmbH (Germany), Biorigin – Zilor (Brazil), Ceapro Inc. (Canada), Specialty Biotech Co., Ltd. (US). These players in this market are focusing on increasing their presence through agreements and collaborations. These companies have a strong presence in North America, Asia Pacific and Europe. They also have manufacturing facilities along with strong distribution networks across these regions.

Get online access to the report on the World's First Market Intelligence Cloud

  • Easy to Download Historical Data & Forecast Numbers
  • Company Analysis Dashboard for high growth potential opportunities
  • Research Analyst Access for customization & queries
  • Competitor Analysis with Interactive dashboard
  • Latest News, Updates & Trend analysis
Request Sample

Scope of the Report

Report Metric

Details

Market size available for years

2018–2028

Base year considered

2022

Forecast period

2023–2028

Forecast units

Value (USD)

Segments covered

by source (grains & cereals, yeast, mushroom and seawwed), by category (soluble and insoluble), by application (Food & Beverage, personal care, pharmaceutical, dietary supplement and animal Feed and Region

Regions covered

North America, Europe, Asia Pacific, Latin America, and RoW

Companies covered

Tate & Lyle PLC (London), Kerry Group PLC (Ireland), Koninklijke DSM NV (Netherlands), International Flavors & Fragrances INC. (US), Merck (US).

This research report categorizes the beta-glucan market based on source, category, applications,  and region.

Based on source, the beta-glucan market has been segmented as follows:
  • Grains & cereals
  • Yeast
  • Mushroom
  • Seaweed
Based on category, the beta-glucan market has been segmented as follows:
  • Soluble
  • Insoluble
Based on the applications, the beta-glucan market has been segmented as follows:
  • Food & beverages
  • Personal care
  • Pharmaceutical
  • Dietary supplement
  • Animal feed
Based on the region, the beta-glucan market has been segmented as follows:
  • North America
  • Europe
  • Asia Pacific
  • South America
  • RoW (the Middle East & South Africa)

Recent Developments

  • In December 2022, Kemin Industry explanding the production site. The expansion of Kemin's production site in Cavriago reflects the company's commitment to innovation and sustainability in animal nutrition and health. With the addition of these new facilities, Kemin will be able to meet the growing demand for high-quality beta glucan products and continue to drive innovation in this important field.
  • DSM in January 2022 announced the launch of an integrated Food & Beverage operating structure which unifies three areas of DSM’s nutrition business – Food Specialties, Hydrocolloids, and part of its Nutritional Products Group. The new Food & Beverage organization will focus on helping consumers choose between taste, texture, and health. It will also help the company to become a fully focused Health, Nutrition & Bioscience firm and support the company’s announcement in September 2021.
  • In June 2020, Lesaffre takes a majority shareholding in the Chinese company Biohymn Biotechnology (China). Biohymn Biotechnology; is a Chinese company specialized in the production of yeast and yeast extracts. Considering its potential expansion strategies, to penetrate to the Chinese market, the company has invested and acquired a majority shareholding in Biohymn Biotechnology. This operation is perfectly in line with Lesaffre Human Care’s goal of strengthening its presence in the Chinese market and ensuring greater proximity to its clients.
  • In December 21, Angel Egypt's yeast product expansion project with an annual output of 20,000 tons officially started. The expansion project is undertaken by China National Chemical Engineering NO.16 Construction Co., Ltd., with a construction period of 17 months. It is expected to be completed and put into operation in May 2024, and in that time the total production.

Frequently Asked Questions (FAQ):

To speak to our analyst for a discussion on the above findings, click Speak to Analyst

TABLE OF CONTENTS
 
1 INTRODUCTION (Page No. - 33)
    1.1 STUDY OBJECTIVES 
    1.2 MARKET DEFINITION 
    1.3 STUDY SCOPE 
           FIGURE 1 MARKET SEGMENTATION
           1.3.1 INCLUSIONS & EXCLUSIONS
    1.4 REGIONS COVERED 
    1.5 PERIODIZATION CONSIDERED 
    1.6 UNITS CONSIDERED 
           1.6.1 CURRENCY CONSIDERED
                    TABLE 1 USD EXCHANGE RATES, 2017–2022
           1.6.2 VOLUME UNIT CONSIDERED
    1.7 STAKEHOLDERS 
    1.8 SUMMARY OF CHANGES 
           1.8.1 RECESSION IMPACT ANALYSIS
 
2 RESEARCH METHODOLOGY (Page No. - 39)
    2.1 RESEARCH DATA 
           FIGURE 2 BETA GLUCAN MARKET: RESEARCH DESIGN
           2.1.1 SECONDARY DATA
                    2.1.1.1 Key data from secondary sources
           2.1.2 PRIMARY DATA
                    2.1.2.1 Key data from primary sources
                    2.1.2.2 Key industry insights
                    2.1.2.3 Breakdown of primaries
    2.2 MARKET SIZE ESTIMATION 
           2.2.1 APPROACH ONE: TOP-DOWN
                    FIGURE 3 BETA-GLUCAN MARKET SIZE ESTIMATION – TOP-DOWN APPROACH
           2.2.2 APPROACH TWO: BOTTOM-UP
                    FIGURE 4 BETA-GLUCAN MARKET SIZE ESTIMATION – BOTTOM-UP APPROACH
    2.3 DATA TRIANGULATION 
           FIGURE 5 DATA TRIANGULATION METHODOLOGY
    2.4 STUDY ASSUMPTIONS 
    2.5 STUDY LIMITATIONS 
    2.6 RECESSION IMPACT ON BETA-GLUCAN MARKET 
           2.6.1 MACROECONOMIC INDICATORS OF RECESSION
                    FIGURE 6 INDICATORS OF RECESSION
                    FIGURE 7 GLOBAL INFLATION RATE, 2011–2021
                    FIGURE 8 GLOBAL GDP, 2011–2021 (USD TRILLION)
                    FIGURE 9 RECESSION INDICATORS AND THEIR IMPACT ON BETA-GLUCAN MARKET
                    FIGURE 10 BETA-GLUCAN MARKET: PREVIOUS FORECAST VS. RECESSION FORECAST
 
3 EXECUTIVE SUMMARY (Page No. - 52)
    FIGURE 11 BETA-GLUCAN MARKET, BY SOURCE, 2023 VS. 2028 (USD MILLION) 
    FIGURE 12 BETA-GLUCAN MARKET, BY CATEGORY, 2023 VS. 2028 (USD MILLION) 
    FIGURE 13 BETA-GLUCAN MARKET, BY APPLICATION, 2023 VS. 2028 (USD MILLION) 
    FIGURE 14 BETA-GLUCAN MARKET SNAPSHOT, BY REGION 
 
4 PREMIUM INSIGHTS (Page No. - 56)
    4.1 BRIEF OVERVIEW OF BETA-GLUCAN MARKET 
           FIGURE 15 GROWTH IN HEALTH-CONSCIOUS POPULATION TO DRIVE BETA-GLUCAN MARKET
    4.2 NORTH AMERICA: BETA-GLUCAN MARKET, BY SOURCE & COUNTRY 
           FIGURE 16 GRAINS & CEREALS AND US DOMINATED RESPECTIVE SEGMENTS IN NORTH AMERICAN MARKET IN 2022
    4.3 BETA-GLUCAN MARKET, BY APPLICATION & REGION 
           FIGURE 17 FOOD & BEVERAGE SEGMENT DOMINATED MARKET ACROSS ALL REGIONS IN 2022 (USD MILLION)
    4.4 BETA-GLUCAN MARKET, BY KEY COUNTRY 
           FIGURE 18 CHINA AND INDIA TO BE MOST LUCRATIVE MARKETS FOR BETA-GLUCAN
    4.5 BETA-GLUCAN MARKET, BY CATEGORY 
           FIGURE 19 NORTH AMERICA TO DOMINATE BETA-GLUCAN MARKET AMONG ALL REGIONS THROUGH FORECAST PERIOD
 
5 MARKET OVERVIEW (Page No. - 60)
    5.1 INTRODUCTION 
    5.2 MACROECONOMIC INDICATORS 
           5.2.1 RISE IN HEALTH CONCERNS AND DISEASE INCIDENCES
                    FIGURE 20 NUMBER OF NEW CANCER CASES FOR ALL AGES, 2015–2020 (MILLION)
           5.2.2 INCREASE IN CONSUMPTION OF DIETARY FIBERS
    5.3 MARKET DYNAMICS 
           FIGURE 21 MARKET DYNAMICS: BETA-GLUCAN MARKET
           5.3.1 DRIVERS
                    5.3.1.1 Growth in health consciousness among consumers and increasing health expenditure
                               FIGURE 22 INCREASING PER CAPITA HEALTH EXPENDITURE IN MAJOR ECONOMIES,  2015–2019 (USD)
                    5.3.1.2 Increase in application of beta-glucan in different industries
           5.3.2 RESTRAINTS
                    5.3.2.1 Inconsistency in regulatory norms governing beta-glucan
                    5.3.2.2 Price volatility of raw materials
           5.3.3 OPPORTUNITIES
                    5.3.3.1 Untapped beta-glucan applications
                    5.3.3.2 Rise in demand for natural and plant-based ingredients
           5.3.4 CHALLENGES
                    5.3.4.1 Lack of consumer awareness regarding benefits specific to beta-glucan
 
6 INDUSTRY TRENDS (Page No. - 67)
    6.1 INTRODUCTION 
    6.2 VALUE CHAIN ANALYSIS 
           6.2.1 RESEARCH & DEVELOPMENT AND RAW MATERIAL SOURCING
           6.2.2 MANUFACTURING
           6.2.3 DISTRIBUTION
           6.2.4 END USERS
                    FIGURE 23 BETA-GLUCAN MARKET: VALUE CHAIN ANALYSIS
    6.3 SUPPLY CHAIN 
           FIGURE 24 BETA-GLUCAN MARKET: SUPPLY CHAIN ANALYSIS
           6.3.1 SMOOTH PROCUREMENT OF RAW MATERIALS
           6.3.2 DISTRIBUTION CHANNELS TO REDUCE DEMAND-SUPPLY GAP
    6.4 TECHNOLOGY ANALYSIS 
           6.4.1 ENCAPSULATION
           6.4.2 NEW AVENUES OF YEAST CULTURE & EXTRACTION
    6.5 BETA-GLUCAN MARKET MAP AND ECOSYSTEM 
           6.5.1 DEMAND SIDE
           6.5.2 SUPPLY SIDE
                    FIGURE 25 BETA-GLUCAN MARKET: ECOSYSTEM MAP
           6.5.3 ECOSYSTEM MAP
                    TABLE 2 BETA-GLUCAN MARKET ECOSYSTEM
    6.6 TRENDS/DISRUPTIONS IMPACTING CUSTOMERS’ BUSINESSES 
           6.6.1 REVENUE SHIFT AND NEW REVENUE POCKETS FOR PLAYERS IN BETA-GLUCAN MARKET
                    FIGURE 26 REVENUE SHIFT IMPACTING TRENDS/DISRUPTIONS IN BETA-GLUCAN MARKET
    6.7 PATENT ANALYSIS 
           FIGURE 27 PATENT ANALYSIS FOR BETA-GLUCAN MARKET, 2012–2022
           FIGURE 28 REGIONAL ANALYSIS OF PATENTS GRANTED FOR BETA-GLUCAN,  2012–2022
           6.7.1 LIST OF MAJOR PATENTS
    6.8 PORTER’S FIVE FORCES ANALYSIS 
           6.8.1 THREAT OF NEW ENTRANTS
           6.8.2 THREAT OF SUBSTITUTES
           6.8.3 BARGAINING POWER OF SUPPLIERS
           6.8.4 BARGAINING POWER OF BUYERS
           6.8.5 INTENSITY OF COMPETITIVE RIVALRY
    6.9 CASE STUDY ANALYSIS 
           6.9.1 CARGILL, INC.: INVESTMENT OF USD 35 MILLION IN EUROPE
           6.9.2 TATE & LYLE PLC: EXTENDING ITS DISTRIBUTION PARTNERSHIP
    6.10 TARIFF AND REGULATORY LANDSCAPE 
           6.10.1 REGULATORY BODIES, GOVERNMENT AGENCIES, AND OTHER ORGANIZATIONS
                    6.10.1.1 North America
                               TABLE 3 NORTH AMERICA: LIST OF REGULATORY BODIES, GOVERNMENT AGENCIES,  AND OTHER ORGANIZATIONS
                    6.10.1.2 Europe
                               TABLE 4 EUROPE: LIST OF REGULATORY BODIES, GOVERNMENT AGENCIES,  AND OTHER ORGANIZATIONS
                    6.10.1.3 Asia Pacific
                               TABLE 5 ASIA PACIFIC: LIST OF REGULATORY BODIES, GOVERNMENT AGENCIES,  AND OTHER ORGANIZATIONS
                    6.10.1.4 RoW
                               TABLE 6 ROW: LIST OF REGULATORY BODIES, GOVERNMENT AGENCIES,  AND OTHER ORGANIZATIONS
    6.11 REGULATIONS 
           6.11.1 INTRODUCTION
           6.11.2 NORTH AMERICA
                    6.11.2.1 US Food and Drug Administration (21CFR101.14)
                    6.11.2.2 US Food and Drug Administration (21CFR101.81)
           6.11.3 EUROPEAN FOOD SAFETY AUTHORITY
           6.11.4 EUROPEAN UNION
    6.12 KEY STAKEHOLDERS IN BUYING PROCESS 
           6.12.1 INFLUENCE OF STAKEHOLDERS ON BUYING PROCESS
                    FIGURE 29 INFLUENCE OF STAKEHOLDERS ON BUYING PROCESS FOR TOP APPLICATIONS
                    TABLE 7 INFLUENCE OF STAKEHOLDERS ON BUYING PROCESS FOR TOP APPLICATIONS
           6.12.2 BUYING CRITERIA
                    FIGURE 30 KEY CRITERIA FOR SELECTING SUPPLIERS/VENDORS ACROSS TOP APPLICATIONS
                    TABLE 8 KEY CRITERIA FOR SELECTING SUPPLIERS/VENDORS ACROSS TOP APPLICATIONS
 
7 BETA-GLUCAN MARKET, BY SOURCE (Page No. - 84)
    7.1 INTRODUCTION 
           FIGURE 31 BETA-GLUCAN MARKET, BY SOURCE, 2023 VS. 2028 (USD MILLION)
           TABLE 9 BETA-GLUCAN MARKET, BY SOURCE, 2018–2022 (USD MILLION)
           TABLE 10 BETA-GLUCAN MARKET, BY SOURCE, 2023–2028 (USD MILLION)
           TABLE 11 BETA-GLUCAN MARKET, BY SOURCE, 2018–2022 (TON)
           TABLE 12 BETA-GLUCAN MARKET, BY SOURCE, 2023–2028 (TON)
    7.2 CEREALS & GRAINS 
           TABLE 13 CEREAL & GRAIN SOURCES MARKET, BY REGION, 2018–2022 (USD MILLION)
           TABLE 14 CEREAL & GRAIN SOURCES MARKET, BY REGION, 2023–2028 (USD MILLION)
           TABLE 15 CEREAL & GRAIN SOURCES MARKET, BY REGION, 2018–2022 (TON)
           TABLE 16 CEREAL & GRAIN SOURCES MARKET, BY REGION, 2023–2028 (TON)
           7.2.1 OATS
                    7.2.1.1 Increase in awareness of health benefits of beta-glucan from oats
           7.2.2 BARLEY
                    7.2.2.1 Diverse applications of barley-based beta-glucan in various industries
           7.2.3 OTHER SOURCES
    7.3 MUSHROOM 
           7.3.1 D-GLUCAN FROM MUSHROOMS CATERS TO GROWTH IN DEMAND FOR IMMUNE SYSTEM-SUPPORTING INGREDIENTS
                    TABLE 17 MUSHROOM SOURCES MARKET, BY REGION, 2018–2022 (USD MILLION)
                    TABLE 18 MUSHROOM SOURCES MARKET, BY REGION, 2023–2028 (USD MILLION)
                    TABLE 19 MUSHROOM SOURCES MARKET, BY REGION, 2018–2022 (TON)
                    TABLE 20 MUSHROOM SOURCES MARKET, BY REGION, 2023–2028 (TON)
    7.4 YEAST 
           7.4.1 GOVERNMENT SUPPORT FOR RESEARCH & DEVELOPMENT ON YEAST-BASED BETA-GLUCAN
                    TABLE 21 YEAST SOURCES MARKET, BY REGION, 2018–2022 (USD MILLION)
                    TABLE 22 YEAST SOURCES MARKET, BY REGION, 2023–2028 (USD MILLION)
                    TABLE 23 YEAST SOURCES MARKET, BY REGION, 2018–2022 (TON)
                    TABLE 24 YEAST SOURCES MARKET, BY REGION, 2023–2028 (TON)
    7.5 SEAWEED 
           7.5.1 GROWING USE OF SEAWEED-BASED BETA-GLUCAN IN COSMETIC AND PERSONAL CARE PRODUCTS
                    TABLE 25 SEAWEED SOURCES MARKET, BY REGION, 2018–2022 (USD MILLION)
                    TABLE 26 SEAWEED SOURCES MARKET, BY REGION, 2023–2028 (USD MILLION)
                    TABLE 27 SEAWEED SOURCES MARKET, BY REGION, 2018–2022 (TON)
                    TABLE 28 SEAWEED SOURCES MARKET, BY REGION, 2023–2028 (TON)
 
8 BETA-GLUCAN MARKET, BY CATEGORY (Page No. - 96)
    8.1 INTRODUCTION 
           FIGURE 32 BETA-GLUCAN MARKET, BY CATEGORY, 2023 VS. 2028 (USD MILLION)
           TABLE 29 BETA-GLUCAN MARKET, BY CATEGORY, 2018–2022 (USD MILLION)
           TABLE 30 GLOBAL BETA-GLUCAN MARKET, BY CATEGORY, 2023–2028 (USD MILLION)
    8.2 SOLUBLE BETA-GLUCAN 
           8.2.1 RISE IN PREVALENCE OF CHRONIC LIFESTYLE DISEASES
                    TABLE 31 SOLUBLE BETA-GLUCAN MARKET, BY REGION, 2018–2022 (USD MILLION)
                    TABLE 32 SOLUBLE BETA-GLUCAN MARKET, BY REGION, 2023–2028 (USD MILLION)
    8.3 INSOLUBLE BETA-GLUCAN 
           8.3.1 POSITIVE EFFECTS OF INSOLUBLE BETA-GLUCAN ON HUMAN HEALTH
                    TABLE 33 INSOLUBLE BETA-GLUCAN MARKET, BY REGION, 2018–2022 (USD MILLION)
                    TABLE 34 INSOLUBLE BETA-GLUCAN MARKET, BY REGION, 2023–2028 (USD MILLION)
 
9 BETA-GLUCAN MARKET, BY TYPE (Page No. - 101)
    9.1 INTRODUCTION 
    9.2 1,3 BETA-GLUCAN 
    9.3 1,4 BETA-GLUCAN 
    9.4 1,6 BETA-GLUCAN 
 
10 BETA-GLUCAN MARKET, BY APPLICATION (Page No. - 103)
     10.1 INTRODUCTION 
               TABLE 35 APPLICATION OVERVIEW
               FIGURE 33 BETA-GLUCAN MARKET, BY APPLICATION, 2023 VS. 2028 (USD MILLION)
               TABLE 36 BETA-GLUCAN MARKET, BY APPLICATION, 2018–2022 (USD MILLION)
               TABLE 37 BETA-GLUCAN MARKET, BY APPLICATION, 2023–2028 (USD MILLION)
     10.2 FOOD & BEVERAGES 
             10.2.1 BENEFITS OF DIET INCLUDING SOLUBLE FIBER IN MANAGING CHRONIC CONDITIONS
                       TABLE 38 BETA-GLUCAN MARKET IN FOOD & BEVERAGE APPLICATIONS, BY REGION,  2018–2022 (USD MILLION)
                       TABLE 39 BETA-GLUCAN MARKET IN FOOD & BEVERAGE APPLICATIONS, BY REGION,  2023–2028 (USD MILLION)
     10.3 PERSONAL CARE 
             10.3.1 CONSUMERS’ DEMAND FOR NATURAL AND HEALTH INGREDIENTS IN PERSONAL CARE PRODUCTS
                       TABLE 40 BETA-GLUCAN MARKET IN PERSONAL CARE APPLICATIONS, BY REGION,  2018–2022 (USD MILLION)
                       TABLE 41 BETA-GLUCAN MARKET IN PERSONAL CARE APPLICATIONS, BY REGION,  2023–2028 (USD MILLION)
     10.4 PHARMACEUTICALS 
             10.4.1 GOVERNMENT INVESTMENT IN BENEFITS OF BETA-GLUCAN IN PHARMACEUTICAL APPLICATIONS
                       TABLE 42 BETA-GLUCAN MARKET IN PHARMACEUTICAL APPLICATIONS, BY REGION,  2018–2022 (USD MILLION)
                       TABLE 43 BETA-GLUCAN MARKET IN PHARMACEUTICAL APPLICATIONS, BY REGION,  2023–2028 (USD MILLION)
     10.5 DIETARY SUPPLEMENTS 
             10.5.1 INCREASE IN AWARENESS OF ASSOCIATED HEALTH BENEFITS
                       TABLE 44 BETA-GLUCAN MARKET IN DIETARY SUPPLEMENT APPLICATIONS, BY REGION,  2018–2022 (USD MILLION)
                       TABLE 45 BETA-GLUCAN MARKET IN DIETARY SUPPLEMENT APPLICATIONS, BY REGION,  2023–2028 (USD MILLION)
     10.6 ANIMAL FEED 
             10.6.1 GROWING INCLINATION OF PET AND LIVESTOCK OWNERS TOWARD NUTRITIOUS FEED
                       TABLE 46 BETA-GLUCAN MARKET IN ANIMAL FEED APPLICATIONS, BY REGION,  2018–2022 (USD MILLION)
                       TABLE 47 BETA-GLUCAN MARKET IN ANIMAL FEED APPLICATIONS, BY REGION,  2023–2028 (USD MILLION)
 
11 BETA-GLUCAN MARKET, BY BRAND (Page No. - 113)
     11.1 INTRODUCTION 
     11.2 OATWELL 
     11.3 PROMOAT 
     11.4 SANACEL 
     11.5 AVENACARE 
     11.6 NUTRIM 
     11.7 WELLMUNE 
     11.8 YESTIMUN 
 
12 BETA-GLUCAN MARKET, BY EXTRACTION METHOD (Page No. - 115)
     12.1 INTRODUCTION 
               TABLE 48 BETA-GLUCAN YIELDS AND PRODUCTION TECHNOLOGIES FROM VARIOUS SOURCES
     12.2 BETA-GLUCAN FROM CEREAL 
     12.3 BETA-GLUCAN FROM YEAST 
 
13 BETA-GLUCAN MARKET, BY REGION (Page No. - 117)
     13.1 INTRODUCTION 
               FIGURE 34 ASIA PACIFIC COUNTRIES TO WITNESS SIGNIFICANT GROWTH IN BETA-GLUCAN MARKET, 2023–2028
               TABLE 49 GLOBAL BETA-GLUCAN MARKET, BY REGION, 2018–2022 (USD MILLION)
               TABLE 50 BETA-GLUCAN MARKET, BY REGION, 2023–2028 (USD MILLION)
               TABLE 51 BETA-GLUCAN MARKET, BY REGION, 2018–2022 (TON)
               TABLE 52 BETA-GLUCAN MARKET, BY REGION, 2023–2028 (TON)
     13.2 NORTH AMERICA 
               FIGURE 35 NORTH AMERICA: BETA-GLUCAN MARKET SNAPSHOT
             13.2.1 NORTH AMERICA: RECESSION IMPACT
                       FIGURE 36 NORTH AMERICA: INFLATION RATES, BY KEY COUNTRY, 2017–2021
                       FIGURE 37 NORTH AMERICA: RECESSION IMPACT ANALYSIS, 2023
                       TABLE 53 NORTH AMERICA: BETA-GLUCAN MARKET, BY APPLICATION,  2018–2022 (USD MILLION)
                       TABLE 54 NORTH AMERICA: BETA-GLUCAN MARKET, BY APPLICATION,  2023–2028 (USD MILLION)
                       TABLE 55 NORTH AMERICA: BETA-GLUCAN MARKET, BY SOURCE, 2018–2022 (USD MILLION)
                       TABLE 56 NORTH AMERICA: BETA-GLUCAN MARKET, BY SOURCE, 2023–2028 (USD MILLION)
                       TABLE 57 NORTH AMERICA: BETA-GLUCAN MARKET, BY SOURCE, 2018–2022 (TON)
                       TABLE 58 NORTH AMERICA: BETA-GLUCAN MARKET, BY SOURCE, 2023–2028 (TON)
                       TABLE 59 NORTH AMERICA: BETA-GLUCAN MARKET, BY CATEGORY,  2018–2022 (USD MILLION)
                       TABLE 60 NORTH AMERICA: BETA-GLUCAN MARKET, BY CATEGORY,  2023–2028 (USD MILLION)
                       TABLE 61 NORTH AMERICA: BETA-GLUCAN MARKET, BY COUNTRY, 2018–2022 (USD MILLION)
                       TABLE 62 NORTH AMERICA: BETA-GLUCAN MARKET, BY COUNTRY, 2023–2028 (USD MILLION)
             13.2.2 US
                       13.2.2.1 Rise in awareness and consumption of fiber-rich ingredient-based products
                                   TABLE 63 US: BETA-GLUCAN MARKET, BY CATEGORY, 2018–2022 (USD MILLION)
                                   TABLE 64 US: BETA-GLUCAN MARKET, BY CATEGORY, 2023–2028 (USD MILLION)
                                   TABLE 65 US: BETA-GLUCAN MARKET, BY APPLICATION, 2018–2022 (USD MILLION)
                                   TABLE 66 US: BETA-GLUCAN MARKET, BY APPLICATION, 2023–2028 (USD MILLION)
             13.2.3 CANADA
                       13.2.3.1 Increased potential usage in food & beverage and pharmaceutical applications in Canada
                                   TABLE 67 CANADA: BETA-GLUCAN MARKET, BY CATEGORY, 2018–2022 (USD MILLION)
                                   TABLE 68 CANADA: BETA-GLUCAN MARKET, BY CATEGORY, 2023–2028 (USD MILLION)
                                   TABLE 69 CANADA: BETA-GLUCAN MARKET, BY APPLICATION, 2018–2022 (USD MILLION)
                                   TABLE 70 CANADA: BETA-GLUCAN MARKET, BY APPLICATION, 2023–2028 (USD MILLION)
             13.2.4 MEXICO
                       13.2.4.1 Support from government initiatives and public healthcare campaigns
                                   TABLE 71 MEXICO: BETA-GLUCAN MARKET, BY CATEGORY, 2018–2022 (USD MILLION)
                                   TABLE 72 MEXICO: BETA-GLUCAN MARKET, BY CATEGORY, 2023–2028 (USD MILLION)
                                   TABLE 73 MEXICO: BETA-GLUCAN MARKET, BY APPLICATION, 2018–2022 (USD MILLION)
                                   TABLE 74 MEXICO: BETA-GLUCAN MARKET, BY APPLICATION, 2023–2028 (USD MILLION)
     13.3 EUROPE 
             13.3.1 EUROPE: RECESSION IMPACT
                       FIGURE 38 EUROPE: INFLATION RATES, BY KEY COUNTRY, 2017–2021
                       FIGURE 39 EUROPE: RECESSION IMPACT ANALYSIS, 2023
                       TABLE 75 EUROPE: BETA-GLUCAN MARKET, BY APPLICATION,  2018–2022 (USD MILLION)
                       TABLE 76 EUROPE: BETA-GLUCAN MARKET, BY APPLICATION,  2023–2028 (USD MILLION)
                       TABLE 77 EUROPE: BETA-GLUCAN MARKET, BY SOURCE, 2018–2022 (USD MILLION)
                       TABLE 78 EUROPE: BETA-GLUCAN MARKET, BY SOURCE, 2023–2028 (USD MILLION)
                       TABLE 79 EUROPE: BETA-GLUCAN MARKET, BY SOURCE, 2018–2022 (TON)
                       TABLE 80 EUROPE: BETA-GLUCAN MARKET, BY SOURCE, 2023–2028 (TON)
                       TABLE 81 EUROPE: BETA-GLUCAN MARKET, BY CATEGORY,  2018–2022 (USD MILLION)
                       TABLE 82 EUROPE: BETA-GLUCAN MARKET, BY CATEGORY,  2023–2028 (USD MILLION)
                       TABLE 83 EUROPE: BETA-GLUCAN MARKET, BY COUNTRY, 2018–2022 (USD MILLION)
                       TABLE 84 EUROPE: BETA-GLUCAN MARKET, BY COUNTRY, 2023–2028 (USD MILLION)
             13.3.2 GERMANY
                       13.3.2.1 Rise in prevalence of diabetes and population inclining toward natural ingredient-based foods
                                   TABLE 85 GERMANY: BETA-GLUCAN MARKET, BY CATEGORY, 2018–2022 (USD MILLION)
                                   TABLE 86 GERMANY: BETA-GLUCAN MARKET, BY CATEGORY, 2023–2028 (USD MILLION)
                                   TABLE 87 GERMANY: BETA-GLUCAN MARKET, BY APPLICATION, 2018–2022 (USD MILLION)
                                   TABLE 88 GERMANY: BETA-GLUCAN MARKET, BY APPLICATION, 2023–2028 (USD MILLION)
             13.3.3 FRANCE
                       13.3.3.1 Demand for functional foods in France
                                   TABLE 89 FRANCE: BETA-GLUCAN MARKET, BY CATEGORY, 2018–2022 (USD MILLION)
                                   TABLE 90 FRANCE: BETA-GLUCAN MARKET, BY CATEGORY, 2023–2028 (USD MILLION)
                                   TABLE 91 FRANCE: BETA-GLUCAN MARKET, BY APPLICATION, 2018–2022 (USD MILLION)
                                   TABLE 92 FRANCE: BETA-GLUCAN MARKET, BY APPLICATION, 2023–2028 (USD MILLION)
             13.3.4 UK
                       13.3.4.1 Growth in natural ingredient trend in UK
                                   TABLE 93 UK: BETA-GLUCAN MARKET, BY CATEGORY, 2018–2022 (USD MILLION)
                                   TABLE 94 UK: BETA-GLUCAN MARKET, BY CATEGORY, 2023–2028 (USD MILLION)
                                   TABLE 95 UK: BETA-GLUCAN MARKET, BY APPLICATION, 2018–2022 (USD MILLION)
                                   TABLE 96 UK: BETA-GLUCAN MARKET, BY APPLICATION, 2023–2028 (USD MILLION)
             13.3.5 ITALY
                       13.3.5.1 Significant rise in consumer demand for health-enriching ingredients in Italy
                                   TABLE 97 ITALY: BETA-GLUCAN MARKET, BY CATEGORY, 2018–2022 (USD MILLION)
                                   TABLE 98 ITALY: BETA-GLUCAN MARKET, BY CATEGORY, 2023–2028 (USD MILLION)
                                   TABLE 99 ITALY: BETA-GLUCAN MARKET, BY APPLICATION, 2018–2022 (USD MILLION)
                                   TABLE 100 ITALY: BETA-GLUCAN MARKET, BY APPLICATION, 2023–2028 (USD MILLION)
             13.3.6 SPAIN
                       13.3.6.1 Rise in consumer awareness toward consumption of organic ingredients
                                   TABLE 101 SPAIN: BETA-GLUCAN MARKET, BY CATEGORY, 2018–2022 (USD MILLION)
                                   TABLE 102 SPAIN: BETA-GLUCAN MARKET, BY CATEGORY, 2023–2028 (USD MILLION)
                                   TABLE 103 SPAIN: BETA-GLUCAN MARKET, BY APPLICATION, 2018–2022 (USD MILLION)
                                   TABLE 104 SPAIN: BETA-GLUCAN MARKET, BY APPLICATION, 2023–2028 (USD MILLION)
             13.3.7 REST OF EUROPE
                       TABLE 105 REST OF EUROPE: BETA-GLUCAN MARKET, BY CATEGORY, 2018–2022 (USD MILLION)
                       TABLE 106 REST OF EUROPE: BETA-GLUCAN MARKET, BY CATEGORY, 2023–2028 (USD MILLION)
                       TABLE 107 REST OF EUROPE: BETA-GLUCAN MARKET, BY APPLICATION, 2018–2022 (USD MILLION)
                       TABLE 108 REST OF EUROPE: BETA-GLUCAN MARKET, BY APPLICATION, 2023–2028 (USD MILLION)
     13.4 ASIA PACIFIC 
             13.4.1 ASIA PACIFIC: RECESSION IMPACT
                       FIGURE 40 ASIA PACIFIC: INFLATION RATES, BY KEY COUNTRY, 2017–2021
                       FIGURE 41 ASIA PACIFIC: RECESSION IMPACT ANALYSIS, 2023
                       FIGURE 42 ASIA PACIFIC: BETA-GLUCAN MARKET SNAPSHOT
                       TABLE 109 ASIA PACIFIC: BETA-GLUCAN MARKET, BY APPLICATION,  2018–2022 (USD MILLION)
                       TABLE 110 ASIA PACIFIC: BETA-GLUCAN MARKET, BY APPLICATION,  2023–2028 (USD MILLION)
                       TABLE 111 ASIA PACIFIC: BETA-GLUCAN MARKET, BY SOURCE, 2018–2022 (USD MILLION)
                       TABLE 112 ASIA PACIFIC: BETA-GLUCAN MARKET, BY SOURCE, 2023–2028 (USD MILLION)
                       TABLE 113 ASIA PACIFIC: BETA-GLUCAN MARKET, BY SOURCE, 2018–2022 (TON)
                       TABLE 114 ASIA PACIFIC: BETA-GLUCAN MARKET, BY SOURCE, 2023–2028 (TON)
                       TABLE 115 ASIA PACIFIC: BETA-GLUCAN MARKET, BY CATEGORY,  2018–2022 (USD MILLION)
                       TABLE 116 ASIA PACIFIC: BETA-GLUCAN MARKET, BY CATEGORY,  2023–2028 (USD MILLION)
                       TABLE 117 ASIA PACIFIC: BETA-GLUCAN MARKET, BY COUNTRY, 2018–2022 (USD MILLION)
                       TABLE 118 ASIA PACIFIC: BETA-GLUCAN MARKET, BY COUNTRY, 2023–2028 (USD MILLION)
             13.4.2 CHINA
                       13.4.2.1 Rise in preference for fortified products in China
                                   TABLE 119 CHINA: BETA-GLUCAN MARKET, BY CATEGORY, 2018–2022 (USD MILLION)
                                   TABLE 120 CHINA: BETA-GLUCAN MARKET, BY CATEGORY, 2023–2028 (USD MILLION)
                                   TABLE 121 CHINA: BETA-GLUCAN MARKET, BY APPLICATION, 2018–2022 (USD MILLION)
                                   TABLE 122 CHINA: BETA-GLUCAN MARKET, BY APPLICATION, 2023–2028 (USD MILLION)
             13.4.3 INDIA
                       13.4.3.1 Innovation and product development in beta-glucan industry in India
                                   TABLE 123 INDIA: BETA-GLUCAN MARKET, BY CATEGORY, 2018–2022 (USD MILLION)
                                   TABLE 124 INDIA: BETA-GLUCAN MARKET, BY CATEGORY, 2023–2028 (USD MILLION)
                                   TABLE 125 INDIA: BETA-GLUCAN MARKET, BY APPLICATION, 2018–2022 (USD MILLION)
                                   TABLE 126 INDIA: BETA-GLUCAN MARKET, BY APPLICATION, 2023–2028 (USD MILLION)
             13.4.4 JAPAN
                       13.4.4.1 Rise in healthcare costs and higher life expectancy due to preventive healthcare measures in Japan
                                   TABLE 127 JAPAN: BETA-GLUCAN MARKET, BY CATEGORY, 2018–2022 (USD MILLION)
                                   TABLE 128 JAPAN: BETA-GLUCAN MARKET, BY CATEGORY, 2023–2028 (USD MILLION)
                                   TABLE 129 JAPAN: BETA-GLUCAN MARKET, BY APPLICATION, 2018–2022 (USD MILLION)
                                   TABLE 130 JAPAN: BETA-GLUCAN MARKET, BY APPLICATION, 2023–2028 (USD MILLION)
             13.4.5 AUSTRALIA & NEW ZEALAND
                       13.4.5.1 High spending capacity on nutritional products in ANZ
                                   TABLE 131 AUSTRALIA & NEW ZEALAND: BETA-GLUCAN MARKET, BY CATEGORY,  2018–2022 (USD MILLION)
                                   TABLE 132 AUSTRALIA & NEW ZEALAND: BETA-GLUCAN MARKET, BY CATEGORY,  2023–2028 (USD MILLION)
                                   TABLE 133 AUSTRALIA & NEW ZEALAND: BETA-GLUCAN MARKET, BY APPLICATION,  2018–2022 (USD MILLION)
                                   TABLE 134 AUSTRALIA & NEW ZEALAND: BETA-GLUCAN MARKET, BY APPLICATION,  2023–2028 (USD MILLION)
             13.4.6 REST OF ASIA PACIFIC
                                   TABLE 135 REST OF ASIA PACIFIC: BETA-GLUCAN MARKET, BY CATEGORY,  2018–2022 (USD MILLION)
                                   TABLE 136 REST OF ASIA PACIFIC: BETA-GLUCAN MARKET, BY CATEGORY,  2023–2028 (USD MILLION)
                                   TABLE 137 REST OF ASIA PACIFIC: BETA-GLUCAN MARKET, BY APPLICATION,  2018–2022 (USD MILLION)
                                   TABLE 138 REST OF ASIA PACIFIC: BETA-GLUCAN MARKET, BY APPLICATION,  2023–2028 (USD MILLION)
     13.5 SOUTH AMERICA 
             13.5.1 SOUTH AMERICA: RECESSION IMPACT ANALYSIS
                       FIGURE 43 SOUTH AMERICA: INFLATION RATES, BY KEY COUNTRY, 2017–2021
                       FIGURE 44 SOUTH AMERICA: RECESSION IMPACT ANALYSIS, 2023
                       TABLE 139 SOUTH AMERICA: BETA-GLUCAN MARKET, BY APPLICATION,  2018–2022 (USD MILLION)
                       TABLE 140 SOUTH AMERICA: BETA-GLUCAN MARKET, BY APPLICATION,  2023–2028 (USD MILLION)
                       TABLE 141 SOUTH AMERICA: BETA-GLUCAN MARKET, BY SOURCE, 2018–2022 (USD MILLION)
                       TABLE 142 SOUTH AMERICA: BETA-GLUCAN MARKET, BY SOURCE, 2023–2028 (USD MILLION)
                       TABLE 143 SOUTH AMERICA: BETA-GLUCAN MARKET, BY SOURCE, 2018–2022 (TON)
                       TABLE 144 SOUTH AMERICA: BETA-GLUCAN MARKET, BY SOURCE, 2023–2028 (TON)
                       TABLE 145 SOUTH AMERICA: BETA-GLUCAN MARKET, BY CATEGORY,  2018–2022 (USD MILLION)
                       TABLE 146 SOUTH AMERICA: BETA-GLUCAN MARKET, BY CATEGORY,  2023–2028 (USD MILLION)
                       TABLE 147 SOUTH AMERICA: BETA-GLUCAN MARKET, BY COUNTRY, 2018–2022 (USD MILLION)
                       TABLE 148 SOUTH AMERICA: BETA-GLUCAN MARKET, BY COUNTRY, 2023–2028 (USD MILLION)
             13.5.2 BRAZIL
                       13.5.2.1 Development of food & beverage industry due to inflow of FDI
                                   TABLE 149 BRAZIL: BETA-GLUCAN MARKET, BY CATEGORY, 2018–2022 (USD MILLION)
                                   TABLE 150 BRAZIL: BETA-GLUCAN MARKET, BY CATEGORY, 2023–2028 (USD MILLION)
                                   TABLE 151 BRAZIL: BETA-GLUCAN MARKET, BY APPLICATION, 2018–2022 (USD MILLION)
                                   TABLE 152 BRAZIL: BETA-GLUCAN MARKET, BY APPLICATION, 2023–2028 (USD MILLION)
             13.5.3 ARGENTINA
                       13.5.3.1 Increase in consumer awareness regarding health benefits of beta-glucan in Argentina
                                   FIGURE 45 ARGENTINA: HEALTH EXPENDITURE (SHARE OF GDP), 2012–2017
                                   TABLE 153 ARGENTINA: BETA-GLUCAN MARKET, BY CATEGORY, 2018–2022 (USD MILLION)
                                   TABLE 154 ARGENTINA: BETA-GLUCAN MARKET, BY CATEGORY, 2023–2028 (USD MILLION)
                                   TABLE 155 ARGENTINA: BETA-GLUCAN MARKET, BY APPLICATION, 2018–2022 (USD MILLION)
                                   TABLE 156 ARGENTINA: BETA-GLUCAN MARKET, BY APPLICATION, 2023–2028 (USD MILLION)
             13.5.4 REST OF SOUTH AMERICA
                       TABLE 157 REST OF SOUTH AMERICA: BETA-GLUCAN MARKET, BY CATEGORY,  2018–2022 (USD MILLION)
                       TABLE 158 REST OF SOUTH AMERICA: BETA-GLUCAN MARKET, BY CATEGORY,  2023–2028 (USD MILLION)
                       TABLE 159 REST OF SOUTH AMERICA: BETA-GLUCAN MARKET, BY APPLICATION,  2018–2022 (USD MILLION)
                       TABLE 160 REST OF SOUTH AMERICA: BETA-GLUCAN MARKET, BY APPLICATION,  2023–2028 (USD MILLION)
     13.6 REST OF THE WORLD (ROW) 
             13.6.1 ROW: RECESSION IMPACT
                       FIGURE 46 ROW: INFLATION RATES, BY KEY COUNTRY, 2017–2021
                       FIGURE 47 ROW: RECESSION IMPACT ANALYSIS, 2023
                       TABLE 161 ROW: BETA-GLUCAN MARKET, BY APPLICATION, 2018–2022 (USD MILLION)
                       TABLE 162 ROW: BETA-GLUCAN MARKET, BY APPLICATION, 2023–2028 (USD MILLION)
                       TABLE 163 ROW: BETA-GLUCAN MARKET, BY SOURCE, 2018–2022 (USD MILLION)
                       TABLE 164 ROW: BETA-GLUCAN MARKET, BY SOURCE, 2023–2028 (USD MILLION)
                       TABLE 165 ROW: BETA-GLUCAN MARKET, BY SOURCE, 2018–2022 (TON)
                       TABLE 166 ROW: BETA-GLUCAN MARKET, BY SOURCE, 2023–2028 (TON)
                       TABLE 167 ROW: BETA-GLUCAN MARKET, BY CATEGORY, 2018–2022 (USD MILLION)
                       TABLE 168 ROW: BETA-GLUCAN MARKET, BY CATEGORY, 2023–2028 (USD MILLION)
                       TABLE 169 ROW: BETA-GLUCAN MARKET, BY REGION, 2018–2022 (USD MILLION)
                       TABLE 170 ROW: BETA-GLUCAN MARKET, BY REGION, 2023–2028 (USD MILLION)
             13.6.2 MIDDLE EAST
                       13.6.2.1 Increased health and wellness initiatives in Middle East
                                   TABLE 171 MIDDLE EAST: BETA-GLUCAN MARKET, BY CATEGORY, 2018–2022 (USD MILLION)
                                   TABLE 172 MIDDLE EAST: BETA-GLUCAN MARKET, BY CATEGORY, 2023–2028 (USD MILLION)
                                   TABLE 173 MIDDLE EAST: BETA-GLUCAN MARKET, BY APPLICATION, 2018–2022 (USD MILLION)
                                   TABLE 174 MIDDLE EAST: BETA-GLUCAN MARKET, BY APPLICATION, 2023–2028 (USD MILLION)
             13.6.3 AFRICA
                       13.6.3.1 Growing demand for natural and functional ingredients in Africa
                                   TABLE 175 AFRICA: BETA-GLUCAN MARKET, BY CATEGORY, 2018–2022 (USD MILLION)
                                   TABLE 176 AFRICA: BETA-GLUCAN MARKET, BY CATEGORY, 2023–2028 (USD MILLION)
                                   TABLE 177 AFRICA: BETA-GLUCAN MARKET, BY APPLICATION, 2018–2022 (USD MILLION)
                                   TABLE 178 AFRICA: BETA-GLUCAN MARKET, BY APPLICATION, 2023–2028 (USD MILLION)
 
14 COMPETITIVE LANDSCAPE (Page No. - 182)
     14.1 OVERVIEW 
     14.2 MARKET SHARE ANALYSIS 
               TABLE 179 BETA-GLUCAN MARKET: DEGREE OF COMPETITION (FRAGMENTED), 2022
     14.3 SEGMENTAL REVENUE ANALYSIS OF KEY PLAYERS 
               FIGURE 48 SEGMENTAL REVENUE ANALYSIS OF KEY PLAYERS, 2018–2022 (USD MILLION)
     14.4 STRATEGIES ADOPTED BY KEY PLAYERS 
               TABLE 180 STRATEGIES ADOPTED BY KEY BETA-GLUCAN MANUFACTURERS
     14.5 COMPANY EVALUATION QUADRANT (KEY PLAYERS) 
             14.5.1 STARS
             14.5.2 EMERGING LEADERS
             14.5.3 PERVASIVE PLAYERS
             14.5.4 PARTICIPANTS
                       FIGURE 49 BETA-GLUCAN MARKET: COMPANY EVALUATION QUADRANT,  2023 (KEY PLAYERS)
             14.5.5 PRODUCT FOOTPRINT
                       TABLE 181 COMPANY FOOTPRINT, BY SOURCE
                       TABLE 182 COMPANY FOOTPRINT, BY APPLICATION
                       TABLE 183 COMPANY FOOTPRINT, BY REGION
                       TABLE 184 OVERALL COMPANY FOOTPRINT
     14.6 COMPANY EVALUATION QUADRANT (STARTUPS/SMES) 
             14.6.1 PROGRESSIVE COMPANIES
             14.6.2 STARTING BLOCKS
             14.6.3 RESPONSIVE COMPANIES
             14.6.4 DYNAMIC COMPANIES
                       FIGURE 50 BETA-GLUCAN MARKET: COMPANY EVALUATION QUADRANT, 2023 (STARTUPS/SMES)
             14.6.5 COMPETITIVE BENCHMARKING OF KEY STARTUPS/SMES
                       TABLE 185 BETA-GLUCAN MARKET: DETAILED LIST OF KEY STARTUPS/SMES
                       TABLE 186 BETA-GLUCAN MARKET: COMPETITIVE BENCHMARKING OF KEY STARTUPS/SMES
     14.7 PRODUCT LAUNCHES, DEALS, AND OTHER DEVELOPMENTS 
             14.7.1 PRODUCT LAUNCHES
             14.7.2 DEALS
                       TABLE 187 BETA-GLUCAN MARKET: DEALS, 2018–2022
             14.7.3 OTHER DEVELOPMENTS
                       TABLE 188 BETA-GLUCAN MARKET: OTHER DEVELOPMENTS, 2018–2022
 
15 COMPANY PROFILES (Page No. - 204)
     15.1 KEY PLAYERS 
(Business Overview, Products Offered, Recent Developments, and MnM View (Key strengths/Right to Win, Strategic Choices Made, and Weaknesses and Competitive Threats))*
             15.1.1 TATE & LYLE PLC
                       TABLE 189 TATE & LYLE PLC: BUSINESS OVERVIEW
                       FIGURE 51 TATE & LYLE PLC: COMPANY SNAPSHOT
                       TABLE 190 TATE & LYLE PLC: PRODUCTS OFFERED
                       TABLE 191 TATE & LYLE PLC: DEALS
                       TABLE 192 TATE & LYLE PLC: OTHER DEVELOPMENTS
             15.1.2 KERRY GROUP PLC
                       TABLE 193 KERRY GROUP PLC: BUSINESS OVERVIEW
                       FIGURE 52 KERRY GROUP PLC: COMPANY SNAPSHOT
                       TABLE 194 KERRY GROUP PLC: PRODUCTS OFFERED
             15.1.3 KONINKLIJKE DSM N.V.
                       TABLE 195 KONINKLIJKE DSM N.V.: BUSINESS OVERVIEW
                       FIGURE 53 KONINKLIJKE DSM N.V.: COMPANY SNAPSHOT
                       TABLE 196 KONINKLIJKE DSM N.V.: PRODUCTS OFFERED
                       TABLE 197 KONINKLIJKE DSM N.V.: OTHER DEVELOPMENTS
             15.1.4 INTERNATIONAL FLAVORS & FRAGRANCES INC.
                       TABLE 198 INTERNATIONAL FLAVORS & FRAGRANCES INC.: BUSINESS OVERVIEW
                       FIGURE 54 INTERNATIONAL FLAVORS & FRAGRANCES INC.: COMPANY SNAPSHOT
                       TABLE 199 INTERNATIONAL FLAVORS & FRAGRANCES INC.: PRODUCTS OFFERED
                       TABLE 200 INTERNATIONAL FLAVORS & FRAGRANCES INC.: DEALS
                       TABLE 201 INTERNATIONAL FLAVORS & FRAGRANCES INC.: OTHER DEVELOPMENTS
             15.1.5 MERCK
                       TABLE 202 MERCK: BUSINESS OVERVIEW
                       FIGURE 55 MERCK: COMPANY SNAPSHOT
                       TABLE 203 MERCK: PRODUCTS OFFERED
                       TABLE 204 MERCK: OTHER DEVELOPMENTS
             15.1.6 LESAFFRE HUMAN CARE
                       TABLE 205 LESAFFRE HUMAN CARE: BUSINESS OVERVIEW
                       TABLE 206 LESAFFRE HUMAN CARE: PRODUCTS OFFERED
                       TABLE 207 LESAFFRE HUMAN CARE: DEALS
                       15.1.7 KEMIN INDUSTRIES
                       TABLE 208 KEMIN INDUSTRIES: BUSINESS OVERVIEW
                       TABLE 209 KEMIN INDUSTRIES: PRODUCTS OFFERED
                       TABLE 210 KEMIN INDUSTRIES OTHER DEVELOPMENTS
             15.1.8 ANGEL YEAST CO., LTD
                       TABLE 211 ANGEL YEAST CO., LTD: BUSINESS OVERVIEW
                       FIGURE 56 ANGEL YEAST CO., LTD: COMPANY SNAPSHOT
                       TABLE 212 ANGEL YEAST CO., LTD: PRODUCTS OFFERED
             15.1.9 LALLEMAND
                       TABLE 213 LALLEMAND: BUSINESS OVERVIEW
                       TABLE 214 LALLEMAND: PRODUCTS OFFERED
                       TABLE 215 LALLEMAND: DEALS
             15.1.10 OHLY GMBH
                       TABLE 216 OHLY GMBH: BUSINESS OVERVIEW
                       TABLE 217 OHLY GMBH: PRODUCTS OFFERED
             15.1.11 BIORIGIN - ZILOR
                       TABLE 218 BIORIGIN - ZILOR: BUSINESS OVERVIEW
                       TABLE 219 BIORIGIN - ZILOR: PRODUCTS OFFERED
             15.1.12 CEAPRO INC.
                       TABLE 220 CEAPRO INC: BUSINESS OVERVIEW
                       FIGURE 57 CEAPRO INC.: COMPANY SNAPSHOT
                       TABLE 221 CEAPRO INC: PRODUCT OFFERED
                       TABLE 222 CEAPRO INC: DEALS
                       TABLE 223 CEAPRO INC: OTHER DEVELOPMENTS
             15.1.13 SPECIALTY BIOTECH CO., LTD.
                       TABLE 224 SPECIALTY BIOTECH CO., LTD.: BUSINESS OVERVIEW
                       TABLE 225 SPECIALTY BIOTECH CO., LTD.: PRODUCTS OFFERED
             15.1.14 ALLTECH LIFE SCIENCES
                       TABLE 226 ALLTECH LIFE SCIENCES: BUSINESS OVERVIEW
                       TABLE 227 ALLTECH LIFE SCIENCES: PRODUCTS OFFERED
             15.1.15 GLYCONOVA
                       TABLE 228 GLYCONOVA: BUSINESS OVERVIEW
                       TABLE 229 GLYCONOVA: PRODUCTS OFFERED
             15.1.16 GARUDA INTERNATIONAL INC.
                       TABLE 230 GARUDA INTERNATIONAL INC.: BUSINESS OVERVIEW
             15.1.17 VAN WANKUM INGREDIENTS
                       TABLE 231 VAN WANKUM INGREDIENTS: BUSINESS OVERVIEW
                       TABLE 232 VAN WANKUM INGREDIENTS: PRODUCTS OFFERED
             15.1.18 SUPER BETA GLUCAN
                       TABLE 233 SUPER BETA GLUCAN: BUSINESS OVERVIEW
                       TABLE 234 SUPER BETA GLUCAN: PRODUCTS OFFERED
             15.1.19 LEIBER GROUP GMBH & CO KG
                       TABLE 235 LEIBER GROUP GMBH & CO KG: BUSINESS OVERVIEW
                       TABLE 236 LEIBER GROUP GMBH & CO KG: PRODUCTS OFFERED
             15.1.20 NUTRISCIENCE INNOVATIONS
                       TABLE 237 NUTRISCIENCE INNOVATIONS: BUSINESS OVERVIEW
                       TABLE 238 NUTRISCIENCE INNOVATIONS: PRODUCTS OFFERED
             15.1.21 EMBRIA HEALTH SCIENCES LLC
             15.1.22 NUTRAQ
             15.1.23 ABAC R&D AG
             15.1.24 GLUCAN CORPORATION
             15.1.25 TRANSFER POINT, INC.
*Details on Business Overview, Products Offered, Recent Developments, and MnM View (Key strengths/Right to Win, Strategic Choices Made, and Weaknesses and Competitive Threats) might not be captured in case of unlisted companies.
 
16 ADJACENT & RELATED MARKETS (Page No. - 257)
     16.1 INTRODUCTION 
               TABLE 239 ADJACENT MARKETS
     16.2 STUDY LIMITATIONS 
     16.3 FEED FLAVORS AND SWEETENERS MARKET 
             16.3.1 MARKET DEFINITION
             16.3.2 MARKET OVERVIEW
                       TABLE 240 FEED SWEETENERS MARKET, BY TYPE, 2015–2022 (USD MILLION)
                       TABLE 241 FEED SWEETENERS MARKET, BY TYPE, 2015–2022 (KT)
     16.4 STARTER CULTURE MARKET 
             16.4.1 MARKET DEFINITION
             16.4.2 MARKET OVERVIEW
                       TABLE 242 STARTER CULTURE MARKET, BY APPLICATION, 2017–2021 (USD MILLION)
                       TABLE 243 STARTER CULTURE MARKET, BY APPLICATION, 2022–2027 (USD MILLION)
 
17 APPENDIX (Page No. - 261)
     17.1 DISCUSSION GUIDE 
     17.2 KNOWLEDGESTORE: MARKETSANDMARKETS’ SUBSCRIPTION PORTAL 
     17.3 CUSTOMIZATION OPTIONS 
     17.4 AUTHOR DETAILS 


The study involved four major activities in estimating the current size of the beta-glucan market. Exhaustive secondary research was done to collect information on the market, peer market, and parent market. The next step was to validate these findings, assumptions, and sizing with industry experts across the value chain through primary research. Both top-down and bottom-up approaches were employed to estimate the complete market size. After that, market breakdown and data triangulation were used to estimate the market size of segments and subsegments.

Secondary Research

In the secondary research process, sources such as annual reports, press releases, and investor presentations of companies, white papers, certified publications, articles from regulatory bodies, trade directories, by recognized authors, and databases were used to identify and collect information for this study.

Secondary research was used to obtain key information about the industry’s supply chain, the total pool of key players, market classification, and segmentation according to the industry trends to the bottom-most level, geographic markets, and key developments from both market- and technology-oriented perspectives.

Primary Research

The beta-glucan market includes several stakeholders in the supply chain, including raw material suppliers, beta-glucan manufacturers, end-product manufacturers, and regulatory organizations. The demand side of the market is characterized by the presence of key food producers and processors, food importers/exporters, manufacturers engaged in the production of lecithin and related government agencies. The supply side is characterized by key manufacturers of beta-glucan and suppliers of raw materials.

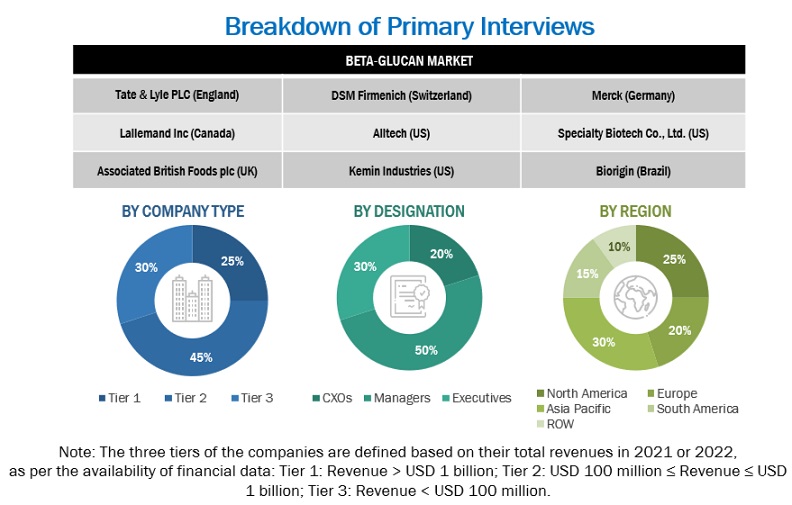
Various primary sources from supply and demand sides were interviewed to obtain qualitative and quantitative information. The primary interviewees from the demand side include key opinion leaders, executives, vice presidents, and CEOs from food & beverage and feed sectors. The primary sources from the supply side include key opinion leaders and key manufacturers in the beta-glucan market.

Breakdown of Primary Interviews

Beta-Glucan Market Size, and Share

To know about the assumptions considered for the study, download the pdf brochure

Market Size Estimation

The top-down and bottom-up approaches were used to estimate and validate the total size of the beta-glucan market. These approaches were also used extensively to estimate the size of various subsegments in the market. The research methodology used to estimate the market size includes the following details.

Top-down approach:

  • The key industry and market players were identified through extensive secondary research.
  • The industry's supply chain and market size were determined through primary and secondary research.
  • All percentage share splits and breakdowns were determined using secondary sources and verified through primary sources.

Bottom-up approach:

  • The market size was analyzed based on the share of each source of beta-glucan and its penetration within the application and form at regional and country levels. Thus, the global market was estimated with a bottom-up approach at the country level.
  • Other factors include demand within the supply chain, including the food & beverages, feed, healthcare and industrial applications; and function trends; pricing trends; adoption rate and price factors; patents registered; and organic and inorganic growth attempts.
  • All macroeconomic and microeconomic factors affecting the beta-glucan market were considered while estimating the market size.
  • All possible parameters that affect the market covered in this research study were accounted for, viewed in extensive detail, verified through primary research, and analyzed to obtain final quantitative and qualitative data.

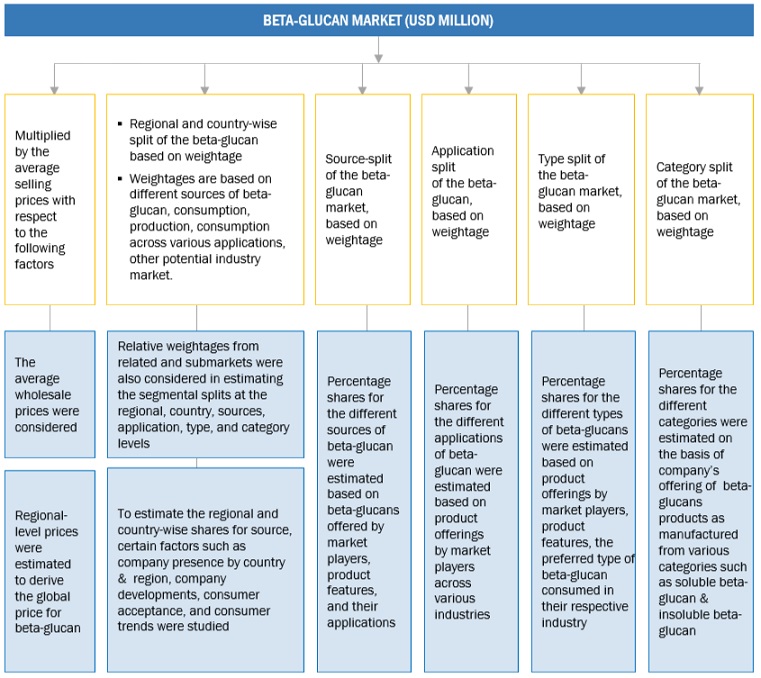
Global Beta-glucan Market Size: Bottom Up Approach

The bottom-up approach used the data extracted from secondary research to validate the market segment sizes obtained. The approach was employed to arrive at the overall size of the beta-glucan market in particular regions, and its share in the beta-glucan market at the country and regional levels was validated through primary interviews conducted with suppliers, dealers, and distributors.

Beta-Glucan Market Size, and Share

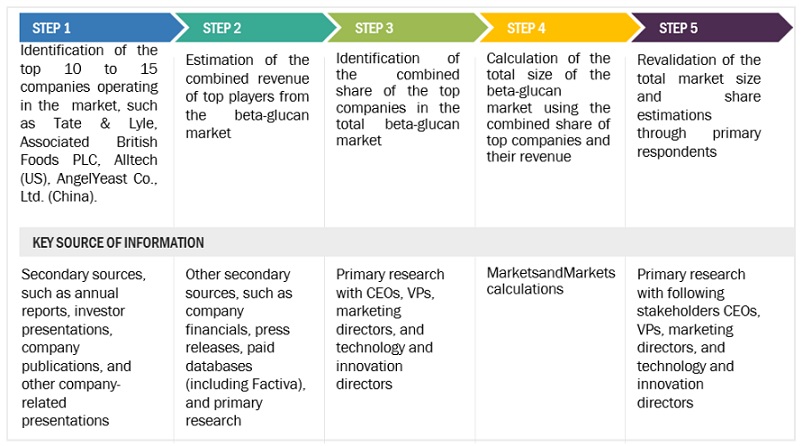
Global Beta-glucan Market Size: Top Down Approach

In the top-down approach, the overall market size was used to estimate the size of individual markets (mentioned in the segmentation) through percentage splits from secondary and primary research.

In the top-down approach, the overall market size was used to estimate the size of individual markets (mentioned in the segmentation) through percentage splits from secondary and primary research. For the calculation of each specific market segment, the most appropriate immediate parent market size was used to implement the top-down approach. The bottom-up approach was also implemented for data extracted from secondary research to validate the market segment sizes obtained.

The market share was then estimated for each company to verify the revenue share used earlier in the bottom-up procedure. With the data triangulation procedure and validation of data through primaries, the overall parent market size and each individual market size were determined and confirmed.

Beta-Glucan Market Size, and Share

Data Triangulation

After arriving at the overall market size from the estimation process explained above, the total market was split into several segments and subsegments. The data triangulation and market breakdown procedures were employed, wherever applicable, to estimate the overall beta-glucan market and arrive at the exact statistics for all segments and subsegments. The data was triangulated by studying various factors and trends from the demand and supply sides. The market size was also validated using both the top-down and bottom-up approaches.

Market Definition

Beta-glucans are naturally occurring polysaccharides that function as immunomodulatory agents. That is, they help and regulate the immune system and as dietary fibers that contribute to reducing the total plasma cholesterol and lowering the glycemic index of food. Beta-glucans are predominantly found and extracted from cell walls in yeast, fungi, and seaweed. Primary sources of beta-glucan include yeast, mushroom, seaweed, and cereals, such as oats, rye, barley, and wheat.

Key Stakeholders

  • Raw material suppliers
  • Regulatory bodies that include the following:
  • Food safety agencies, such as the Food and Drug Administration (FDA), European Food Safety Authority (EFSA), (US Department of Agriculture (USDA), and Food Standards Australia New Zealand (FSANZ)
  • Government agencies and NGOs
  • End users that include the following:
  • Food & beverage manufacturers/suppliers
  • Health & personal care product manufacturers/suppliers
  • Retailers/wholesalers
  • Commercial Research & Development (R&D) institutions and financial institutions
  • Importers and exporters of beta-glucan
  • Traders, distributors, and suppliers
  • Research organizations, trade associations, and industry bodies

Report Objectives

Market Intelligence

  • Determining and projecting the size of the beta-glucan market, with respect to sources, applications, categories, and regional markets, over a six-year period, ranging from 2023 to 2028
  • Identifying the attractive opportunities in the market by determining the largest and fastest-growing segments across regions
  • Providing detailed information about the key factors influencing the growth of the market (drivers, restraints, opportunities, and industry-specific challenges)
  • Analyzing the 1micro markets with respect to individual growth trends, prospects, and their contribution to the total market

Competitive Intelligence

  • Identifying and profiling the key players in the beta-glucan market
  • Providing a comparative analysis of market leaders on the basis of the following:
  • Product offerings
  • Business strategies
  • Strengths and weaknesses
  • Key financials
  • Understanding the competitive landscape and identifying the major growth strategies adopted by players across the key regions
  • Analyzing the value chain and products across the key regions and their impact on the prominent market players
  • Providing insights on key product innovations and investments in the beta-glucan market

Available Customizations

With the given market data, MarketsandMarkets offers customizations according to the company’s specific scientific needs.

The following customization options are available for the report:

Geographic Analysis

  • Further breakdown of the Rest of Europe market into Poland, Russia and Sweden
  • Further breakdown of the Rest of Asia Pacific market into Thailand, Malaysia and Indonesia
  • Further breakdown of the Rest of South America market into Colombia, Chile, and Paraguay
Custom Market Research Services

We will customize the research for you, in case the report listed above does not meet with your exact requirements. Our custom research will comprehensively cover the business information you require to help you arrive at strategic and profitable business decisions.

Request Customization

Instant Answers with GPT - Ask Now!

Ask real questions. Get complete answers !
Report Code
FB 5113
Published ON
Apr, 2023
Choose License Type
BUY NOW
  • SHARE
X
Request Customization
Speak to Analyst
Speak to Analyst
OR FACE-TO-FACE MEETING
PERSONALIZE THIS RESEARCH
  • Triangulate with your Own Data
  • Get Data as per your Format and Definition
  • Gain a Deeper Dive on a Specific Application, Geography, Customer or Competitor
  • Any level of Personalization
REQUEST A FREE CUSTOMIZATION
LET US HELP YOU!
  • What are the Known and Unknown Adjacencies Impacting the Beta-Glucan Market
  • What will your New Revenue Sources be?
  • Who will be your Top Customer; what will make them switch?
  • Defend your Market Share or Win Competitors
  • Get a Scorecard for Target Partners
CUSTOMIZED WORKSHOP REQUEST
+1-888-600-6441
  • Call Us
  • +1-888-600-6441 (Corporate office hours)
  • +1-888-600-6441 (US/Can toll free)
  • +44-800-368-9399 (UK office hours)
CONNECT WITH US
ABOUT TRUST ONLINE
©2024 MarketsandMarkets Research Private Ltd. All rights reserved
DMCA.com Protection Status Website Feedback