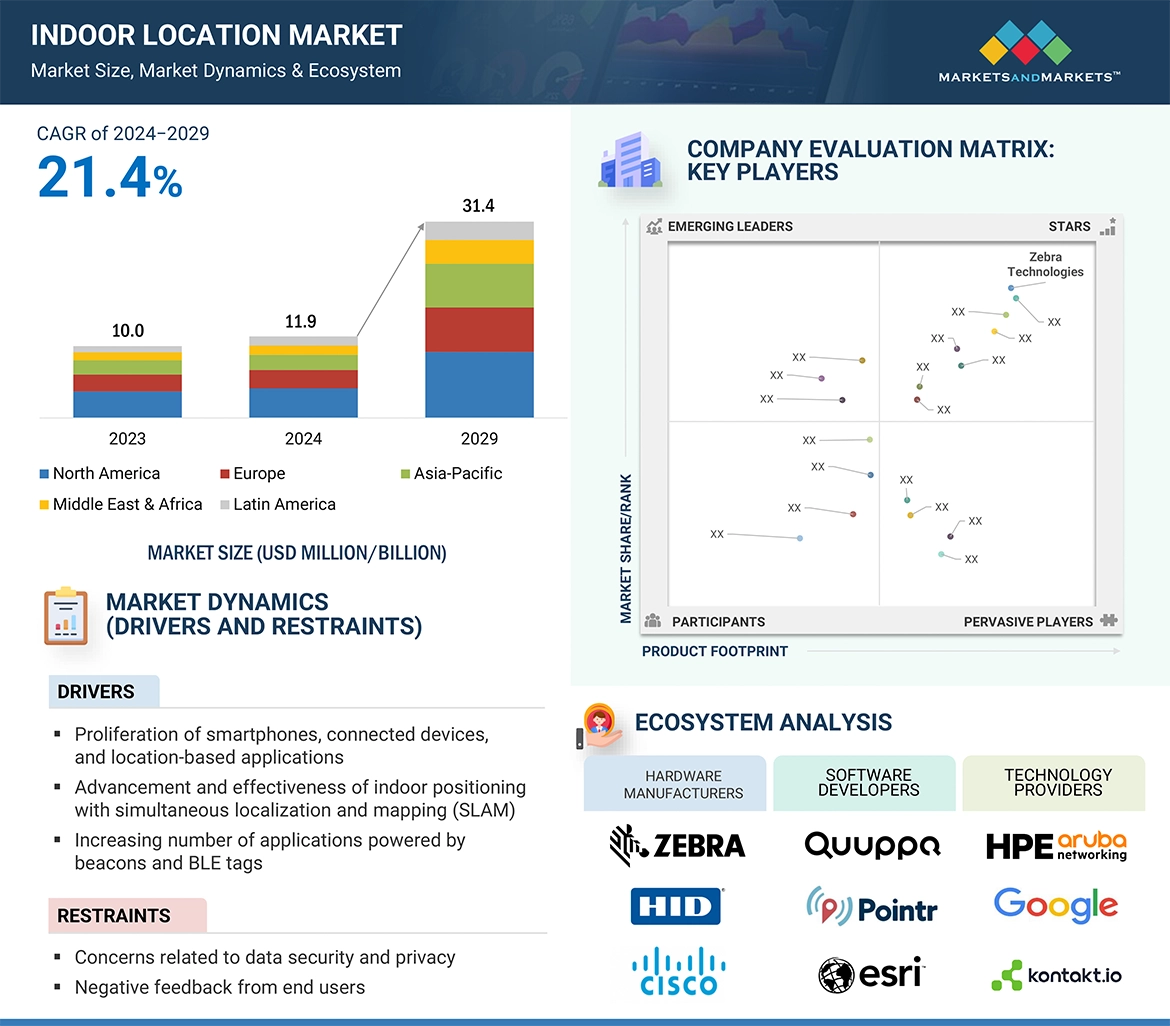
Indoor Location Market

Indoor Location Market by Component (Hardware, Solutions, and Services), Technology (BLE, UWB, Wi-Fi, RFID), Application (Emergency Response Management, Remote Monitoring, Predictive Asset Maintenance), Vertical and Region - Global Forecast to 2028

Report Code: TC 2878 Jun, 2023, by marketsandmarkets.com

Indoor Location Market - Size, Growth, Report & Analysis

[278 Pages Report] The global Indoor Location Market size as per revenue was surpassed $10.9 billion in 2023 and is anticipated to hit a revenue around $29.8 billion by the end of 2028, projecting a CAGR of 22.3% during the forecast period (2023-2028). The base year for estimation is 2022 and the market size available for the years 2017 to 2028.

This growth can be attributed to the proliferation of smartphones, connected devices, and location-based applications, which is reflected by the fact that there are approximately 4.2 billion smartphone users globally in 2023. The increased number of applications powered by beacons and BLE tags, the growing integration of beacons in cameras, LED lighting, PoS devices, and digital signage, and the inefficiency of GPS in indoor environments are expected to drive the indoor location market. The need and utilization of indoor location technologies, including RFID tags, BLE beacons, and Wi-Fi, would improve public offices and hospitals’ infrastructure in absorbing information with the effective location of objects and people. To enhance the current fluidity of working within hospitals, numerous indoor location firms offer asset tracking services to locate hospital assets. This solution allows the user to identify inventories of high values, such as wheelchairs, so that it becomes easier for the personnel to locate the inventories when they are required. Moreover, the growing use of 5G for location-based services, increased focus on Industry 4.0, smart city initiatives, and smart manufacturing are expected to provide a substantial opportunity for the indoor location market to flourish in the years ahead.

Indoor Location Market

To know about the assumptions considered for the study, Request for Free Sample Report

Indoor Location Market

To know about the assumptions considered for the study, download the pdf brochure

Indoor Location Market Growth Dynamics

Driver: The power of simultaneous localization and mapping (SLAM)

The development and accuracy of indoor positioning systems depend greatly on the tools using Simultaneous Localization and Mapping (SLAM). SLAM utilizes computer vision, sensors, and mapping to establish the layout of an unfamiliar environment and estimate the observer’s position. With the help of data from multiple sensors, the SLAM algorithms can accurately localize the user in real-time, even in large indoor environments. It constructs and updates the map of the environment, combining new data from the sensors and the position of the landmarks. SLAM has the capability and capacity to understand the environment with the help of vision, geometry, and topology to position and map accurately and to respond to dynamic changes within complex indoor spaces. The linkage with other indoor positioning systems improves the system's performance. In conclusion, SLAM techniques propel indoor positioning systems through enhanced precision, real-time mapping, adaptability, and the implementation of physically and computationally superior indoor positioning.

Restraint: Concerns related to data security and privacy

Location-based data is sensitive information that must be protected at all costs. However, several concerns and fears are established by looking at the technical details of IPS more closely. Indoor location-based techniques are used in various fields, such as object tracking and locating people within a certain range. Because people spend a lot of time indoors, it is important for users and service providers to get accurate indoor location information. There are several technologies to gain indoor location information, such as Wi-Fi, BLE, and RFID, which require the characteristics of data, security, and privacy. Fingerprinting is one of the most recent technologies that is being deployed by several verticals. Mobile device users usually make use of an application provided by the service provider to access information from indoor positioning services. In such cases, these users send their unique identifier (Media Access Control [MAC] address) to the server, which enables the service provider to gain information related to the position of the user, posing a serious threat to the privacy of the user. These threats of data leaks can be a major disadvantage for the adoption of indoor location technologies.

Opportunity: Increasing demand for RFID tags across retail industry

For retailers, meeting the needs of their customers is the most important job. If one can order a particular product online and the company can have it shipped to the local store, it can be a win-win situation for everyone. If the customer orders the product and gets notice that it has been shipped, but the store misplaces it, it can be a huge disadvantage for the retailer. RFID technology mainly uses passive tags for location-related information, which is characterized by a small radius of detection with no need for an internal source. RFID tags are implemented due to their reduced cost. RFID is a technology that can help retailers, consumers, and brand owners with the ability to have clear, real-time insights into their inventory and its use in self-checkout, product information, and payment processes. This technology is projected to appear throughout the retail world. For example, Mammut Sports Group AG has embedded Smartrac Circus Flex NFC tags into some of its products. This, in turn, will allow consumers to receive digital content through Mammut Connect, Mammut’s smartphone app. RFID helps brands and retailers become more efficient as it provides them with several new opportunities, insights, additional services, and customized, defined, and instant information.

Challenge: Dearth of uniform standards and interoperability, and system incompatibility

End users have to choose from a wider range of available solutions; however, the lack of uniform standards makes it difficult to integrate the available solutions. The incompatibility between various infrastructures and the lack of interoperability creates problems for end users. Companies such as Zebra Technologies, HID Global, and Inpixon provide indoor location solutions that support more than one protocol; however, most of the players in the market primarily focus on a single protocol. Since different technologies operate on different protocols and frequency bands, there is no interoperability between various indoor location solutions, except for solutions provided by a few vendors, such as Zebra Technologies, which offer multiple indoor location technologies that are supported by the same middleware.

Currently, the major issue in the indoor location market is the availability of solutions with multiple interoperable technologies under the same roof. The installation of the indoor location solution integrated with multiple technologies, either in an enterprise or any institutional area, requires changes to be made in the existing infrastructure, such as additional servers, middleware, and other integrated systems. Putting a tag on assets, equipment, or personnel requires location readers to be set up in the doorways and hallways and an alteration in the protocol to locate assets.

Indoor Location Market Ecosystem

companies in this market include well-established, financially stable provider of indoor location hardware, solutions and services. These companies have been operating in the market for several years and possess a diversified product portfolio, state-of-the-art technologies, and strong global sales and marketing networks. Prominent companies in this market include Zebra Technologies (US), Cisco (US), Google (US), Microsoft (US), HPE (US).

Indoor Location Market

Based on services, the managed services segment is expected to register higher CAGR during forecast period

Managed services play a vital role in indoor location tracking by providing comprehensive support and expertise in implementing and managing the infrastructure and systems involved. These services encompass the design, deployment, configuration, and maintenance of the indoor location tracking solution. Managed service providers offer technical expertise, monitoring capabilities, and ongoing support to ensure the smooth operation and optimization of the tracking system. Managed services provide all required skillsets to maintain and upgrade solutions, which are of utmost importance in the indoor location or positioning environment.

By technology, Bluetooth Low Energy (BLE) technology is expected to hold the largest market size during the forecast

The indoor location uses BLE signals from battery-operated beacons as its primary technology. One of the most recent technologies to develop and become a market standard is BLE, which is now present on the majority of devices. The bicycles were stolen from Michelin, a city in Belgium. Infsoft provided a Bluetooth beacon-based indoor tracking system based on infsoft Locator Nodes to resolve this issue. The solution allowed the local law enforcement to get the bikes back, convict the thieves, and lessen the quantity of thefts.

Based on vertical, the retail segment is expected to hold the largest market size during the forecast

Retailers need to manage their customer data to enhance customer experience. Retailers are now focusing on creating a 360-degree view of customers, which leads to customer satisfaction. Retailers use digital and offline marketing to increase sales. However, they often lack the means to connect with customers at the most important moment when they are passing by or in their stores. With the rising smartphone penetration and the changing consumer mobile buyer behavior, start-ups and established organizations are quickly looking for ways to provide location-based apps to engage their users indoors. Retailers may use indoor location software to boost sales, revenues, and customer pleasure. A decent mall navigation software enhances the shopping experience while also boosting sales. Location analytics provides accurate information on visitor flows within a property. The adoption of location-based marketing applications to drive product sales for higher revenues and profitability would increase customer experience.

Based on region, North America is expected to hold the largest market size during the forecast

Due to the widespread acceptance of technology by people and the presence of the major market players in the area, North America is anticipated to hold the highest share of the indoor location market during the forecast period. With substantial developments in the creation of smart cities, the US and Canada are the main markets in the area. In order to improve people and asset tracking throughout huge buildings, businesses, particularly in the US, have begun implementing indoor navigation and indoor tracking solutions. The rise of vendors in North America is being driven by the use of technologies like BLE, Wi-Fi, and UWB. Companies like Zebra Technologies, Inpixon, Apple, and Microsoft have launched indoor location solutions and services to meet the diverse needs of businesses and their clients as a result of rising consumer demand for indoor maps and the limited features of indoor GPS technology.

Indoor Location Market by Region

Market Players:

The major vendors in this Indoor location market include Zebra Technologies (US), Cisco (US), Google (US), Microsoft (US), HPE (US), Apple (US), Esri (US), Acuity Brands(US), Inpixon(US), HERE Technologies (US), HID Global (US), CenTrak (US), Sonitor (Norway), Ubisense (UK), infsoft (Germany), Polaris Wireless (US), Quuppa (Finland), Securitas Healthcare (US), Navigine (US), Blueiot (China), Kontakt.io (US), AiRISTA (US), InnerSpace (Canada), Syook (India), Oriient (Israel), Navenio (England), Situm (Spain), Pozyx (Belgium), Azitek (Portugal), and Mapxus (China). These players have adopted various growth strategies, such as partnerships, agreements and collaborations, new product launches and product enhancements, and acquisitions to expand their footprint in the location based entertainment market.

Get online access to the report on the World's First Market Intelligence Cloud

  • Easy to Download Historical Data & Forecast Numbers
  • Company Analysis Dashboard for high growth potential opportunities
  • Research Analyst Access for customization & queries
  • Competitor Analysis with Interactive dashboard
  • Latest News, Updates & Trend analysis
Request Sample

Scope of the Report

Report Metrics

Details

Market size available for years

2017-2028

Base year considered

2022

Forecast period

2023–2028

Forecast units

Value (USD) Million/Billion

Segments covered

By Offering, application, technology, vertical, and regions

Region covered

North America, Europe, Asia Pacific, Middle East and Africa, and Latin America

Companies covered

Zebra Technologies Corporation (US), Cisco (US), Google (US), Microsoft (US), HPE (US), Apple (US), Esri (US), Acuity Brands(US), Inpixon(US), HERE Technologies (US), HID Global (US), CenTrak (US), Sonitor (Norway), Ubisense (UK), infsoft (Germany), Polaris Wireless (US), Quuppa (Finland), Securitas Healthcare (US), Navigine (US), Blueiot (China), Kontakt.io (US), AiRISTA (US), InnerSpace (Canada), Syook (India), Oriient (Israel), Navenio (England), Situm (Spain), Pozyx (Belgium), Azitek (Portugal), and Mapxus (China).

This research report categorizes the indoor location market to forecast revenues and analyze trends in each of the following submarkets:

Based on Offering:
  • Hardware
    • System on Chip
    • Beacons
    • Tags
    • Sensors
    • Gateways
    • Fixed Readers
    • Wi-Fi Access Points
  • Solutions
    • Indoor Tracking
      • Asset and People Tracking
      • Indoor Location Analytics
    • Indoor Navigation
    • Database Management System
  • Services
    • Professional Services
      • Training and Consulting
      • Support and Maintenance
      • System Integration and Implementation
    • Managed Services
Based on Application:
  • Emergency Response Management
  • Sales and Marketing Optimization
  • Remote Monitoring
  • Predictive Asset Maintenance
  • Supply Chain Management
  • Inventory Management
  • Other Applications
By Technology:
  • BLE
  • UWB
  • Wi-Fi
  • RFID
  • Magnetic Positioning
  • Other Technologies
By Vertical:
  • Retail
  • Travel and Hospitality
  • Media and Entertainment
  • Transportation and Logistics
  • Government and Public Sector
  • Manufacturing
  • Healthcare and Pharmaceuticals
  • Other Verticals
By Region:
  • North America
    • United States (US)
    • Canada
  • Europe
    • United Kingdom (UK)
    • Germany
    • France
    • Italy
    • Spain
    • Nordics
    • Rest of Europe
  • Asia Pacific
    • China
    • Japan
    • India
    • Australia and New Zealand
    • Southeast Asia
    • Rest of Asia Pacific
  • Middle East and Africa
    • UAE
    • KSA
    • Israel
    • South Africa
    • Rest of Middle East and Africa
  • Latin America
    • Brazil
    • Mexico
    • Rest of Latin America

Recent Developments:

  • In January 2023, Apple launched Apple Business Connect. Apple Maps gained a new tool Apple Business Connect: It will now allow business owners to update and manage their own information on the platform, including key details like business hours and location, photos, logos, special offers and promotions, and more.
  • In April 2022, Google partnered with Oriient, to create a joint offering for in-store navigation and proximity marketing.
  • In January 2022, Cisco acquired Opsani. The acquisition will further enable Cisco AppDynamics to grow its product and engineering team and expand its platform's capabilities.
  • In January 2022, HERE launched Indoor Map as a service: a one-stop shop for indoor mapping solutions that includes indoor map data, routing, and positioning, all available through the HERE SDK and seamlessly connected with its base map.

Frequently Asked Questions (FAQ):

To speak to our analyst for a discussion on the above findings, click Speak to Analyst

TABLE OF CONTENTS
 
1 INTRODUCTION (Page No. - 32)
    1.1 STUDY OBJECTIVES 
    1.2 MARKET DEFINITION 
           1.2.1 INCLUSIONS AND EXCLUSIONS
    1.3 MARKET SCOPE 
           1.3.1 MARKET SEGMENTATION
           1.3.2 REGIONS COVERED
           1.3.3 YEARS CONSIDERED
    1.4 CURRENCY CONSIDERED 
    1.5 STAKEHOLDERS 
    1.6 SUMMARY OF CHANGES 
 
2 RESEARCH METHODOLOGY (Page No. - 37)
    2.1 RESEARCH DATA 
           2.1.1 SECONDARY DATA
                    2.1.1.1 Key data from secondary sources
           2.1.2 PRIMARY DATA
                    2.1.2.1 List of key primary interview participants
                    2.1.2.2 Breakup of primary profiles
                    2.1.2.3 Key data from primary sources
                    2.1.2.4 Key insights from industry experts
    2.2 MARKET BREAKUP AND DATA TRIANGULATION 
    2.3 MARKET SIZE ESTIMATION 
           2.3.1 TOP-DOWN APPROACH
           2.3.2 BOTTOM-UP APPROACH
    2.4 MARKET FORECAST 
    2.5 ASSUMPTIONS 
    2.6 LIMITATIONS 
    2.7 RECESSION IMPACT ANALYSIS 
 
3 EXECUTIVE SUMMARY (Page No. - 50)
 
4 PREMIUM INSIGHTS (Page No. - 55)
    4.1 ATTRACTIVE OPPORTUNITIES FOR COMPANIES IN INDOOR LOCATION MARKET 
    4.2 NORTH AMERICA: INDOOR LOCATION MARKET, BY OFFERING AND TOP THREE APPLICATIONS, 2023 
    4.3 ASIA PACIFIC: INDOOR LOCATION MARKET, BY OFFERING AND TOP THREE COUNTRIES, 2023 
 
5 MARKET OVERVIEW AND INDUSTRY TRENDS (Page No. - 57)
    5.1 INTRODUCTION 
    5.2 MARKET DYNAMICS 
           5.2.1 DRIVERS
                    5.2.1.1 Proliferation of smartphones, connected devices, and location-based applications
                    5.2.1.2 Advancement and effectiveness of indoor positioning with SLAM
                    5.2.1.3 Increased number of applications powered by beacons and BLE tags
                    5.2.1.4 Growing integration of beacons in cameras, LED lighting, PoS devices, and digital signage
                    5.2.1.5 Inefficiency of GPS in indoor environments
           5.2.2 RESTRAINTS
                    5.2.2.1 Concerns related to data security and privacy
                    5.2.2.2 Negative feedback from end users
                    5.2.2.3 Stringent government regulations
                    5.2.2.4 High installation and maintenance costs
           5.2.3 OPPORTUNITIES
                    5.2.3.1 Increasing demand for RFID tags across retail industry
                    5.2.3.2 Growing use of 5G for location-based services
                    5.2.3.3 Growing demand for indoor location technologies to support lean automation and robotic processes
                    5.2.3.4 Focus on Industry 4.0 smart cities and smart manufacturing
           5.2.4 CHALLENGES
                    5.2.4.1 Lack of skills and awareness related to indoor location technologies
                    5.2.4.2 Dearth of uniform standards and interoperability coupled with system incompatibility
           5.2.5 CUMULATIVE GROWTH ANALYSIS
    5.3 INDUSTRY TRENDS 
           5.3.1 VALUE CHAIN ANALYSIS
           5.3.2 BRIEF HISTORY OF INDOOR LOCATION SOLUTIONS
                    5.3.2.1 2000-2009
                    5.3.2.2 2010-2019
                    5.3.2.3 2020-Present
           5.3.3 
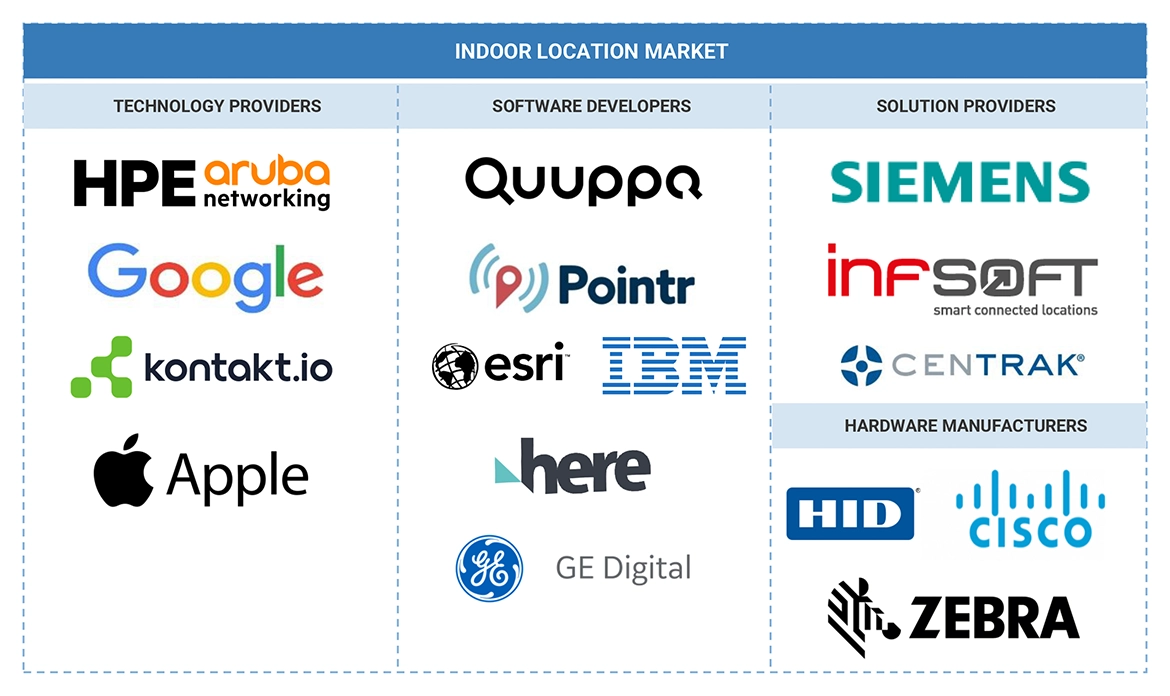
ECOSYSTEM/MARKET MAP
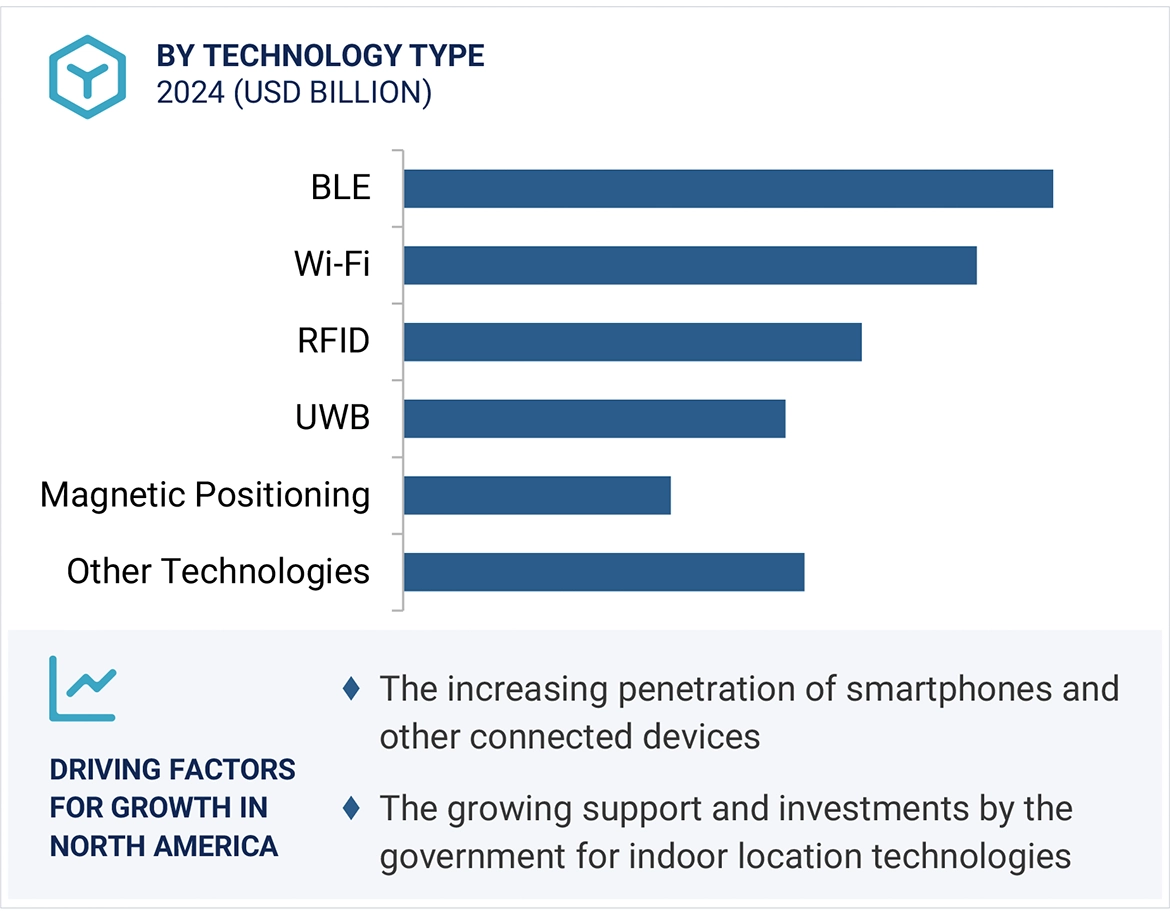
           5.3.4 INDOOR LOCATION TOOLS, FRAMEWORKS, AND TECHNIQUES
           5.3.5 BUSINESS MODEL
           5.3.6 ARCHITECTURE
                    5.3.6.1 Magnetic field approach
                    5.3.6.2 Fingerprinting
                    5.3.6.3 Smartphone data
           5.3.7 PORTER’S FIVE FORCES MODEL
                    5.3.7.1 Threat of new entrants
                    5.3.7.2 Threat of substitutes
                    5.3.7.3 Bargaining power of suppliers
                    5.3.7.4 Bargaining power of buyers
                    5.3.7.5 Intensity of competitive rivalry
           5.3.8 INDOOR LOCATION IMPACT ON ADJACENT NICHE TECHNOLOGIES
                    5.3.8.1 Internet of Things (IoT)
                    5.3.8.2 Augmented Reality (AR) and Virtual Reality (VR)
                    5.3.8.3 Mobile applications and app development
                    5.3.8.4 Indoor mapping and Geographic Information Systems (GIS)
                    5.3.8.5 Asset tracking and inventory management
                    5.3.8.6 Smart buildings and facilities management
                    5.3.8.7 Data analytics and business intelligence
           5.3.9 KEY STAKEHOLDERS AND BUYING CRITERIA
                    5.3.9.1 Key stakeholders in buying process
                    5.3.9.2 Buying criteria
           5.3.10 TECHNOLOGY ANALYSIS
                    5.3.10.1 Adjacent technologies
                               5.3.10.1.1 IoT
                               5.3.10.1.2 ML
                               5.3.10.1.3 Blockchain
                               5.3.10.1.4 5G
                    5.3.10.2 Related technologies
                               5.3.10.2.1 Wi-Fi-based positioning
                               5.3.10.2.2 BLE beacons
                               5.3.10.2.3 Inertial Measurement Units (IMUs)
                               5.3.10.2.4 Indoor mapping and 3D modeling
           5.3.11 FUTURE OF INDOOR LOCATION MARKET LANDSCAPE
           5.3.12 TRENDS/DISRUPTIONS IMPACTING CUSTOMER BUSINESS
           5.3.13 BEST PRACTICES OF INDOOR LOCATION MARKET
           5.3.14 PATENT ANALYSIS
                    5.3.14.1 Methodology
                    5.3.14.2 Document type
                    5.3.14.3 Innovation and patent application
                    5.3.14.4 Top applicants
           5.3.15 PRICING MODEL ANALYSIS
           5.3.16 CASE STUDY ANALYSIS
                    5.3.16.1 Las Vegas Convention Center helped visitors find their way with Indoor Google Maps
                    5.3.16.2 OSRAM Malaysia deployed Blueiot RTLS to track assets accurately and protect them
                    5.3.16.3 Kesko increased average check by 6% using indoor navigation by Navigine
                    5.3.16.4 Ericsson collaborated with Senion to enhance workplace employee performance
                    5.3.16.5 TPF adopted Ubisense RTLS solution for efficient business operations
                    5.3.16.6 Toshin Industry Co. Ltd improved its production quality by deploying new plating methods from Quuppa
           5.3.17 KEY CONFERENCES & EVENTS, 2023–2024
           5.3.18 REGULATORY FRAMEWORK
                    5.3.18.1 General Data Protection Regulation (GDPR)
                    5.3.18.2 Open Geospatial Consortium (OGC)
                    5.3.18.3 World Wide Web Consortium (W3C)
                    5.3.18.4 Health Insurance Portability and Accountability Act (HIPPA) of 1996
                    5.3.18.5 Institute of Electrical and Electronics Engineers
                    5.3.18.6 Act of Protection of Personal Information (APPI)
                    5.3.18.7 Designing Accounting Safeguards to Help Broaden Oversight and Regulations on Data (DASHBOARD)
                    5.3.18.8 Personal Data Protection Act (PDPA)
                    5.3.18.9 California Consumer Privacy Act (CCPA)
 
6 INDOOR LOCATION MARKET, BY OFFERING (Page No. - 88)
    6.1 INTRODUCTION 
           6.1.1 OFFERING: INDOOR LOCATION MARKET DRIVERS
    6.2 HARDWARE 
           6.2.1 RISING DEMAND FOR TECHNOLOGIES TO ACCURATELY DETERMINE LOCATION TO DRIVE MARKET
           6.2.2 BEACONS
           6.2.3 TAGS
           6.2.4 SENSORS
           6.2.5 GATEWAYS
           6.2.6 FIXED RFID READERS
           6.2.7 WI-FI ACCESS POINTS
    6.3 SOLUTIONS 
           6.3.1 NEED TO ENHANCE INDOOR NAVIGATION AND TRACKING ABILITY TO GROW DEMAND FOR INDOOR LOCATION SOLUTIONS
           6.3.2 INDOOR TRACKING
                    6.3.2.1 Asset & people tracking
                    6.3.2.2 Indoor location analytics
           6.3.3 INDOOR NAVIGATION
           6.3.4 DATABASE MANAGEMENT SYSTEM
    6.4 SERVICES 
           6.4.1 NEED TO ACCURATELY MONITOR ASSETS AND INDIVIDUALS WITHIN INDOOR SPACES TO PROPEL MARKET
           6.4.2 MANAGED SERVICES
           6.4.3 PROFESSIONAL SERVICES
                    6.4.3.1 Training & consulting
                    6.4.3.2 Support & maintenance
                    6.4.3.3 System integration & implementation
 
7 INDOOR LOCATION MARKET, BY TECHNOLOGY (Page No. - 108)
    7.1 INTRODUCTION 
           7.1.1 TECHNOLOGY: INDOOR LOCATION MARKET DRIVERS
    7.2 BLUETOOTH LOW ENERGY (BLE) 
           7.2.1 NEED FOR CHEAP, HANDY, AND BATTERY-DRIVEN BEACONS TO DRIVE DEMAND FOR BLUETOOTH LOW ENERGY
    7.3 ULTRA-WIDEBAND 
           7.3.1 ABILITY TO WIDEN RADIO STRENGTH AND PROVIDE EXCESSIVE BANDWIDTH TO DRIVE DEMAND FOR UWB
    7.4 WI-FI 
           7.4.1 NEED FOR WIDER NETWORK DISTANCE AND STRONGER SIGNAL TO PROPEL DEMAND FOR WI-FI
    7.5 RADIO-FREQUENCY IDENTIFICATION (RFID) 
           7.5.1 NEED FOR CHEAP ASSET/PERSONAL TRACKING SOLUTIONS TO BOOST DEMAND FOR RFID
    7.6 MAGNETIC POSITIONING 
           7.6.1 RISING ADOPTION OF SMARTPHONES TO DETECT AND RESPOND TO MAGNETIC FIELDS TO DRIVE MARKET
    7.7 OTHER TECHNOLOGIES 
 
8 INDOOR LOCATION MARKET, BY APPLICATION (Page No. - 117)
    8.1 INTRODUCTION 
           8.1.1 APPLICATION: INDOOR LOCATION MARKET DRIVERS
    8.2 EMERGENCY RESPONSE MANAGEMENT 
           8.2.1 DEMAND TO REDUCE VULNERABILITY TO HAZARDS AND COPE WITH DISASTERS TO DRIVE MARKET
    8.3 SALES & MARKETING OPTIMIZATION 
           8.3.1 NEED FOR OPTIMIZED SHOPPING EXPERIENCE TO INCREASE REVENUE AND PROFITABILITY TO BOOST MARKET
    8.4 REMOTE MONITORING 
           8.4.1 NEED FOR PATIENT MONITORING, IMPROVED USER EXPERIENCE, AND PREVENTION OF DATA LOSS TO PROPEL MARKET
    8.5 PREDICTIVE ASSET MAINTENANCE 
           8.5.1 NEED TO TRACK INDOOR ASSETS AND EQUIPMENT TO BOOST DEMAND FOR ASSET MAINTENANCE
    8.6 SUPPLY CHAIN MANAGEMENT 
           8.6.1 DEMAND TO IMPROVE ORDER PICKING AND STOCK-TAKING PROCESS IN WAREHOUSES TO DRIVE MARKET
    8.7 INVENTORY MANAGEMENT 
           8.7.1 NEED TO IMPROVE ASSET MANAGEMENT AND INCREASE INVENTORY TURNOVER BY TRACKING ASSETS TO PROPEL MARKET
    8.8 OTHER APPLICATIONS 
 
9 INDOOR LOCATION MARKET, BY VERTICAL (Page No. - 127)
    9.1 INTRODUCTION 
           9.1.1 VERTICAL: INDOOR LOCATION MARKET DRIVERS
    9.2 RETAIL 
           9.2.1 NEED FOR INVENTORY MANAGEMENT TO BOOST SALES TO DRIVE MARKET
           9.2.2 RETAIL: INDOOR LOCATION USE CASES
                    9.2.2.1 Inventory management
                    9.2.2.2 Personalized marketing and advertising
                    9.2.2.3 Indoor navigation
                    9.2.2.4 Customer analytics
    9.3 TRAVEL & HOSPITALITY 
           9.3.1 NEED TO ENHANCE NAVIGATION, RESOURCE MANAGEMENT, AND TRAVELER EXPERIENCE TO BOOST MARKET
           9.3.2 TRAVEL & HOSPITALITY: INDOOR LOCATION USE CASES
                    9.3.2.1 Wayfinding and navigation
                    9.3.2.2 Travelers facility and resource management
                    9.3.2.3 Proximity-based services
                    9.3.2.4 Personalized recommendations
    9.4 MEDIA & ENTERTAINMENT 
           9.4.1 NEED TO DELIVER TARGETED ADVERTISEMENTS AND IMPROVE OVERALL EXPERIENCES TO PROPEL MARKET
           9.4.2 MEDIA & ENTERTAINMENT: INDOOR LOCATION USE CASES
                    9.4.2.1 Improved visitor experiences
                    9.4.2.2 Gaming and interactive experiences
                    9.4.2.3 Facility and resource management
                    9.4.2.4 Targeted advertising and promotions
    9.5 TRANSPORTATION & LOGISTICS 
           9.5.1 RISING ADOPTION OF INDOOR LOCATION SOLUTIONS FOR ASSET TRACKING, ROUTE OPTIMIZATION, AND SECURITY
           9.5.2 TRANSPORTATION & LOGISTICS: INDOOR LOCATION USE CASES
                    9.5.2.1 Asset tracking
                    9.5.2.2 Last-mile delivery optimization
                    9.5.2.3 Route optimization
                    9.5.2.4 Safety and security
    9.6 GOVERNMENT & PUBLIC SECTOR 
           9.6.1 NEED TO MANAGE SMART CITY PLANNING, EMERGENCY RESPONSE, AND BORDER CONTROL TO DRIVE MARKET
           9.6.2 GOVERNMENT & PUBLIC SECTOR: INDOOR LOCATION USE CASES
                    9.6.2.1 Emergency response and crisis management
                    9.6.2.2 Smart city planning and management
                    9.6.2.3 Disaster preparedness and recovery
                    9.6.2.4 Border control and security
    9.7 MANUFACTURING 
           9.7.1 INDOOR LOCATION SOLUTIONS TO IMPLEMENT WORKFLOW OPTIMIZATION AND QUALITY CONTROL
           9.7.2 MANUFACTURING: INDOOR LOCATION USE CASES
                    9.7.2.1 Process optimization
                    9.7.2.2 Inventory management
                    9.7.2.3 Workflow optimization
                    9.7.2.4 Quality control
    9.8 HEALTHCARE & PHARMACEUTICALS 
           9.8.1 NEED FOR INFECTION CONTROL, ENHANCED PATIENT EXPERIENCE, AND PATIENT TRACKING TO DRIVE MARKET
           9.8.2 HEALTHCARE & PHARMACEUTICALS: INDOOR LOCATION USE CASES
                    9.8.2.1 Infection control
                    9.8.2.2 Asset and equipment tracking
                    9.8.2.3 Patient tracking and workflow optimization
                    9.8.2.4 Enhanced patient experience
    9.9 OTHER VERTICALS 
           9.9.1 OTHER VERTICALS: INDOOR LOCATION USE CASES
                    9.9.1.1 Attendance monitoring
                    9.9.1.2 Branch navigation
                    9.9.1.3 Maintenance and repair
                    9.9.1.4 Asset and equipment tracking
 
10 INDOOR LOCATION MARKET, BY REGION (Page No. - 143)
     10.1 INTRODUCTION 
     10.2 NORTH AMERICA 
             10.2.1 NORTH AMERICA: INDOOR LOCATION MARKET DRIVERS
             10.2.2 NORTH AMERICA: RECESSION IMPACT
             10.2.3 US
                       10.2.3.1 Advanced infrastructure and increased government support to drive market
             10.2.4 CANADA
                       10.2.4.1 Advanced IoT technology and significant investments in infrastructural development to drive market
     10.3 EUROPE 
             10.3.1 EUROPE: INDOOR LOCATION MARKET DRIVERS
             10.3.2 EUROPE: RECESSION IMPACT
             10.3.3 UK
                       10.3.3.1 Growing adoption of mobile subscriptions and increasing use of smartphones to boost market
             10.3.4 GERMANY
                       10.3.4.1 Rapid digitization to fuel demand for indoor location technologies
             10.3.5 FRANCE
                       10.3.5.1 Adoption of advanced location-based services and need for enhanced performance to drive market
             10.3.6 SPAIN
                       10.3.6.1 Demand for improved customer experiences and operational efficiency to boost market
             10.3.7 ITALY
                       10.3.7.1 Indoor location technologies to improve customer experience and boost sales in retail sector
             10.3.8 NORDICS
                       10.3.8.1 Growing use of smartphones and supportive government policies to fuel market
             10.3.9 REST OF EUROPE
     10.4 ASIA PACIFIC 
             10.4.1 ASIA PACIFIC: INDOOR LOCATION MARKET DRIVERS
             10.4.2 ASIA PACIFIC: RECESSION IMPACT
             10.4.3 CHINA
                       10.4.3.1 Government initiatives for R&D and investments by global players to propel market
             10.4.4 JAPAN
                       10.4.4.1 Need to compete with global companies and increased R&D investments to drive market
             10.4.5 INDIA
                       10.4.5.1 Availability of cheap labor, infrastructural development, and government support to harness opportunities
             10.4.6 ANZ
                       10.4.6.1 Increasing adoption of indoor location technologies in various industries to drive market
             10.4.7 SOUTHEAST ASIA
                       10.4.7.1 Need to improve customer experience, increase efficiency, and reduce costs to drive market
             10.4.8 REST OF ASIA PACIFIC
     10.5 MIDDLE EAST & AFRICA 
             10.5.1 MIDDLE EAST & AFRICA: INDOOR LOCATION MARKET DRIVERS
             10.5.2 MIDDLE EAST & AFRICA: RECESSION IMPACT
             10.5.3 KSA
                       10.5.3.1 Investment in Future Investment Initiatives facilitating technological growth to fuel market
             10.5.4 UAE
                       10.5.4.1 Focus of government on adopting latest technologies to drive demand for indoor location solutions
             10.5.5 ISRAEL
                       10.5.5.1 Focus of government on delivering location-based services and technologies within indoor settings to drive market
             10.5.6 SOUTH AFRICA
                       10.5.6.1 Increasing number of mobile subscribers and smartphone users to boost demand for indoor location solutions
             10.5.7 REST OF MIDDLE EAST & AFRICA
     10.6 LATIN AMERICA 
             10.6.1 LATIN AMERICA: INDOOR LOCATION MARKET DRIVERS
             10.6.2 LATIN AMERICA: RECESSION IMPACT
             10.6.3 BRAZIL
                       10.6.3.1 Need to develop indoor location solutions to enable asset and people management to drive market
             10.6.4 MEXICO
                       10.6.4.1 Rising need to provide location-based information to drive demand for indoor locations solutions
             10.6.5 REST OF LATIN AMERICA
 
11 COMPETITIVE LANDSCAPE (Page No. - 193)
     11.1 OVERVIEW 
     11.2 STRATEGIES ADOPTED BY KEY PLAYERS 
     11.3 MARKET SHARE ANALYSIS OF KEY PLAYERS 
     11.4 HISTORICAL REVENUE ANALYSIS 
     11.5 MARKET RANKING OF KEY PLAYERS, 2023 
     11.6 COMPANY EVALUATION QUADRANT FOR KEY PLAYERS 
             11.6.1 STARS
             11.6.2 EMERGING LEADERS
             11.6.3 PERVASIVE PLAYERS
             11.6.4 PARTICIPANTS
     11.7 EVALUATION QUADRANT FOR STARTUPS/SMES 
             11.7.1 PROGRESSIVE COMPANIES
             11.7.2 RESPONSIVE COMPANIES
             11.7.3 DYNAMIC COMPANIES
             11.7.4 STARTING BLOCKS
     11.8 COMPETITIVE BENCHMARKING 
     11.9 COMPETITIVE SCENARIO 
             11.9.1 PRODUCT LAUNCHES
             11.9.2 DEALS
 
12 COMPANY PROFILES (Page No. - 207)
     12.1 MAJOR PLAYERS 
             12.1.1 ZEBRA TECHNOLOGIES
                       12.1.1.1 Business overview
                       12.1.1.2 Products/Solutions/Services offered
                       12.1.1.3 Recent developments
                       12.1.1.4 MNM view
                                   12.1.1.4.1 Right to win
                                   12.1.1.4.2 Strategic choices
                                   12.1.1.4.3 Weaknesses and competitive threats
             12.1.2 CISCO
                       12.1.2.1 Business overview
                       12.1.2.2 Products/Solutions/Services offered
                       12.1.2.3 Recent developments
                       12.1.2.4 MNM view
                                   12.1.2.4.1 Right to win
                                   12.1.2.4.2 Strategic choices
                                   12.1.2.4.3 Weaknesses and competitive threats
             12.1.3 GOOGLE
                       12.1.3.1 Business overview
                       12.1.3.2 Products/Solutions/Services offered
                       12.1.3.3 Recent developments
                       12.1.3.4 MNM view
                                   12.1.3.4.1 Right to win
                                   12.1.3.4.2 Strategic choices
                                   12.1.3.4.3 Weaknesses and competitive threats
             12.1.4 MICROSOFT
                       12.1.4.1 Business overview
                       12.1.4.2 Products/Solutions/Services offered
                       12.1.4.3 Recent developments
                       12.1.4.4 MNM view
                                   12.1.4.4.1 Right to win
                                   12.1.4.4.2 Strategic choices
                                   12.1.4.4.3 Weaknesses and competitive threats
             12.1.5 HPE
                       12.1.5.1 Business overview
                       12.1.5.2 Products/Solutions/Services offered
                       12.1.5.3 Recent developments
                       12.1.5.4 MNM view
                                   12.1.5.4.1 Right to win
                                   12.1.5.4.2 Strategic choices
                                   12.1.5.4.3 Weaknesses and competitive threats
             12.1.6 APPLE
                       12.1.6.1 Business overview
                       12.1.6.2 Products/Solutions/Services Offered
                       12.1.6.3 Recent developments
             12.1.7 ESRI
                       12.1.7.1 Business overview
                       12.1.7.2 Products/Solutions/Services offered
                       12.1.7.3 Recent developments
             12.1.8 ACUITY BRANDS
                       12.1.8.1 Business overview
                       12.1.8.2 Products/Solutions/Services offered
                       12.1.8.3 Recent developments
             12.1.9 INPIXON
                       12.1.9.1 Business overview
                       12.1.9.2 Products/Solutions/Services offered
                       12.1.9.3 Recent developments
               12.1.10 HERE TECHNOLOGIES
            12.1.10.1 Business overview
            12.1.10.2 Products/Solutions/Services offered
            12.1.10.3 Recent developments
     12.2 OTHER PLAYERS 
             12.2.1 HID GLOBAL
             12.2.2 CENTRAK
             12.2.3 SONITOR TECHNOLOGIES
             12.2.4 UBISENSE
             12.2.5 INFSOFT
             12.2.6 POLARIS WIRELESS
             12.2.7 QUUPPA
             12.2.8 SECURITAS HEALTHCARE
             12.2.9 NAVIGINE
     12.3 SMES/STARTUPS 
             12.3.1 BLUEIOT
             12.3.2 KONTAKT.IO
             12.3.3 AIRISTA
             12.3.4 INNERSPACE
             12.3.5 SYOOK
             12.3.6 ORIIENT
             12.3.7 NAVENIO
             12.3.8 SITUM
             12.3.9 POZYX
               12.3.10 AZITEK
               12.3.11 MAPXUS
 
13 ADJACENT AND RELATED MARKETS (Page No. - 257)
     13.1 INTRODUCTION 
             13.1.1 LIMITATIONS
     13.2 LOCATION ANALYTICS MARKET 
             13.2.1 MARKET DEFINITION
             13.2.2 MARKET OVERVIEW
                       13.2.2.1 Location Analytics Market, By Component
                       13.2.2.2 Location Analytics Market, By Location Type
                       13.2.2.3 Location Analytics Market, By Deployment Mode
                       13.2.2.4 Location Analytics Market, By Organization Size
                       13.2.2.5 Location Analytics Market, By Application
                       13.2.2.6 Location Analytics Market, By Industry Vertical
                       13.2.2.7 Location Analytics Market, By Region
     13.3 LOCATION-BASED SERVICES (LBS) AND REAL-TIME LOCATION SYSTEMS (RTLS) MARKET 
             13.3.1 MARKET DEFINITION
             13.3.2 MARKET OVERVIEW
                       13.3.2.1 Location-based Services (LBS) and Real-time Location Systems (RTLS) Market, By Component
                       13.3.2.2 Location-based Services (LBS) and Real-time Location Systems (RTLS) Market, By Location Type
                       13.3.2.3 Location-based Services (LBS) and Real-time Location Systems (RTLS) Market, By Application
                       13.3.2.4 Location-based Services (LBS) and Real-time Location Systems (RTLS) Market, By Vertical
                       13.3.2.5 Location-based Services (LBS) and Real-time Location Systems (RTLS) Market, By Region
 
14 APPENDIX (Page No. - 269)
     14.1 DISCUSSION GUIDE 
     14.2 KNOWLEDGESTORE: MARKETSANDMARKETS’ SUBSCRIPTION PORTAL 
     14.3 CUSTOMIZATION OPTIONS 
     14.4 RELATED REPORTS 
     14.5 AUTHOR DETAILS 
 
 
LIST OF TABLES (289 Tables) 
 
TABLE 1 USD EXCHANGE RATES, 2019–2022
TABLE 2 FACTOR ANALYSIS
TABLE 3 INDOOR LOCATION MARKET: ECOSYSTEM
TABLE 4 IMPACT OF PORTER’S FIVE FORCES ON INDOOR LOCATION MARKET
TABLE 5 INFLUENCE OF STAKEHOLDERS ON BUYING PROCESS FOR TOP THREE APPLICATIONS (%)
TABLE 6 KEY BUYING CRITERIA FOR TOP THREE APPLICATIONS
TABLE 7 PATENTS FILED, 2020–2023
TABLE 8 INDOOR LOCATION MARKET: DETAILED LIST OF CONFERENCES & EVENTS, 2023–2024
TABLE 9 INDOOR LOCATION MARKET, BY OFFERING, 2017–2022 (USD MILLION)
TABLE 10 INDOOR LOCATION MARKET, BY OFFERING, 2023–2028 (USD MILLION)
TABLE 11 HARDWARE: INDOOR LOCATION MARKET, BY REGION, 2017–2022 (USD MILLION)
TABLE 12 HARDWARE: INDOOR LOCATION MARKET, BY REGION, 2023–2028 (USD MILLION)
TABLE 13 SOLUTIONS: INDOOR LOCATION MARKET, BY TYPE, 2017–2022 (USD MILLION)
TABLE 14 SOLUTIONS: INDOOR LOCATION MARKET, BY TYPE, 2023–2028 (USD MILLION)
TABLE 15 SOLUTIONS: INDOOR LOCATION MARKET, BY REGION, 2017–2022 (USD MILLION)
TABLE 16 SOLUTIONS: INDOOR LOCATION MARKET, BY REGION, 2023–2028 (USD MILLION)
TABLE 17 INDOOR TRACKING: INDOOR LOCATION MARKET, BY TYPE, 2017–2022 (USD MILLION)
TABLE 18 INDOOR TRACKING: INDOOR LOCATION MARKET, BY TYPE, 2023–2028 (USD MILLION)
TABLE 19 INDOOR TRACKING: INDOOR LOCATION MARKET, BY REGION, 2017–2022 (USD MILLION)
TABLE 20 INDOOR TRACKING: INDOOR LOCATION MARKET, BY REGION, 2023–2028 (USD MILLION)
TABLE 21 ASSET & PEOPLE TRACKING: INDOOR LOCATION MARKET, BY REGION, 2017–2022 (USD MILLION)
TABLE 22 ASSET & PEOPLE TRACKING: INDOOR LOCATION MARKET, BY REGION, 2023–2028 (USD MILLION)
TABLE 23 INDOOR LOCATION ANALYTICS: INDOOR LOCATION MARKET, BY REGION, 2017–2022 (USD MILLION)
TABLE 24 INDOOR LOCATION ANALYTICS: INDOOR LOCATION MARKET, BY REGION, 2023–2028 (USD MILLION)
TABLE 25 INDOOR NAVIGATION: INDOOR LOCATION MARKET, BY REGION, 2017–2022 (USD MILLION)
TABLE 26 INDOOR NAVIGATION: INDOOR LOCATION MARKET, BY REGION, 2023–2028 (USD MILLION)
TABLE 27 DATABASE MANAGEMENT SYSTEM: INDOOR LOCATION MARKET, BY REGION, 2017–2022 (USD MILLION)
TABLE 28 DATABASE MANAGEMENT SYSTEM: INDOOR LOCATION MARKET, BY REGION, 2023–2028 (USD MILLION)
TABLE 29 INDOOR LOCATION MARKET, BY SERVICE, 2017–2022 (USD MILLION)
TABLE 30 INDOOR LOCATION MARKET, BY SERVICE, 2023–2028 (USD MILLION)
TABLE 31 SERVICES: INDOOR LOCATION MARKET, BY REGION, 2017–2022 (USD MILLION)
TABLE 32 SERVICES: INDOOR LOCATION MARKET, BY REGION, 2023–2028 (USD MILLION)
TABLE 33 MANAGED SERVICES: INDOOR LOCATION MARKET, BY REGION, 2017–2022 (USD MILLION)
TABLE 34 MANAGED SERVICES: INDOOR LOCATION MARKET, BY REGION, 2023–2028 (USD MILLION)
TABLE 35 PROFESSIONAL SERVICES: INDOOR LOCATION MARKET, BY REGION, 2017–2022 (USD MILLION)
TABLE 36 PROFESSIONAL SERVICES: INDOOR LOCATION MARKET, BY REGION, 2023–2028 (USD MILLION)
TABLE 37 PROFESSIONAL SERVICES: INDOOR LOCATION MARKET, BY TYPE, 2017–2022 (USD MILLION)
TABLE 38 PROFESSIONAL SERVICES: INDOOR LOCATION MARKET, BY TYPE, 2023–2028 (USD MILLION)
TABLE 39 TRAINING & CONSULTING: INDOOR LOCATION MARKET, BY REGION, 2017–2022 (USD MILLION)
TABLE 40 TRAINING & CONSULTING: INDOOR LOCATION MARKET, BY REGION, 2023–2028 (USD MILLION)
TABLE 41 SUPPORT & MAINTENANCE: INDOOR LOCATION MARKET, BY REGION, 2017–2022 (USD MILLION)
TABLE 42 SUPPORT & MAINTENANCE: INDOOR LOCATION MARKET, BY REGION, 2023–2028 (USD MILLION)
TABLE 43 SYSTEM INTEGRATION & IMPLEMENTATION: INDOOR LOCATION MARKET, BY REGION, 2017–2022 (USD MILLION)
TABLE 44 SYSTEM INTEGRATION & IMPLEMENTATION: INDOOR LOCATION MARKET, BY REGION, 2023–2028 (USD MILLION)
TABLE 45 INDOOR LOCATION MARKET, BY TECHNOLOGY, 2017–2022 (USD MILLION)
TABLE 46 INDOOR LOCATION MARKET, BY TECHNOLOGY, 2023–2028 (USD MILLION)
TABLE 47 BLUETOOTH LOW ENERGY: INDOOR LOCATION MARKET, BY REGION, 2017–2022 (USD MILLION)
TABLE 48 BLUETOOTH LOW ENERGY: INDOOR LOCATION MARKET, BY REGION, 2023–2028 (USD MILLION)
TABLE 49 ULTRA-WIDEBAND TECHNOLOGY: INDOOR LOCATION MARKET, BY REGION, 2017–2022 (USD MILLION)
TABLE 50 ULTRA-WIDEBAND TECHNOLOGY: INDOOR LOCATION MARKET, BY REGION, 2023–2028 (USD MILLION)
TABLE 51 WI-FI: INDOOR LOCATION MARKET, BY REGION, 2017–2022 (USD MILLION)
TABLE 52 WI-FI: INDOOR LOCATION MARKET, BY REGION, 2023–2028 (USD MILLION)
TABLE 53 RADIO-FREQUENCY IDENTIFICATION: INDOOR LOCATION MARKET, BY REGION, 2017–2022 (USD MILLION)
TABLE 54 RADIO-FREQUENCY IDENTIFICATION: INDOOR LOCATION MARKET, BY REGION, 2023–2028 (USD MILLION)
TABLE 55 MAGNETIC POSITIONING: INDOOR LOCATION MARKET, BY REGION, 2017–2022 (USD MILLION)
TABLE 56 MAGNETIC POSITIONING: INDOOR LOCATION MARKET, BY REGION, 2023–2028 (USD MILLION)
TABLE 57 OTHER TECHNOLOGIES: INDOOR LOCATION MARKET, BY REGION, 2017–2022 (USD MILLION)
TABLE 58 OTHER TECHNOLOGIES: INDOOR LOCATION MARKET, BY REGION, 2023–2028 (USD MILLION)
TABLE 59 INDOOR LOCATION MARKET, BY APPLICATION, 2017–2022 (USD MILLION)
TABLE 60 INDOOR LOCATION MARKET, BY APPLICATION, 2023–2028 (USD MILLION)
TABLE 61 EMERGENCY RESPONSE MANAGEMENT: INDOOR LOCATION MARKET, BY REGION, 2017–2022 (USD MILLION)
TABLE 62 EMERGENCY RESPONSE MANAGEMENT: INDOOR LOCATION MARKET, BY REGION, 2023–2028 (USD MILLION)
TABLE 63 SALES & MARKETING OPTIMIZATION: INDOOR LOCATION MARKET, BY REGION, 2017–2022 (USD MILLION)
TABLE 64 SALES & MARKETING OPTIMIZATION: INDOOR LOCATION MARKET, BY REGION, 2023–2028 (USD MILLION)
TABLE 65 REMOTE MONITORING: INDOOR LOCATION MARKET, BY REGION, 2017–2022 (USD MILLION)
TABLE 66 REMOTE MONITORING: INDOOR LOCATION MARKET, BY REGION, 2023–2028 (USD MILLION)
TABLE 67 PREDICTIVE ASSET MAINTENANCE: INDOOR LOCATION MARKET, BY REGION, 2017–2022 (USD MILLION)
TABLE 68 PREDICTIVE ASSET MAINTENANCE: INDOOR LOCATION MARKET, BY REGION, 2023–2028 (USD MILLION)
TABLE 69 SUPPLY CHAIN MANAGEMENT: INDOOR LOCATION MARKET, BY REGION, 2017–2022 (USD MILLION)
TABLE 70 SUPPLY CHAIN MANAGEMENT: INDOOR LOCATION MARKET, BY REGION, 2023–2028 (USD MILLION)
TABLE 71 INVENTORY MANAGEMENT: INDOOR LOCATION MARKET, BY REGION, 2017–2022 (USD MILLION)
TABLE 72 INVENTORY MANAGEMENT: INDOOR LOCATION MARKET, BY REGION, 2023–2028 (USD MILLION)
TABLE 73 OTHER APPLICATIONS: INDOOR LOCATION MARKET, BY REGION, 2017–2022 (USD MILLION)
TABLE 74 OTHER APPLICATIONS: INDOOR LOCATION MARKET, BY REGION, 2023–2028 (USD MILLION)
TABLE 75 INDOOR LOCATION MARKET, BY VERTICAL, 2017–2022 (USD MILLION)
TABLE 76 INDOOR LOCATION MARKET, BY VERTICAL, 2023–2028 (USD MILLION)
TABLE 77 RETAIL: INDOOR LOCATION MARKET, BY REGION, 2017–2022 (USD MILLION)
TABLE 78 RETAIL: INDOOR LOCATION MARKET, BY REGION, 2023–2028 (USD MILLION)
TABLE 79 TRAVEL & HOSPITALITY: INDOOR LOCATION MARKET, BY REGION, 2017–2022 (USD MILLION)
TABLE 80 TRAVEL & HOSPITALITY: INDOOR LOCATION MARKET, BY REGION, 2023–2028 (USD MILLION)
TABLE 81 MEDIA & ENTERTAINMENT: INDOOR LOCATION MARKET, BY REGION, 2017–2022 (USD MILLION)
TABLE 82 MEDIA & ENTERTAINMENT: INDOOR LOCATION MARKET, BY REGION, 2023–2028 (USD MILLION)
TABLE 83 TRANSPORTATION & LOGISTICS: INDOOR LOCATION MARKET, BY REGION, 2017–2022 (USD MILLION)
TABLE 84 TRANSPORTATION & LOGISTICS: INDOOR LOCATION MARKET, BY REGION, 2023–2028 (USD MILLION)
TABLE 85 GOVERNMENT & PUBLIC SECTOR: INDOOR LOCATION MARKET, BY REGION, 2017–2022 (USD MILLION)
TABLE 86 GOVERNMENT & PUBLIC SECTOR: INDOOR LOCATION MARKET, BY REGION, 2023–2028 (USD MILLION)
TABLE 87 MANUFACTURING: INDOOR LOCATION MARKET, BY REGION, 2017–2022 (USD MILLION)
TABLE 88 MANUFACTURING: INDOOR LOCATION MARKET, BY REGION, 2023–2028 (USD MILLION)
TABLE 89 HEALTHCARE & PHARMACEUTICALS: INDOOR LOCATION MARKET, BY REGION, 2017–2022 (USD MILLION)
TABLE 90 HEALTHCARE & PHARMACEUTICALS: INDOOR LOCATION MARKET, BY REGION, 2023–2028 (USD MILLION)
TABLE 91 OTHER VERTICALS: INDOOR LOCATION MARKET, BY REGION, 2017–2022 (USD MILLION)
TABLE 92 OTHER VERTICALS: INDOOR LOCATION MARKET, BY REGION, 2023–2028 (USD MILLION)
TABLE 93 INDOOR LOCATION MARKET, BY REGION, 2017–2022 (USD MILLION)
TABLE 94 INDOOR LOCATION MARKET, BY REGION, 2023–2028 (USD MILLION)
TABLE 95 NORTH AMERICA: INDOOR LOCATION MARKET, BY OFFERING, 2017–2022 (USD MILLION)
TABLE 96 NORTH AMERICA: INDOOR LOCATION MARKET, BY OFFERING, 2023–2028 (USD MILLION)
TABLE 97 NORTH AMERICA: INDOOR LOCATION MARKET, BY SOLUTION, 2017–2022 (USD MILLION)
TABLE 98 NORTH AMERICA: INDOOR LOCATION MARKET, BY SOLUTION, 2023–2028 (USD MILLION)
TABLE 99 NORTH AMERICA: INDOOR LOCATION MARKET, BY INDOOR TRACKING, 2017–2022 (USD MILLION)
TABLE 100 NORTH AMERICA: INDOOR LOCATION MARKET, BY INDOOR TRACKING, 2023–2028 (USD MILLION)
TABLE 101 NORTH AMERICA: INDOOR LOCATION MARKET, BY SERVICE, 2017–2022 (USD MILLION)
TABLE 102 NORTH AMERICA: INDOOR LOCATION MARKET, BY SERVICE, 2023–2028 (USD MILLION)
TABLE 103 NORTH AMERICA: INDOOR LOCATION MARKET, BY PROFESSIONAL SERVICE, 2017–2022 (USD MILLION)
TABLE 104 NORTH AMERICA: INDOOR LOCATION MARKET, BY PROFESSIONAL SERVICE, 2023–2028 (USD MILLION)
TABLE 105 NORTH AMERICA: INDOOR LOCATION MARKET, BY TECHNOLOGY, 2017–2022 (USD MILLION)
TABLE 106 NORTH AMERICA: INDOOR LOCATION MARKET, BY TECHNOLOGY, 2023–2028 (USD MILLION)
TABLE 107 NORTH AMERICA: INDOOR LOCATION MARKET, BY APPLICATION, 2017–2022 (USD MILLION)
TABLE 108 NORTH AMERICA: INDOOR LOCATION MARKET, BY APPLICATION, 2023–2028 (USD MILLION)
TABLE 109 NORTH AMERICA: INDOOR LOCATION MARKET, BY VERTICAL, 2017–2022 (USD MILLION)
TABLE 110 NORTH AMERICA: INDOOR LOCATION MARKET, BY VERTICAL, 2023–2028 (USD MILLION)
TABLE 111 NORTH AMERICA: INDOOR LOCATION MARKET, BY COUNTRY, 2017–2022 (USD MILLION)
TABLE 112 NORTH AMERICA: INDOOR LOCATION MARKET, BY COUNTRY, 2023–2028 (USD MILLION)
TABLE 113 US: INDOOR LOCATION MARKET, BY OFFERING, 2017–2022 (USD MILLION)
TABLE 114 US: INDOOR LOCATION MARKET, BY OFFERING, 2023–2028 (USD MILLION)
TABLE 115 CANADA: INDOOR LOCATION MARKET, BY OFFERING, 2017–2022 (USD MILLION)
TABLE 116 CANADA: INDOOR LOCATION MARKET, BY OFFERING, 2023–2028 (USD MILLION)
TABLE 117 EUROPE: INDOOR LOCATION MARKET, BY OFFERING, 2017–2022 (USD MILLION)
TABLE 118 EUROPE: INDOOR LOCATION MARKET, BY OFFERING, 2023–2028 (USD MILLION)
TABLE 119 EUROPE: INDOOR LOCATION MARKET, BY SOLUTION, 2017–2022 (USD MILLION)
TABLE 120 EUROPE: INDOOR LOCATION MARKET, BY SOLUTION, 2023–2028 (USD MILLION)
TABLE 121 EUROPE: INDOOR LOCATION MARKET, BY INDOOR TRACKING, 2017–2022 (USD MILLION)
TABLE 122 EUROPE: INDOOR LOCATION MARKET, BY INDOOR TRACKING, 2023–2028 (USD MILLION)
TABLE 123 EUROPE: INDOOR LOCATION MARKET, BY SERVICE, 2017–2022 (USD MILLION)
TABLE 124 EUROPE: INDOOR LOCATION MARKET, BY SERVICE, 2023–2028 (USD MILLION)
TABLE 125 EUROPE: INDOOR LOCATION MARKET, BY PROFESSIONAL SERVICE, 2017–2022 (USD MILLION)
TABLE 126 EUROPE: INDOOR LOCATION MARKET, BY PROFESSIONAL SERVICE, 2023–2028 (USD MILLION)
TABLE 127 EUROPE: INDOOR LOCATION MARKET, BY TECHNOLOGY, 2017–2022 (USD MILLION)
TABLE 128 EUROPE: INDOOR LOCATION MARKET, BY TECHNOLOGY, 2023–2028 (USD MILLION)
TABLE 129 EUROPE: INDOOR LOCATION MARKET, BY APPLICATION, 2017–2022 (USD MILLION)
TABLE 130 EUROPE: INDOOR LOCATION MARKET, BY APPLICATION, 2023–2028 (USD MILLION)
TABLE 131 EUROPE: INDOOR LOCATION MARKET, BY VERTICAL, 2017–2022 (USD MILLION)
TABLE 132 EUROPE: INDOOR LOCATION MARKET, BY VERTICAL, 2023–2028 (USD MILLION)
TABLE 133 EUROPE: INDOOR LOCATION MARKET, BY COUNTRY, 2017–2022 (USD MILLION)
TABLE 134 EUROPE: INDOOR LOCATION MARKET, BY COUNTRY, 2023–2028 (USD MILLION)
TABLE 135 UK: INDOOR LOCATION MARKET, BY OFFERING, 2017–2022 (USD MILLION)
TABLE 136 UK: INDOOR LOCATION MARKET, BY OFFERING, 2023–2028 (USD MILLION)
TABLE 137 GERMANY: INDOOR LOCATION MARKET, BY OFFERING, 2017–2022 (USD MILLION)
TABLE 138 GERMANY: INDOOR LOCATION MARKET, BY OFFERING, 2023–2028 (USD MILLION)
TABLE 139 FRANCE: INDOOR LOCATION MARKET, BY OFFERING, 2017–2022 (USD MILLION)
TABLE 140 FRANCE: INDOOR LOCATION MARKET, BY OFFERING, 2023–2028 (USD MILLION)
TABLE 141 ASIA PACIFIC: INDOOR LOCATION MARKET, BY OFFERING, 2017–2022 (USD MILLION)
TABLE 142 ASIA PACIFIC: INDOOR LOCATION MARKET, BY OFFERING, 2023–2028 (USD MILLION)
TABLE 143 ASIA PACIFIC: INDOOR LOCATION MARKET, BY SOLUTION, 2017–2022 (USD MILLION)
TABLE 144 ASIA PACIFIC: INDOOR LOCATION MARKET, BY SOLUTION, 2023–2028 (USD MILLION)
TABLE 145 ASIA PACIFIC: INDOOR LOCATION MARKET, BY INDOOR TRACKING, 2017–2022 (USD MILLION)
TABLE 146 ASIA PACIFIC: INDOOR LOCATION MARKET, BY INDOOR TRACKING, 2023–2028 (USD MILLION)
TABLE 147 ASIA PACIFIC: INDOOR LOCATION MARKET, BY SERVICE, 2017–2022 (USD MILLION)
TABLE 148 ASIA PACIFIC: INDOOR LOCATION MARKET, BY SERVICE, 2023–2028 (USD MILLION)
TABLE 149 ASIA PACIFIC: INDOOR LOCATION MARKET, BY PROFESSIONAL SERVICE, 2017–2022 (USD MILLION)
TABLE 150 ASIA PACIFIC: INDOOR LOCATION MARKET, BY PROFESSIONAL SERVICE, 2023–2028 (USD MILLION)
TABLE 151 ASIA PACIFIC: INDOOR LOCATION MARKET, BY TECHNOLOGY, 2017–2022 (USD MILLION)
TABLE 152 ASIA PACIFIC: INDOOR LOCATION MARKET, BY TECHNOLOGY, 2023–2028 (USD MILLION)
TABLE 153 ASIA PACIFIC: INDOOR LOCATION MARKET, BY APPLICATION, 2017–2022 (USD MILLION)
TABLE 154 ASIA PACIFIC: INDOOR LOCATION MARKET, BY APPLICATION, 2023–2028 (USD MILLION)
TABLE 155 ASIA PACIFIC: INDOOR LOCATION MARKET, BY VERTICAL, 2017–2022 (USD MILLION)
TABLE 156 ASIA PACIFIC: INDOOR LOCATION MARKET, BY VERTICAL, 2023–2028 (USD MILLION)
TABLE 157 ASIA PACIFIC: INDOOR LOCATION MARKET, BY COUNTRY, 2017–2022 (USD MILLION)
TABLE 158 ASIA PACIFIC: INDOOR LOCATION MARKET, BY COUNTRY, 2023–2028 (USD MILLION)
TABLE 159 CHINA: INDOOR LOCATION MARKET, BY OFFERING, 2017–2022 (USD MILLION)
TABLE 160 CHINA: INDOOR LOCATION MARKET, BY OFFERING, 2023–2028 (USD MILLION)
TABLE 161 JAPAN: INDOOR LOCATION MARKET, BY OFFERING, 2017–2022 (USD MILLION)
TABLE 162 JAPAN: INDOOR LOCATION MARKET, BY OFFERING, 2023–2028 (USD MILLION)
TABLE 163 INDIA: INDOOR LOCATION MARKET, BY OFFERING, 2017–2022 (USD MILLION)
TABLE 164 INDIA: INDOOR LOCATION MARKET, BY OFFERING, 2023–2028 (USD MILLION)
TABLE 165 REST OF ASIA PACIFIC: INDOOR LOCATION MARKET, BY OFFERING, 2017–2022 (USD MILLION)
TABLE 166 REST OF ASIA PACIFIC: INDOOR LOCATION MARKET, BY OFFERING, 2023–2028 (USD MILLION)
TABLE 167 MIDDLE EAST & AFRICA: INDOOR LOCATION MARKET, BY OFFERING, 2017–2022 (USD MILLION)
TABLE 168 MIDDLE EAST & AFRICA: INDOOR LOCATION MARKET, BY OFFERING, 2023–2028 (USD MILLION)
TABLE 169 MIDDLE EAST & AFRICA: INDOOR LOCATION MARKET, BY SOLUTION, 2017–2022 (USD MILLION)
TABLE 170 MIDDLE EAST & AFRICA: INDOOR LOCATION MARKET, BY SOLUTION, 2023–2028 (USD MILLION)
TABLE 171 MIDDLE EAST & AFRICA: INDOOR LOCATION MARKET, BY INDOOR TRACKING, 2017–2022 (USD MILLION)
TABLE 172 MIDDLE EAST & AFRICA: INDOOR LOCATION MARKET, BY INDOOR TRACKING, 2023–2028 (USD MILLION)
TABLE 173 MIDDLE EAST & AFRICA: INDOOR LOCATION MARKET, BY SERVICE, 2017–2022 (USD MILLION)
TABLE 174 MIDDLE EAST & AFRICA: INDOOR LOCATION MARKET, BY SERVICE, 2023–2028 (USD MILLION)
TABLE 175 MIDDLE EAST & AFRICA: INDOOR LOCATION MARKET, BY PROFESSIONAL SERVICE, 2017–2022 (USD MILLION)
TABLE 176 MIDDLE EAST & AFRICA: INDOOR LOCATION MARKET, BY PROFESSIONAL SERVICE, 2023–2028 (USD MILLION)
TABLE 177 MIDDLE EAST & AFRICA: INDOOR LOCATION MARKET, BY TECHNOLOGY, 2017–2022 (USD MILLION)
TABLE 178 MIDDLE EAST & AFRICA: INDOOR LOCATION MARKET, BY TECHNOLOGY, 2023–2028 (USD MILLION)
TABLE 179 MIDDLE EAST & AFRICA: INDOOR LOCATION MARKET, BY APPLICATION, 2017–2022 (USD MILLION)
TABLE 180 MIDDLE EAST & AFRICA: INDOOR LOCATION MARKET, BY APPLICATION, 2023–2028 (USD MILLION)
TABLE 181 MIDDLE EAST & AFRICA: INDOOR LOCATION MARKET, BY VERTICAL, 2017–2022 (USD MILLION)
TABLE 182 MIDDLE EAST & AFRICA: INDOOR LOCATION MARKET, BY VERTICAL, 2023–2028 (USD MILLION)
TABLE 183 MIDDLE EAST & AFRICA: INDOOR LOCATION MARKET, BY COUNTRY, 2017–2022 (USD MILLION)
TABLE 184 MIDDLE EAST & AFRICA: INDOOR LOCATION MARKET, BY COUNTRY, 2023–2028 (USD MILLION)
TABLE 185 KSA: INDOOR LOCATION MARKET, BY OFFERING, 2017–2022 (USD MILLION)
TABLE 186 KSA: INDOOR LOCATION MARKET, BY OFFERING, 2023–2028 (USD MILLION)
TABLE 187 UAE: INDOOR LOCATION MARKET, BY OFFERING, 2017–2022 (USD MILLION)
TABLE 188 UAE: INDOOR LOCATION MARKET, BY OFFERING, 2023–2028 (USD MILLION)
TABLE 189 SOUTH AFRICA: INDOOR LOCATION MARKET, BY OFFERING, 2017–2022 (USD MILLION)
TABLE 190 SOUTH AFRICA: INDOOR LOCATION MARKET, BY OFFERING, 2023–2028 (USD MILLION)
TABLE 191 REST OF MIDDLE EAST & AFRICA: INDOOR LOCATION MARKET, BY OFFERING, 2017–2022 (USD MILLION)
TABLE 192 REST OF MIDDLE EAST & AFRICA: INDOOR LOCATION MARKET, BY OFFERING, 2023–2028 (USD MILLION)
TABLE 193 LATIN AMERICA: INDOOR LOCATION MARKET, BY OFFERING, 2017–2022 (USD MILLION)
TABLE 194 LATIN AMERICA: INDOOR LOCATION MARKET, BY OFFERING, 2023–2028 (USD MILLION)
TABLE 195 LATIN AMERICA: INDOOR LOCATION MARKET, BY SOLUTION, 2017–2022 (USD MILLION)
TABLE 196 LATIN AMERICA: INDOOR LOCATION MARKET, BY SOLUTION, 2023–2028 (USD MILLION)
TABLE 197 LATIN AMERICA: INDOOR LOCATION MARKET, BY INDOOR TRACKING, 2017–2022 (USD MILLION)
TABLE 198 LATIN AMERICA: INDOOR LOCATION MARKET, BY INDOOR TRACKING, 2023–2028 (USD MILLION)
TABLE 199 LATIN AMERICA: INDOOR LOCATION MARKET, BY SERVICE, 2017–2022 (USD MILLION)
TABLE 200 LATIN AMERICA: INDOOR LOCATION MARKET, BY SERVICE, 2023–2028 (USD MILLION)
TABLE 201 LATIN AMERICA: INDOOR LOCATION MARKET, BY PROFESSIONAL SERVICE, 2017–2022 (USD MILLION)
TABLE 202 LATIN AMERICA: INDOOR LOCATION MARKET, BY PROFESSIONAL SERVICE, 2023–2028 (USD MILLION)
TABLE 203 LATIN AMERICA: INDOOR LOCATION MARKET, BY TECHNOLOGY, 2017–2022 (USD MILLION)
TABLE 204 LATIN AMERICA: INDOOR LOCATION MARKET, BY TECHNOLOGY, 2023–2028 (USD MILLION)
TABLE 205 LATIN AMERICA: INDOOR LOCATION MARKET, BY APPLICATION, 2017–2022 (USD MILLION)
TABLE 206 LATIN AMERICA: INDOOR LOCATION MARKET, BY APPLICATION, 2023–2028 (USD MILLION)
TABLE 207 LATIN AMERICA: INDOOR LOCATION MARKET, BY VERTICAL, 2017–2022 (USD MILLION)
TABLE 208 LATIN AMERICA: INDOOR LOCATION MARKET, BY VERTICAL, 2023–2028 (USD MILLION)
TABLE 209 LATIN AMERICA: INDOOR LOCATION MARKET, BY COUNTRY, 2017–2022 (USD MILLION)
TABLE 210 LATIN AMERICA: INDOOR LOCATION MARKET, BY COUNTRY, 2023–2028 (USD MILLION)
TABLE 211 BRAZIL: INDOOR LOCATION MARKET, BY OFFERING, 2017–2022 (USD MILLION)
TABLE 212 BRAZIL: INDOOR LOCATION MARKET, BY OFFERING, 2023–2028 (USD MILLION)
TABLE 213 MEXICO: INDOOR LOCATION MARKET, BY OFFERING, 2017–2022 (USD MILLION)
TABLE 214 MEXICO: INDOOR LOCATION MARKET, BY OFFERING, 2023–2028 (USD MILLION)
TABLE 215 REST OF LATIN AMERICA: INDOOR LOCATION MARKET, BY OFFERING, 2017–2022 (USD MILLION)
TABLE 216 REST OF LATIN AMERICA: INDOOR LOCATION MARKET, BY OFFERING, 2023–2028 (USD MILLION)
TABLE 217 OVERVIEW OF STRATEGIES ADOPTED BY KEY PLAYERS IN INDOOR LOCATION MARKET
TABLE 218 INDOOR LOCATION MARKET: DEGREE OF COMPETITION
TABLE 219 INDOOR LOCATION MARKET: DETAILED LIST OF KEY STARTUPS/SMES
TABLE 220 INDOOR LOCATION MARKET: COMPETITIVE BENCHMARKING OF KEY STARTUPS/SMES
TABLE 221 INDOOR LOCATION MARKET: COMPETITIVE BENCHMARKING OF MAJOR PLAYERS
TABLE 222 PRODUCT LAUNCHES, JANUARY 2020–MARCH 2023
TABLE 223 DEALS, JANUARY 2020–MARCH 2023
TABLE 224 ZEBRA TECHNOLOGIES: BUSINESS OVERVIEW
TABLE 225 ZEBRA TECHNOLOGIES: PRODUCTS/SOLUTIONS/SERVICES OFFERED
TABLE 226 ZEBRA TECHNOLOGIES: PRODUCT LAUNCHES
TABLE 227 ZEBRA TECHNOLOGIES: DEALS
TABLE 228 CISCO: BUSINESS OVERVIEW
TABLE 229 CISCO: PRODUCTS/SOLUTIONS/SERVICES OFFERED
TABLE 230 CISCO: PRODUCT LAUNCHES
TABLE 231 CISCO: DEALS
TABLE 232 GOOGLE: BUSINESS OVERVIEW
TABLE 233 GOOGLE: PRODUCTS/SOLUTIONS/SERVICES OFFERED
TABLE 234 GOOGLE: PRODUCT LAUNCHES
TABLE 235 GOOGLE: DEALS
TABLE 236 MICROSOFT: BUSINESS OVERVIEW
TABLE 237 MICROSOFT: PRODUCTS/SOLUTIONS/SERVICES OFFERED
TABLE 238 MICROSOFT: DEALS
TABLE 239 MICROSOFT: OTHERS
TABLE 240 HPE: BUSINESS OVERVIEW
TABLE 241 HPE: PRODUCTS/SOLUTIONS/SERVICES OFFERED
TABLE 242 HPE: PRODUCT LAUNCHES
TABLE 243 HPE: DEALS
TABLE 244 APPLE: BUSINESS OVERVIEW
TABLE 245 APPLE: PRODUCTS/SOLUTIONS/SERVICES OFFERED
TABLE 246 APPLE: PRODUCT LAUNCHES
TABLE 247 APPLE: DEALS
TABLE 248 APPLE: OTHERS
TABLE 249 ESRI: BUSINESS OVERVIEW
TABLE 250 ESRI: PRODUCTS/SOLUTIONS/SERVICES OFFERED
TABLE 251 ESRI: PRODUCT LAUNCHES
TABLE 252 ESRI: DEALS
TABLE 253 ESRI: OTHERS
TABLE 254 ACUITY BRANDS: BUSINESS OVERVIEW
TABLE 255 ACUITY BRANDS: PRODUCTS/SOLUTIONS/SERVICES OFFERED
TABLE 256 ACUITY BRANDS: PRODUCT LAUNCHES
TABLE 257 ACUITY BRANDS: DEALS
TABLE 258 INPIXON: BUSINESS OVERVIEW
TABLE 259 INPIXON: PRODUCTS/SOLUTIONS/SERVICES OFFERED
TABLE 260 INPIXON: PRODUCT LAUNCHES
TABLE 261 INPIXON: DEALS
TABLE 262 HERE TECHNOLOGIES: BUSINESS OVERVIEW
TABLE 263 HERE TECHNOLOGIES: PRODUCTS/SOLUTIONS/SERVICES OFFERED
TABLE 264 HERE TECHNOLOGIES: PRODUCT LAUNCHES
TABLE 265 HERE TECHNOLOGIES: DEALS
TABLE 266 LOCATION ANALYTICS MARKET, BY COMPONENT, 2016–2021 (USD MILLION)
TABLE 267 LOCATION ANALYTICS MARKET, BY COMPONENT, 2022–2027 (USD MILLION)
TABLE 268 LOCATION ANALYTICS MARKET, BY LOCATION TYPE, 2016–2021 (USD MILLION)
TABLE 269 LOCATION ANALYTICS MARKET, BY LOCATION TYPE, 2022–2027 (USD MILLION)
TABLE 270 LOCATION ANALYTICS MARKET, BY DEPLOYMENT MODE, 2016–2021 (USD MILLION)
TABLE 271 LOCATION ANALYTICS MARKET, BY DEPLOYMENT MODE, 2022–2027 (USD MILLION)
TABLE 272 LOCATION ANALYTICS MARKET, BY ORGANIZATION SIZE, 2016–2021 (USD MILLION)
TABLE 273 LOCATION ANALYTICS MARKET, BY ORGANIZATION SIZE, 2022–2027 (USD MILLION)
TABLE 274 LOCATION ANALYTICS MARKET, BY APPLICATION, 2016–2021 (USD MILLION)
TABLE 275 LOCATION ANALYTICS MARKET, BY APPLICATION, 2022–2027 (USD MILLION)
TABLE 276 LOCATION ANALYTICS MARKET, BY INDUSTRY VERTICAL, 2016–2021 (USD MILLION)
TABLE 277 LOCATION ANALYTICS MARKET, BY INDUSTRY VERTICAL, 2022–2027 (USD MILLION)
TABLE 278 LOCATION ANALYTICS MARKET, BY REGION, 2016–2021 (USD MILLION)
TABLE 279 LOCATION ANALYTICS MARKET, BY REGION, 2022–2027 (USD MILLION)
TABLE 280 LBS AND RTLS MARKET, BY COMPONENT, 2016–2021 (USD MILLION)
TABLE 281 LBS AND RTLS MARKET, BY COMPONENT, 2022–2027 (USD MILLION)
TABLE 282 LBS AND RTLS MARKET, BY LOCATION TYPE, 2016–2021 (USD MILLION)
TABLE 283 LBS AND RTLS MARKET, BY LOCATION TYPE, 2022–2027 (USD MILLION)
TABLE 284 LBS AND RTLS MARKET, BY APPLICATION, 2016–2021 (USD MILLION)
TABLE 285 LBS AND RTLS MARKET, BY APPLICATION, 2022–2027 (USD MILLION)
TABLE 286 LBS AND RTLS MARKET, BY VERTICAL, 2016–2021 (USD MILLION)
TABLE 287 LBS AND RTLS MARKET, BY VERTICAL, 2022–2027 (USD MILLION)
TABLE 288 LBS AND RTLS MARKET, BY REGION, 2016–2021 (USD MILLION)
TABLE 289 LBS AND RTLS MARKET, BY REGION, 2022–2027 (USD MILLION)
 
  
LIST OF FIGURES (50 Figures) 
 
FIGURE 1 INDOOR LOCATION MARKET: RESEARCH DESIGN
FIGURE 2 BREAKDOWN OF PRIMARY INTERVIEWS: BY COMPANY TYPE, DESIGNATION, AND REGION
FIGURE 3 DATA TRIANGULATION
FIGURE 4 INDOOR LOCATION MARKET: TOP-DOWN AND BOTTOM-UP APPROACHES
FIGURE 5 MARKET SIZE ESTIMATION METHODOLOGY - APPROACH 1 (SUPPLY-SIDE ANALYSIS): REVENUE FROM HARDWARE/SOLUTIONS/SERVICES IN INDOOR LOCATION MARKET
FIGURE 6 MARKET SIZE ESTIMATION METHODOLOGY- APPROACH 2, BOTTOM-UP (SUPPLY-SIDE ANALYSIS): COLLECTIVE REVENUE FROM ALL HARDWARE/SOLUTIONS/SERVICES IN INDOOR LOCATION MARKET
FIGURE 7 MARKET SIZE ESTIMATION METHODOLOGY-APPROACH 3, BOTTOM-UP (SUPPLY-SIDE ANALYSIS): COLLECTIVE REVENUE FROM ALL HARDWARE/SOLUTIONS /SERVICES IN INDOOR LOCATION MARKET
FIGURE 8 MARKET SIZE ESTIMATION METHODOLOGY-APPROACH 4, BOTTOM-UP (DEMAND-SIDE ANALYSIS): SHARE OF INDOOR LOCATION THROUGH OVERALL INDOOR LOCATION SPENDING
FIGURE 9 INDOOR LOCATION MARKET, 2021–2028
FIGURE 10 INDOOR LOCATION MARKET, REGIONAL SHARE, 2023
FIGURE 11 ASIA PACIFIC TO BE BEST MARKET FOR INVESTMENTS DURING FORECAST PERIOD
FIGURE 12 PROLIFERATION OF SMARTPHONES AND LOCATION-BASED APPS AND INEFFICIENCY OF GPS TECHNOLOGY TO DRIVE MARKET
FIGURE 13 HARDWARE SEGMENT AND SALES & MARKETING OPTIMIZATION APPLICATION TO ACCOUNT FOR LARGEST SHARES IN 2023
FIGURE 14 HARDWARE SEGMENT AND CHINA TO ACCOUNT FOR LARGEST SHARES IN 2023
FIGURE 15 DRIVERS, RESTRAINTS, OPPORTUNITIES, AND CHALLENGES:  INDOOR LOCATION MARKET
FIGURE 16 VALUE CHAIN ANALYSIS
FIGURE 17 BRIEF HISTORY OF INDOOR LOCATION SOLUTIONS
FIGURE 18 INDOOR LOCATION MARKET: ECOSYSTEM
FIGURE 19 FUNCTIONAL ELEMENTS OF INDOOR LOCATION SYSTEM
FIGURE 20 PORTER’S FIVE FORCES ANALYSIS OF INDOOR LOCATION MARKET
FIGURE 21 INFLUENCE OF STAKEHOLDERS ON BUYING PROCESS FOR TOP THREE APPLICATIONS
FIGURE 22 KEY BUYING CRITERIA FOR TOP THREE APPLICATIONS
FIGURE 23 INDOOR LOCATION MARKET: TRENDS/DISRUPTIONS IMPACTING CUSTOMER BUSINESS
FIGURE 24 TOTAL NUMBER OF PATENTS GRANTED, 2020–2023
FIGURE 25 TOP TEN PATENT APPLICANTS, 2020–2023
FIGURE 26 SERVICES SEGMENT TO GROW AT HIGHEST CAGR DURING FORECAST PERIOD
FIGURE 27 INDOOR NAVIGATION SEGMENT TO GROW AT HIGHEST CAGR DURING FORECAST PERIOD
FIGURE 28 INDOOR LOCATION ANALYTICS SEGMENT TO GROW AT HIGHER CAGR DURING FORECAST PERIOD
FIGURE 29 MANAGED SERVICES SEGMENT TO GROW AT HIGHER CAGR DURING FORECAST PERIOD
FIGURE 30 SUPPORT & MAINTENANCE SEGMENT TO GROW AT HIGHEST CAGR DURING FORECAST PERIOD
FIGURE 31 ULTRA-WIDEBAND SEGMENT TO GROW AT HIGHEST CAGR DURING FORECAST PERIOD
FIGURE 32 REMOTE MONITORING SEGMENT TO GROW AT HIGHEST CAGR DURING FORECAST PERIOD
FIGURE 33 TRANSPORTATION & LOGISTICS VERTICAL TO GROW AT HIGHEST CAGR DURING FORECAST PERIOD
FIGURE 34 ASIA PACIFIC TO REGISTER HIGHEST CAGR DURING FORECAST PERIOD
FIGURE 35 NORTH AMERICA: MARKET SNAPSHOT
FIGURE 36 ASIA PACIFIC: MARKET SNAPSHOT
FIGURE 37 HISTORICAL REVENUE ANALYSIS OF KEY PLAYERS, 2018–2022 (USD MILLION)
FIGURE 38 RANKING OF KEY PLAYERS IN INDOOR LOCATION MARKET, 2023
FIGURE 39 COMPANY EVALUATION MATRIX: CRITERIA WEIGHTAGE
FIGURE 40 INDOOR LOCATION MARKET: COMPANY EVALUATION MATRIX, 2023
FIGURE 41 STARTUPS/SMES EVALUATION MATRIX: CRITERIA WEIGHTAGE
FIGURE 42 INDOOR LOCATION MARKET: STARTUPS/SMES EVALUATION MATRIX, 2023
FIGURE 43 ZEBRA TECHNOLOGIES: COMPANY SNAPSHOT
FIGURE 44 CISCO: COMPANY SNAPSHOT
FIGURE 45 GOOGLE: COMPANY SNAPSHOT
FIGURE 46 MICROSOFT: COMPANY SNAPSHOT
FIGURE 47 HPE: COMPANY SNAPSHOT
FIGURE 48 APPLE: COMPANY SNAPSHOT
FIGURE 49 ACUITY BRANDS: COMPANY SNAPSHOT
FIGURE 50 INPIXON: COMPANY SNAPSHOT

The research study for the indoor location market involves extensive secondary sources, directories, and several journals, including the International Journal of Geo-Information, Journal of Location-Based Services, and the International Journal of Interactive Multimedia and Artificial Intelligence. Primary sources have been mainly industry experts from the core and related industries, preferred indoor location providers, third-party service providers, consulting service providers, end users, and other commercial enterprises. In-depth interviews have been conducted with various primary respondents, including key industry participants and subject matter experts, to obtain and verify critical qualitative and quantitative information, and assess growth prospects. These respondents included key industry participants, subject matter experts, C-level executives of key market players, and industry consultants.

Secondary Research

In the secondary research process, various secondary sources were referred to for identifying and collecting information for the study. The secondary sources included annual reports, press releases, investor presentations of companies, white papers, certified publications, and articles from recognized associations and government publishing sources. The data has also been collected from other secondary sources, such as journals like the Journal of Location-Based Services and related magazines. Indoor location spending of various countries has been extracted from the respective sources. Secondary research was mainly used to obtain key information about industry insights, the market’s monetary chain, the overall pool of key players, market classification, and segmentation according to industry trends to the bottom-most level, regional markets, and key developments.

Primary Research

In the primary research process, various primary sources from both supply and demand sides were interviewed to obtain qualitative and quantitative information for the report. The primary sources from the supply side included industry experts, such as Chief Executive Officers (CEOs), Chief Technology Officers (CTOs), Chief Operating Officers (COOs), Vice Presidents (VPs), marketing directors, technology and innovation directors, and related key executives from various key companies and organizations operating in the Indoor location market. The primary sources from the demand side included Indoor location end users, network administrators/consultants/specialists, Chief Information Officers (CIOs), and subject-matter experts from enterprises and government associations.

The break-up of Primary Research:

Indoor Location Market Size, and Share

To know about the assumptions considered for the study, download the pdf brochure

Market Size Estimation

Multiple approaches were adopted to estimate and forecast the Indoor location market. The first approach involves estimating the market size by summating companies’ revenue generated through Indoor location solutions. In this approach for market estimation, we identified the key companies offering Indoor location by offerings: hardware, solutions, and services.

Both top-down and bottom-up approaches were used to estimate and validate the total size of the Indoor location market. These methods were extensively used to estimate the size of various segments in the market. The research methodology used to estimate the market size includes the following:

  • Key players in the market have been identified through extensive secondary research.
  • In terms of value, the industry’s supply chain and market size have been determined through primary and secondary research processes.
  • All percentage shares, splits, and break-ups have been determined using secondary sources and verified through primary sources.

Indoor location Market Size: Bottom-Up Approach

Indoor Location Market Size, and Share

To know about the assumptions considered for the study, Request for Free Sample Report

Data Triangulation

After arriving at the overall market size, the indoor location market was divided into several segments and subsegments. The data triangulation procedures were used to complete the overall market engineering process and arrive at the exact statistics for all segments and subsegments. The data was triangulated by studying various factors and trends from the demand and supply sides. Along with data triangulation and market breakdown, the market size was validated by the top-down and bottom-up approaches.

Market Definition

Indoor location or indoor positioning technology facilitates the navigation and tracking of objects and people in a building using sensory information captured by mobile devices. It includes hardware, software, and service components to provide indoor location services to various organizations across verticals. Indoor location solutions may collect location data using Radio Frequency (RF), Visible Light Communication (VLC), Sound Navigation and Ranging (Sonar), Light Detection and Ranging (Lidar), or any technology or a combination of technologies.

Key Stakeholders

  • Indoor location solution providers
  • Independent Software Vendors (ISVs)
  • Investors and Venture Capitalists (VCs)
  • Support and maintenance service providers
  • Value-added Resellers (VARs) and distributors

Report Objectives

  • To determine and forecast the global Indoor location market by offering (hardware, solutions, and services), application, technology, vertical and region from 2023 to 2028, and analyze the various macroeconomic and microeconomic factors that affect the market growth.
  • To forecast the size of the market segments with respect to five main regions: North America, Europe, Asia Pacific (APAC), Latin America, and the Middle East and Africa (MEA).
  • To provide detailed information about the major factors (drivers, restraints, opportunities, and challenges) influencing the growth of the Indoor location market.
  • To analyze each submarket with respect to individual growth trends, prospects, and contributions to the overall Indoor location market.
  • To analyze the opportunities in the market for stakeholders by identifying the high-growth segments of the Indoor location market.
  • To profile the key market players; provide a comparative analysis on the basis of business overviews, regional presence, product offerings, business strategies, and key financials; and illustrate the competitive landscape of the market.
  • In the market, track and analyze competitive developments, such as mergers and acquisitions, product developments, partnerships and collaborations, and Research and Development (R&D) activities.

Available Customizations

With the given market data, MarketsandMarkets offers customizations as per the company’s specific needs. The following customization options are available for the report:

Geographic Analysis

  • Further breakup of the Asia Pacific market into countries contributing 75% to the regional market size
  • Further breakup of the North American market into countries contributing 75% to the regional market size
  • Further breakup of the Latin American market into countries contributing 75% to the regional market size
  • Further breakup of the MEA market into countries contributing 75% to the regional market size
  • Further breakup of the European market into countries contributing 75% to the regional market size

Company Information

  • Detailed analysis and profiling of additional market players (up to 5)
Custom Market Research Services

We will customize the research for you, in case the report listed above does not meet with your exact requirements. Our custom research will comprehensively cover the business information you require to help you arrive at strategic and profitable business decisions.

Request Customization

Instant Answers with GPT - Ask Now!

Ask real questions. Get complete answers !
Report Code
TC 2878
Published ON
Jun, 2023
Choose License Type
BUY NOW
  • SHARE
X
Request Customization
Speak to Analyst
Speak to Analyst
OR FACE-TO-FACE MEETING
PERSONALIZE THIS RESEARCH
  • Triangulate with your Own Data
  • Get Data as per your Format and Definition
  • Gain a Deeper Dive on a Specific Application, Geography, Customer or Competitor
  • Any level of Personalization
REQUEST A FREE CUSTOMIZATION
LET US HELP YOU!
  • What are the Known and Unknown Adjacencies Impacting the Indoor Location Market
  • What will your New Revenue Sources be?
  • Who will be your Top Customer; what will make them switch?
  • Defend your Market Share or Win Competitors
  • Get a Scorecard for Target Partners
CUSTOMIZED WORKSHOP REQUEST
  • Call Us
  • +1-888-600-6441 (Corporate office hours)
  • +1-888-600-6441 (US/Can toll free)
  • +44-800-368-9399 (UK office hours)
CONNECT WITH US
ABOUT TRUST ONLINE
©2024 MarketsandMarkets Research Private Ltd. All rights reserved
DMCA.com Protection Status Website Feedback