Packaging Foams Market by Structure Type (Flexible Foam, Rigid Foam), Material Type (Polystyrene Foam, Polyurethane Foam, Polyolefin Foam), Service Type (Food Service, Protective Packaging), and Region - Global Forecast to 2022


The packaging foams market is projected to reach USD 17.21 Billion by 2022, at a CAGR of 6.09%. This report aims to estimate the market size and future growth potential of the packaging foam market across different segments, such as structure type, material type, service type, and region. Factors influencing the market growth such as drivers, restraints, opportunities, and industry-specific challenges, along with competitive landscape of the market are presented in this report. In this study, 2016 has been considered as the base year and 2022 is considered as the projected year.
Top-down and bottom-up approaches have been used to estimate and validate the size of the packaging foams market, and to estimate the sizes of various other dependent submarkets. The research study involved the use of extensive secondary sources, directories, and databases such as Hoovers, Bloomberg, Chemical Weekly, Factiva, British Plastic Federation (BPF), Brazilian Packaging Associations (BPA), Japan Plastic Industry Federation (JPIF), Polyethylene Foam Insulation Association (PEFIA), Flexible Packaging Association, National Association of Container Distributors (NACD), Alliance of Foam Packaging Recyclers (AFPR) and other government as well as private company websites to identify and collect information useful for the technical, market-oriented, and commercial study of the packaging foam market. After arriving at the overall market size, the total market has been split into several segments and subsegments. The figure given below provides a breakdown of primary interviews conducted during the research study.
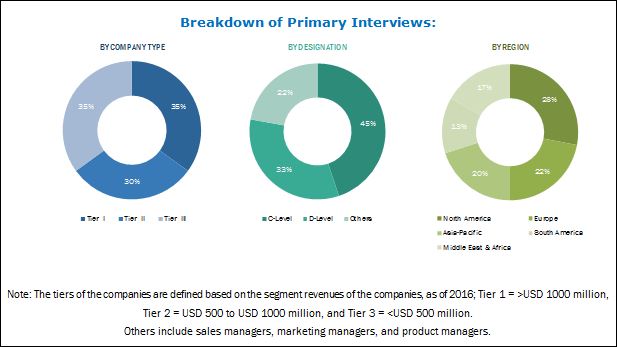
To know about the assumptions considered for the study, download the pdf brochure
The value chain of the packaging foams market starts with sourcing of basic raw materials. The basic raw materials used in the manufacturing of packaging foams are resin, polyols, naphtha, and additives, among others. These raw materials are produced by major manufacturers such as BASF (Germany), and Borealis Ag (Australia).
Key Target Audience in Packaging Foams Market
- Packaging Foams Manufacturers
- Raw Material Suppliers
- Traders, Distributors, and Suppliers of Packaging Foams
- Regional Manufacturers’ Associations and General Packaging Foams Associations
- Government & Regional Agencies and Research Organizations
- Investment Research Firms
Packaging Foams Market Report Scope
This research report categorizes the packaging foams market based on structure type, material type, service type, and region.
Based on Structure Type:
- Flexible Foam
- Rigid Foam
Based on Material Type:
- PS
- PU
- PO
- Others (PVDF and PVC)
Based on Service Type:
- Food Service
- Protective Packaging
Based on Region:
- North America
- Europe
- Asia-Pacific
- Middle East & Africa
- South America
The market is further analyzed for key countries in each of these regions.
Packaging Foams Market Report Available Customizations:
Along with the market data, MarketsandMarkets offers customizations according to the company’s specific needs. The following customization options are available for the report:
Packaging Foams Market Regional Analysis:
- Country-level analysis of varied types of packaging foams
Packaging Foams Market Company Information:
- Detailed analysis and profiling of additional market players
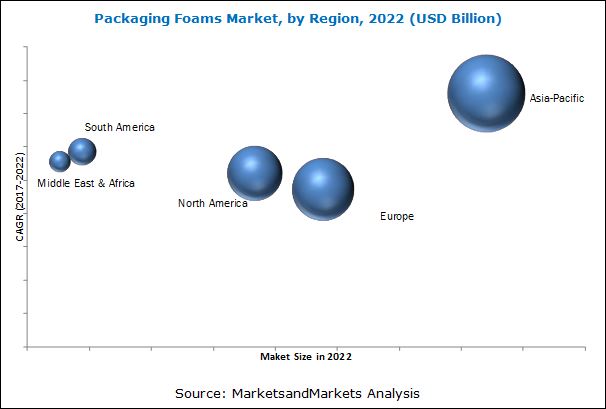
The packaging foams market is projected to reach USD 17.21 Billion by 2022, at a CAGR of 6.09% from 2017 to 2022. This growth is mainly driven by the increasing demand for packaging foams from food service and protective packaging service type. In addition, high demand for packaging foams from the Asia-Pacific region has contributed to the growth of this market. Packaging foams are based on material types such as PS, PU, PO, and others including PVDF and PVC.
In 2016, the PS material type accounted for the largest market share, in terms of volume and value, followed by PU and then PO packaging foams. PS is the most versatile type of polymer foam, which is a synthetic aromatic polymer made from the monomer styrene. EPS and XPS are the two types of PS packaging foams. EPS acts as an insulator, as heat cannot travel through easily. It is used in manufacturing flotation devices, insulation, egg cartons, sandwiches, hamburger boxes, and coffee mugs.
Based on structure type, the flexible segment of the packaging foam market is projected to grow at the highest CAGR between 2017 and 2022. Business that focus on protecting their products in the delivery process can go for flexible foam for their packaging needs. It is often used for extremely sensitive products such as computer parts, fruits, electronic parts, and jewelry.
The packaging foams market in Asia-Pacific is expected to grow at the highest CAGR between 2017 and 2022, in terms of value and volume. This growth is mainly attributed to high economic growth, followed by growing e-commerce business in the Asia-Pacific region.
One of the most significant factors restraining the growth of the packaging foams market includes volatility in raw material prices. This further causes fluctuations in the prices of packaging foams products.
Key Players in Packaging Foams Market Industry
Key players operating in the packaging foam market include Armacell (Germany), JSP (Japan), Zotefoams Plc. (U.K), BASF (Germany), Borealis Ag (Austria), and Sealed Air Corporation (U.S.), among others. Diverse product portfolio, strategically positioned R&D centers, continuous adoption of development strategies, and technological advancements are factors strengthening the market position of these companies. These companies have adopted various organic and inorganic growth strategies to enhance their current market share in the packaging foams market.
To speak to our analyst for a discussion on the above findings, click Speak to Analyst
 Exclusive indicates content/data unique to MarketsandMarkets and not available with any competitors.
Table of Contents
1 Introduction
1.1 Objectives of the Study
1.2 Market Definition
1.3 Scope of the Study
1.3.1 Markets Covered
1.3.2 Years Considered in the Report
1.4 Stake Holders
2 Research Methodology
2.1 Research Design
2.2 Breakdown of Primary Interviews
2.3 Key Industry Insights
2.4 Market Size Estimation: Top-Down Approach
2.5 Market Size Estimation: Bottom-Up Approach
2.6 Data Triangulation
3 Excecutive Summary
4 Premium Insights
4.1 Opportunities in Packaging Foams Market
4.2 Packaging Foam Market, By Material Type
4.3 Packaging Foams Market Attractiveness
4.4 Packaging Foam Market, Developing vs. Developed Countries
5 Market Overview
5.1 Introduction
5.2 Market Segmentation
5.3 Market Dynamics
5.3.1 Drivers
5.3.2 Restraints
5.3.3 Opportunities
5.3.4 Challenges
6 Industry Trends
6.1 Introduction
6.2 Value Chain Analysis
6.2.1 List of Manufacturer
6.2.2 List of Raw Material and Technology Suppliers
6.2.3 List of Customers
6.2.4 List of Distributors
6.3 Porter’s Five Forces Analysis
7 Packaging Foams Market, By Structures
7.1 Introduction
7.2 Market Size & Projection
7.2.1 Packaging Foams
7.2.1.1 Flexible Foam
7.2.1.2 Rigid Foam
8 Packaging Foam Market, By Material Type
8.1 Polystyrene Foam
8.2 Polyurethane Foam
8.3 Polyolefin Foam
8.3.1 Polyprypylene Foam
8.3.1.1 Expanded Polypropylene
8.3.2 Polyethylene Foam
8.4 Others (PVDF and PVC)
9 Packaging Foams Market, By Service Type
9.1 Packaging Foams By EPS
9.2 Food Service
9.2.1 Cups
9.2.2 Food Trays
9.2.3 Plates & Bowls
9.2.4 Hinged Containers
9.3 Protective Packaging
9.3.1 Medical
9.3.2 Automotive & Transportation
9.3.3 Consumer Goods/ Electronics Goods
9.3.4 Others
10 Packaging Foams Market, By Region
10.1 Introduction
10.2 Asia-Pacific
10.2.1 China
10.2.2 India
10.2.3 Japan
10.2.4 South Korea
10.2.5 Thailand
10.2.6 Singapore
10.2.7 Indonesia
10.2.8 Rest of the Asia
10.3 North America
10.3.1 U.S
10.3.2 Mexico
10.3.3 Canada
10.4 Europe
10.4.1 Russia
10.4.2 Turkey
10.4.3 Germany
10.4.4 France
10.4.5 U.K
10.4.6 Spain
10.4.7 Italy
10.4.8 Rest of Europe
10.5 Middle East & Africa (MEA)
10.5.1 Saudi Arabia
10.5.2 Africa
10.5.3 Iran
10.5.4 Rest of MEA
10.6 South America
10.6.1 Brazil
10.6.2 Argentina
10.6.3 Chile
10.6.4 Rest of the South America
11 Competitive Landscape
11.1 Recent Development Overview
11.2 Competitive Benchmarking
11.3 Market Share Analysis
12 Company Profiles
(Overview, Financial*, Products & Services, Strategy, and Developments)
12.1 ACH Foam Technologies
12.2 Arkema
12.3 Armacell LLC
12.4 BASF SE
12.5 Borealis AG
12.6 Foampartner Group
12.7 JSP
12.8 Kaneka Corporation
12.9 Recticel
12.10 Rogers Corporation
12.11 Sealed Air
12.12 Synthos S.A.
12.13 Total
12.14 Zotefoams PLC
12.15 Other Key Players*/Companies Considered in the Report
12.15.1 Dongshing Industry, Inc
12.15.2 Foamcraft Inc.
12.15.3 Hanwha Corporation
12.15.4 Synbra Holding bv
12.15.5 Tosoh Corporation
12.15.6 UFP Technologies
*Details Might Not Be Captured in Case of Unlisted Companies
13 Appendix
13.1 Excerpts From Industry Experts
13.2 Discussion Guide
13.3 Introducing RT: Real Time Market Intelligence
13.4 Available Customizations
13.5 Related Reports
List of Tables ( 112 Tables)
Table 1 Key Data of Packaging Foams, 2017-2022
Table 2 Packaging Foams Market Size, By Structure Type, 2015–2022 (Kiloton)
Table 3 Packaging Foam Market Size, By Structure Type, 2015–2022 (USD Million)
Table 4 Flexible Packaging Foams Market Size, By Region, 2015–2022 (Kiloton)
Table 5 Flexible Market Size, By Region, 2015–2022 (USD Million)
Table 6 Rigid Packaging Foam Market Size, By Region, 2015–2022 (Kiloton)
Table 7 Rigid Market Size, By Region, 2015–2022 (Kiloton)
Table 8 Packaging Foams Market Size, By Material Type, 2015–2022 (Kiloton)
Table 9 Packaging Foam Market Size, By Material Type, 2015–2022 (USD Million)
Table 10 Polystyrene Packaging Foams Market Size, By Region, 2015–2022 (Kiloton)
Table 11 Polystyrene Market Size, By Region, 2015–2022 (USD Million)
Table 12 Polyurethane Packaging Foam Market Size, By Region, 2015–2022 (Kiloton)
Table 13 Polyurethane Market Size, By Region, 2015–2022 (USD Million)
Table 14 Polyolefin Packaging Foams Market Size, By Region, 2015–2022 (Kiloton)
Table 15 Polyolefin Market Size, By Region, 2015–2022 (USD Million)
Table 16 Other Packaging Foam Market Size, By Region, 2015–2022 (Kiloton)
Table 17 Other Market Size, By Region, 2015–2022 (USD Million)
Table 18 Packaging Foams Market Size, By Region, 2015–2022 (Kiloton)
Table 19 Market Size, By Region, 2015–2022 (USD Million)
Table 20 Asia-Pacific: Packaging Foams Market Size, By Country, 2015–2022 (Kiloton)
Table 21 Asia-Pacific: Market Size, By Country, 2015–2022 (USD Million)
Table 22 Asia-Pacific: Market Size, By Structure Type, 2015–2022 (Kiloton)
Table 23 Asia-Pacific: Market Size, By Structure Type, 2015–2022 (USD Million)
Table 24 Asia-Pacific: Market Size, By Material Type, 2015–2022 (Kiloton)
Table 25 Asia-Pacific: Market Size, By Material Type, 2015–2022 (USD Million)
Table 26 China: Packaging Foam Market Size, By Structure Type, 2015–2022 (Kiloton)
Table 27 China: Market Size, By Structure Type, 2015–2022 (USD Million)
Table 28 China: Macroeconomic Indicators
Table 29 India: Packaging Foams Market Size, By Structure Type, 2015–2022 (Kiloton)
Table 30 India: Market Size, By Structure Type, 2015–2022 (USD Million)
Table 31 India: Macroeconomic Indicators
Table 32 Japan: Packaging Foam Market Size, By Structure Type, 2015–2022 (Kiloton)
Table 33 Japan: Market Size, By Structure Type, 2015–2022 (USD Million)
Table 34 South Korea: Packaging Foams Market Size, By Structure Type, 2015–2022 (Kiloton)
Table 35 South Korea: Market Size, By Structure Type, 2015–2022 (USD Million)
Table 36 Thailand: Packaging Foam Market Size, By Structure Type, 2015–2022 (Kiloton)
Table 37 Thailand: Market Size, By Structure Type, 2015–2022 (USD Million)
Table 38 Singapore: Packaging Foams Market Size, By Structure Type, 2015–2022 (Kiloton)
Table 39 Singapore: Market Size, By Structure Type, 2015–2022 (USD Million)
Table 40 Indonesia: Packaging Foam Market Size, By Structure Type, 2015–2022 (Kiloton)
Table 41 Indonesia: Market Size, By Structure Type, 2015–2022 (USD Million)
Table 42 Indonesia: Macroeconomic Indicators
Table 43 Rest of Asia-Pacific: Packaging Foams Market Size, By Structure Type, 2015–2022 (Kiloton)
Table 44 Rest of Asia-Pacific: Market Size, By Structure Type, 2015–2022 (USD Million)
Table 45 Europe: Packaging Foam Market Size, By Country, 2015–2022 (Kiloton)
Table 46 Europe: Market Size, By Country, 2015–2022 (USD Million)
Table 47 Europe: Market Size, By Structure Type, 2015–2022 (Kiloton)
Table 48 Europe: Market Size, By Structure Type, 2015–2022 (USD Million)
Table 49 Europe: Market Size, By Material Type, 2015–2022 (Kiloton)
Table 50 Europe: Market Size, By Material Type, 2015–2022 (USD Million)
Table 51 Russia: Packaging Foams Market Size, By Structure Type, 2015–2022 (Kiloton)
Table 52 Russia: Market Size, By Structure Type, 2015–2022 (USD Million)
Table 53 Russia: Macroeconomic Indicators
Table 54 Turkey: Packaging Foam Market Size, By Structure Type, 2015–2022 (Kiloton)
Table 55 Turkey: Market Size, By Structure Type, 2015–2022 (USD Million)
Table 56 Germany: Packaging Foams Market Size, By Structure Type, 2015–2022 (Kiloton)
Table 57 Germany: Market Size, By Structure Type, 2015–2022 (USD Million)
Table 58 Germany: Macroeconomic Indicators
Table 59 France: Packaging Foam Market Size, By Structure Type, 2015–2022 (Kiloton)
Table 60 France: Market Size, By Structure Type, 2015–2022 (USD Million)
Table 61 France: Macroeconomic Indicators
Table 62 U.K.: Packaging Foams Market Size, By Structure Type, 2015–2022 (Kiloton)
Table 63 U.K.: Market Size, By Structure Type, 2015–2022 (USD Million)
Table 64 Spain: Packaging Foam Market Size, By Structure Type, 2015–2022 (Kiloton)
Table 65 Spain: Market Size, By Structure Type, 2015–2022 (USD Million)
Table 66 Italy: Packaging Foams Market Size, By Structure Type, 2015–2022 (Kiloton)
Table 67 Italy: Market Size, By Structure Type, 2015–2022 (USD Million)
Table 68 Rest of Europe: Packaging Foam Market Size, By Structure Type, 2015–2022 (Kiloton)
Table 69 Rest of Europe: Market Size, By Structure Type, 2015–2022 (USD Million)
Table 70 North America: Packaging Foams Market Size, By Country, 2015–2022 (Kiloton)
Table 71 North America: Market Size, By Country, 2015–2022 (USD Million)
Table 72 North America: Market Size, By Structure Type, 2015–2022 (Kiloton)
Table 73 North America: Market Size, By Structure Type, 2015–2022 (USD Million)
Table 74 North America: Market Size, By Material Type, 2015–2022 (Kiloton)
Table 75 North America: Market Size, By Material Type, 2015–2022 (USD Million)
Table 76 U.S.: Packaging Foams Market Size, By Structure Type, 2015–2022 (Kiloton)
Table 77 U.S.: Market Size, By Structure Type, 2015–2022 (USD Million)
Table 78 U.S.: Macroeconomic Indicators
Table 79 Mexico: Packaging Foam Market Size, By Structure Type, 2015–2022 (Kiloton)
Table 80 Mexico: Market Size, By Structure Type, 2015–2022 (USD Million)
Table 81 Mexico: Macroeconomic Indicators
Table 82 Canada: Packaging Foams Market Size, By Structure Type, 2015–2022 (Kiloton)
Table 83 Canada: Market Size, By Structure Type, 2015-2022 (USD Million)
Table 84 Canada: Macroeconomic Indicators
Table 85 South America: Packaging Foam Market Size, By Country, 2015–2022 (Kiloton)
Table 86 South America: Market Size, By Country, 2015–2022 (USD Million)
Table 87 South America: Market Size, By Structure Type, 2015–2022 (Kiloton)
Table 88 South America: Market Size, By Structure Type, 2015–2022 (USD Million)
Table 89 South America: Market Size, By Material Type, 2015–2022 (Kiloton)
Table 90 South America: Market Size, By Material Type, 2015–2022 (USD Million)
Table 91 Brazil: Packaging Foams Market Size, By Structure Type, 2015–2022 (Kiloton)
Table 92 Brazil: Market Size, By Structure Type, 2015–2022 (USD Million)
Table 93 Argentina: Packaging Foam Market Size, By Structure Type, 2015–2022 (Kiloton)
Table 94 Argentina: Market Size, By Structure Type, 2015–2022 (USD Million)
Table 95 Chile: Packaging Foams Market Size, By Structure Type, 2015–2022 (Kiloton)
Table 96 Chile: Market Size, By Structure Type, 2015–2022 (USD Million)
Table 97 Rest of South America: Packaging Foam Market Size, By Structure Type, 2015–2022 (Kiloton)
Table 98 Rest of South America: Market Size, By Structure Type, 2015–2022 (USD Million)
Table 99 Middle East & Africa: Packaging Foams Market Size, By Country, 2015–2022 (Kiloton)
Table 100 Middle East & Africa: Market Size, By Country, 2015–2022 (USD Million)
Table 101 Middle East & Africa: Market Size, By Structure Type, 2015–2022 (Kiloton)
Table 102 Middle East & Africa: Market Size, By Structure Type, 2015–2022 (USD Million)
Table 103 Middle East & Africa: Market Size, By Material Type, 2015–2022 (Kiloton)
Table 104 Middle East & Africa: Market Size, By Material Type, 2015–2022 (USD Million)
Table 105 Saudi Arabia: Packaging Foam Market Size, By Structure Type, 2015–2022 (Kiloton)
Table 106 Saudi Arabia: Market Size, By Structure Type, 2015–2022 (USD Million)
Table 107 Africa: Packaging Foams Market Size, By Structure Type, 2015–2022 (Kiloton)
Table 108 Africa: Market Size, By Structure Type, 2015–2022 (USD Million)
Table 109 Iran: Packaging Foam Market Size, By Structure Type, 2015–2022 (Kiloton)
Table 110 Iran: Market Size, By Structure Type, 2015–2022 (USD Million)
Table 111 Rest of Middle East & Africa: Packaging Foams Market Size, By Structure Type, 2015–2022 (Kiloton)
Table 112 Rest of Middle East & Africa: Packaging Foam Market Size, By Structure Type, 2015–2022 (USD Million)
List of Figures (16 Figures)
Figure 1 Asia-Pacific to Register the Highest CAGR During the Forecast Period
Figure 2 Po to Register the Highest CAGR During the Forecast Period
Figure 3 Attractive Opportunities in Packaging Foams Market
Figure 4 PS to Be the Largest and Po to Be the Fastest-Growing Material Type, 2017–2022
Figure 5 Packaging Foams Market to Witness High Growth in Developing Countries Between 2017 and 2022
Figure 6 China to Be the Fastest-Growing Packaging Foam Market During the Forecast Period
Figure 7 Value Chain Analysis of Packaging Foams Industry
Figure 8 Porter’s Five Forces Analysis
Figure 9 Flexible Foam to Be the Fastest-Growing Structure Type of Packaging Foams During the Forecast Period
Figure 10 Packaging Foams Market, By Service Type
Figure 11 EPS Packaging Foams: Service Type Market Share By Volume
Figure 12 Key Significant Indicators Impacting Packaging Foam Market
Figure 13 Investments & Expansions and New Product Launches Were the Key Strategies Adopted Between 2010 and 2017
Figure 14 Competitive Benchmarking Matrix
Figure 15 Competency Parameters for Benchmarking
Figure 16 Market Share Analysis of Key Players in 2015


Growth opportunities and latent adjacency in Packaging Foams Market