
EPP Foam Market

EPP Foam Market by Type (Low-density, High-density, Porous PP), Application (Automotive, Packaging, Consumer Products), and Region (North America, Europe, Asia Pacific, South America, Middle East & Africa) - Global Forecast to 2030


EXPANDED POLYPROPYLENE (EPP) MARKET
Source: Secondary Research, Interviews with Experts, MarketsandMarkets Analysis | Updated on : March 17, 2026
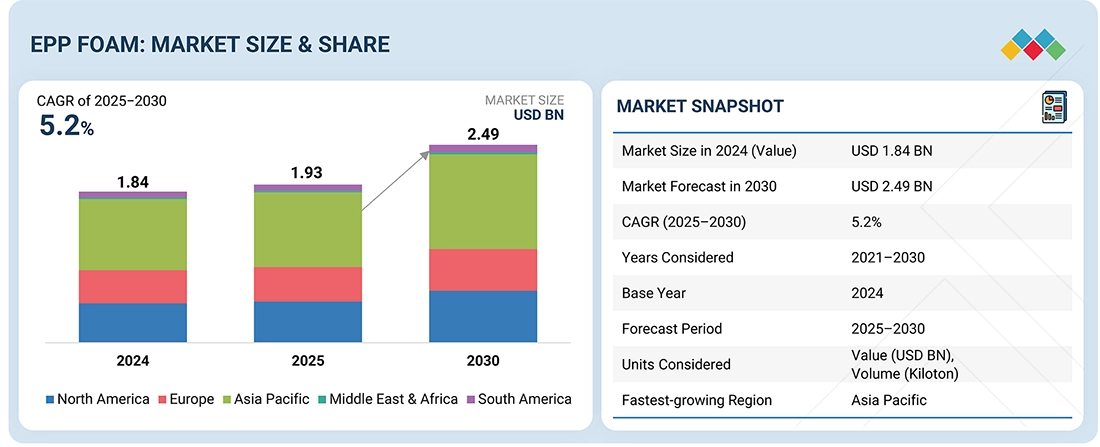
The EPP foam market is projected to reach USD 2.49 billion by 2030 from USD 1.93 billion in 2025, at a CAGR of 5.2% from 2025 to 2030. EPP foam products have a long service life and are resilient, reducing the need for frequent replacements. The rise of e-commerce has led to increased demand for protective packaging materials. EPP foam is an excellent choice for packaging delicate and fragile items because of its cushioning and shock-absorbing capabilities.
KEY TAKEAWAYS
-
BY RAW MATERIALThe EPP foam market comprises synthetic polypropylene and bio-based polypropylene. The introduction of bio-based polypropylene is enhancing sustainability in the market and expanding the choices that users have.
-
BY TYPETypes include low-density, high-density, and porous PP. High-density EPP holds the largest share as it offers superior strength, durability, and impact resistance required in demanding applications such as automotive components.
-
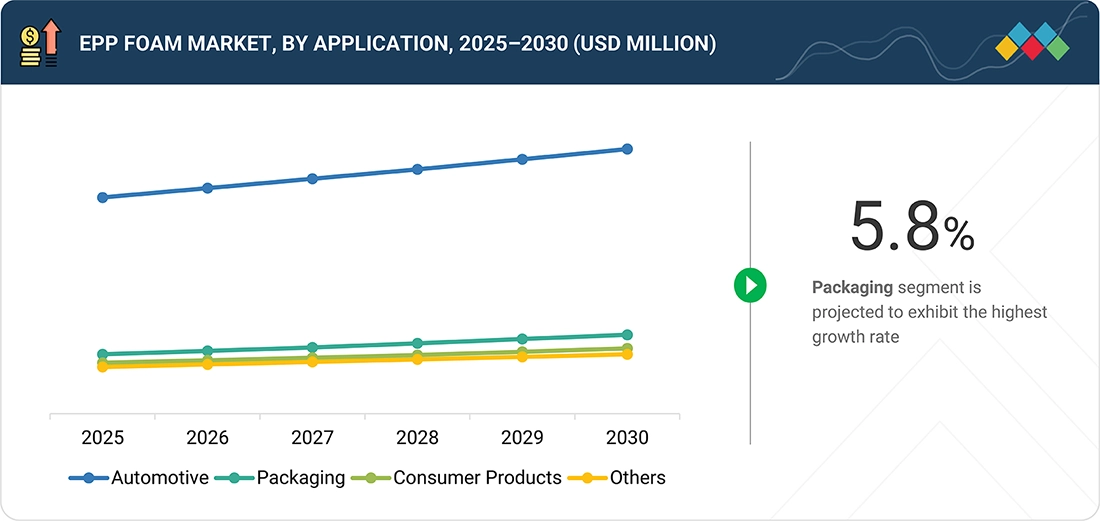
BY APPLICATIONKey applications include automotive, packaging, consumer products, and others. The automotive sector holds the largest market share as EPP foam enables lightweighting, energy absorption, and thermal efficiency, aligning with industry goals for safety, fuel economy, and emission reduction.
-
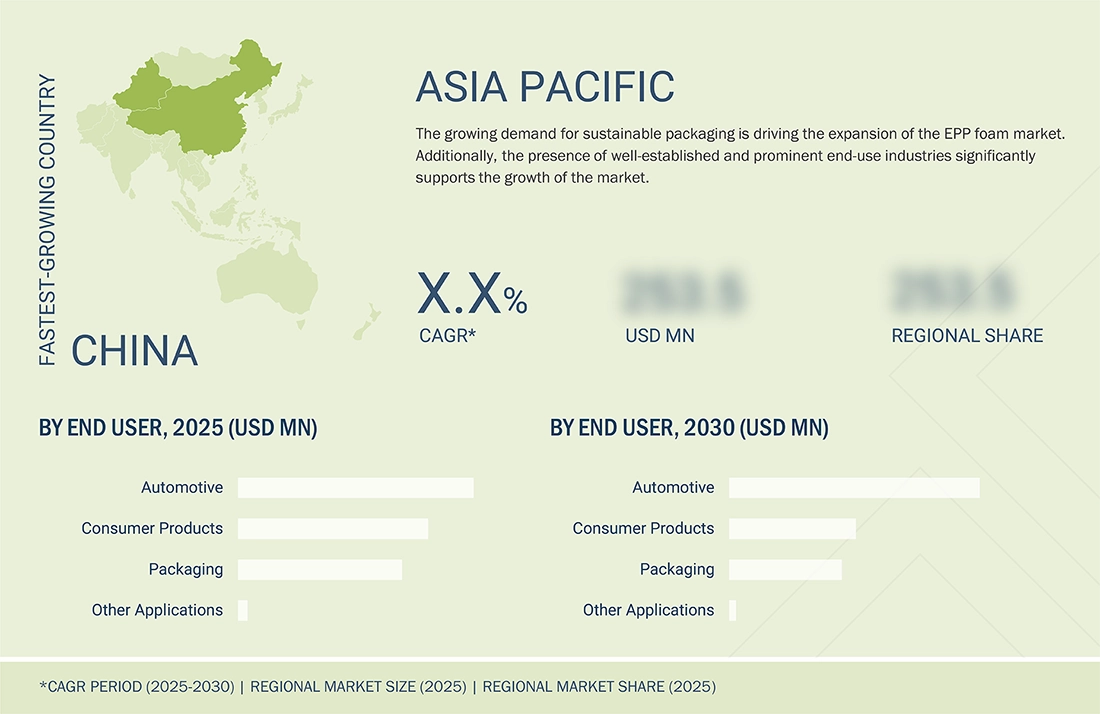
BY REGIONThe EPP foam market covers Europe, North America, Asia Pacific, South America, and the Middle East & Africa. Asia Pacific is the largest market for EPP foam. It is home to several prominent EPP foam companies and is witnessing growing adoption from the automotive sector.
-
COMPETITIVE LANDSCAPEMajor market players have adopted both, organic and inorganic strategies such as expansions, partnerships, acquisitions, and product launches. For instance, Knauf Industries has entered into an agreement to acquire the Neopolen business from BASF to enhance its position in the foam industry. This acquisition includes the production plant at BASF's Schwarzheide, Germany site, providing Knauf with an attractive, integrated infrastructure and a highly experienced workforce.
The EPP foam market is witnessing steady growth, driven by increasing demand for polycarbonate across various industries, rising adoption in the automotive industry for lightweight and safety components, the rapid growth of e-commerce, and the rising demand for protective packaging, and extensive use in construction and building materials. New deals and developments, including strategic partnerships between OEMs and material suppliers, expansions of production capacities, are reshaping the industry landscape.
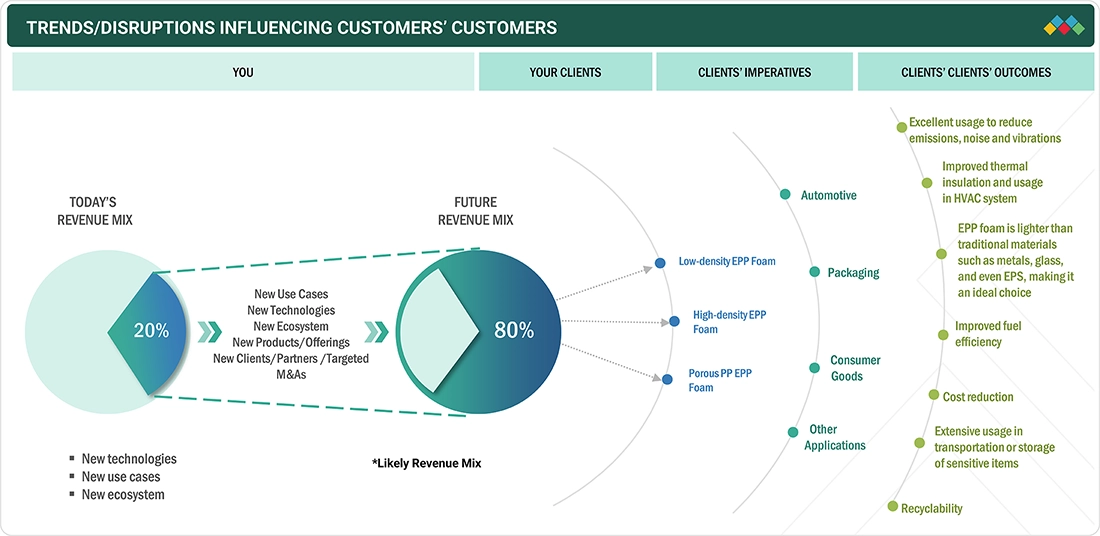
TRENDS & DISRUPTIONS IMPACTING CUSTOMERS' CUSTOMERS
The influence on consumers’ businesses arises from emerging customer trends and disruptions, such as lightweighting in the automotive industry aimed at reducing emissions and enhancing fuel efficiency, the increasing demand for improved thermal insulation in HVAC systems, and the transition toward recyclable and cost-efficient packaging solutions. The primary clients of EPP foam manufacturers, including automotive, packaging, consumer goods, and other industrial sectors, serve applications that are progressively seeking materials to replace traditional options such as metals, glass, and EPS with lighter, more sustainable, and versatile alternatives. These developments are poised to impact end-user revenue by improving efficiency, lowering costs, and facilitating compliance with sustainability objectives. Consequently, this will influence the revenue of the clients and ultimately stimulate growth opportunities for EPP foam manufacturers.
Source: Secondary Research, Interviews with Experts, MarketsandMarkets Analysis
MARKET DYNAMICS
Level
-
•Rising adoption in automotive industry for lightweight and safety components

-
•Rapid growth of e-commerce and rising demand for protective packaging

Level
-
•High production and manufacturing costs

-
•Limited recycling infrastructure

Level
-
•Alignment with circular economy and sustainability goals

-
•Rising demand for lightweight EPP foam in aerospace and aviation industries

Level
-
•Competition from substitutes

-
•Regulatory compliance

Source: Secondary Research, Interviews with Experts, MarketsandMarkets Analysis
Driver: Rising adoption in automotive industry for lightweight and safety components
The polycarbonate industry had been one of the major end-users of the EPP Foam segment in chemicals. Over the years, the demand for polycarbonates has witnessed an extraordinary rise from several application industries like automotive, electronics, construction, and energy storage. DMC has become important as an environmentally benign route through transesterification for sustainable polycarbonate production, thereby completely replacing hazardous phosgene routes. Polycarbonates, because of their properties such as impact resistance, transparency, thermal resistance, and lightweight, have been extensively used in automotive lightweighting for fuel efficiency and EVs, electronics manufacturing, medical devices, and construction. Asia Pacific, dominated by China, India, and South Korea, leads in demand for DMC due to the massive production and infrastructure buildup in this region. Furthermore, investments pouring in for battery-grade DMC for lithium-ion electrolytes in EVs are expected to surge its demand. The market is expected to gain from green manufacturing and stronger regulations, thus sustaining the growth till 2030.
Restraint: High production and manufacturing costs
The production processes required to produce EPP foam involves specialized techniques such as extrusion, bead expansion, molding, and curing. Each technique requires precise execution to meet the desired structure and performance characteristics of the foam. The high-tech and modern machinery installation costs required to set up these processes are relatively high and require upfront investments which raises the overall cost of production. Further, to maintain consistent quality, a high level of technical skills are required, which further adds to the total operating costs. These high initial costs can act as an entry barrier for new players and make it harder for the manufacturers to survive in price-sensitive markets.
Opportunity: Alignment with circular economy and sustainability goals
Environmental sustainability and circular economy models hold significant importance across industries, offering the EPP foam market a major opportunity. EPP, which is fully recyclable, maintains its properties even after multiple recycling cycles, making it a practical alternative to single-use plastics. Additionally, its lightweight nature directly contributes to energy efficiency by reducing fuel consumption and CO2 emissions during transportation. Studies indicate that lightweight plastics in automotive applications can result in vehicle weight reductions of up to 20-30%, thereby boosting fuel efficiency by 6-8% and lowering greenhouse gas emissions. Demand is further driven by global sustainability regulations and corporate commitments. The European Union’s Circular Economy Action Plan (2020) and similar policies worldwide provide incentives for industries to adopt recyclable and reusable materials. Leading automotive OEMs and packaging manufacturers are increasingly integrating EPP foam into their sustainability initiatives to meet short-term carbon reduction goals. The shift towards reusable transport packaging solutions aligns with EPP’s durability and recyclability.
Challenge: Competition from substitutes
The strong competition the EPP foam market faces from substitute materials, such as expanded polystyrene (EPS), polyurethane (PU) foam, and extruded polystyrene (XPS), is one of the major challenges for the EPP foam industry. EPS is a very low-cost and easily accessible material, making it the top choice for packaging and insulation, especially in budget-sensitive industries. PU foam is another widely used material in furniture, bedding, and automotive seating. It offers flexibility and cushioning while being more affordable than EPP foam. XPS is extensively employed for thermal insulation in the construction sector, and its established recycling streams make it a preferred option over EPP foam. While EPP foam excels in impact resistance, durability, and sustainability, the lower cost and more dedicated supply chain of these alternative materials will continue to challenge the industry's ability to increase EPP foam penetration.
EPP Foam Market: COMMERCIAL USE CASES ACROSS INDUSTRIES
| COMPANY | USE CASE DESCRIPTION | BENEFITS |
|---|---|---|
 |
Molded EPP parts for bumper cores, headrests, seat cores, energy-absorbing blocks, under-floor insulators, and interior fillers: EPP beads are molded into complex geometries that absorb impact while remaining lightweight. | Improved passenger safety through energy absorption; vehicle mass reduction of fuel/EV range benefits; parts durability and recyclability (EPP can be reprocessed) |
 |
Tailored internal packaging inserts for high-value electronics, lighting fixtures, medical kits, and fragile instruments: EPP is molded to part geometry for repeatable protection and can be used in reusable returnable systems. | Lower product damage rates; reduced packing labor (precision fits); potential for reusable/returnable packaging programs that cut material waste and long-term cost |
 |
Reusable instrument trays, protective shipping inserts for temperature-sensitive products, and returnable kits for surgical instruments: EPP’s closed-cell structure and inertness suit sterile logistics and repeated handling. | Protects expensive devices, supports sterilization workflows or returnable kit logistics, reduces single-use packaging waste and total lifecycle cost |
 |
Helmet impact liners (cycling, motorbike, equestrian), protective pads, lightweight cores in molded consumer furniture: EPP combines resilience with repeated impact recovery. | Better shock absorption and repeated-use durability (helmets that recover shape after multiple impacts), low weight for comfort, long service life |
 |
Thermal insulation panels, acoustic pads, lightweight formwork inserts, and vibration damping elements: EPP can be shaped for modular construction components. | Improved thermal and acoustic performance with low density, reduced structure dead-load, and parts that are durable and reusable in modular systems |
Logos and trademarks shown above are the property of their respective owners. Their use here is for informational and illustrative purposes only.
MARKET ECOSYSTEM
The EPP foam market ecosystem consists of raw material suppliers (e.g., ExxonMobil Chemical, Borealis), EPP foam manufacturers (e.g., JSP Corporation, Kaneka Corporation), and end users (e.g., Toyota, Dell). Raw materials like polypropylene are processed into EPP Foam for use in various end-use industries. End users drive demand for automotive and packaging applications. Collaboration across the value chain is key to innovation and market growth.
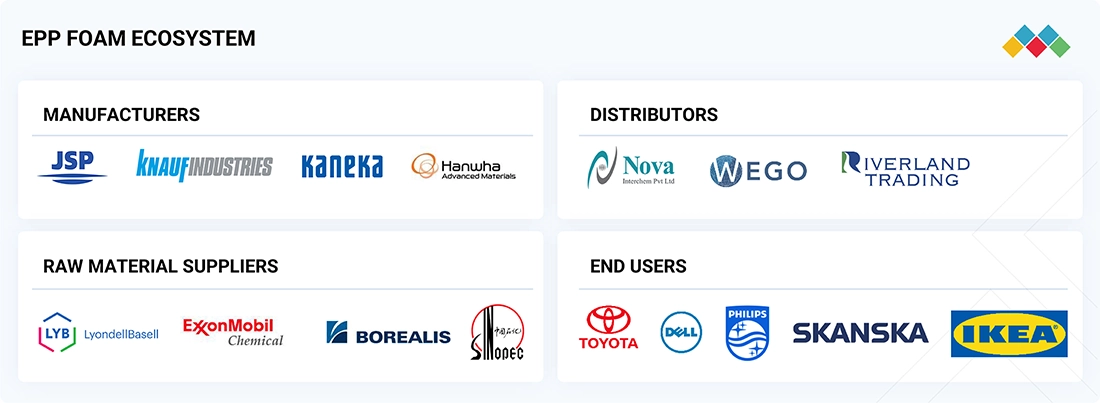
Logos and trademarks shown above are the property of their respective owners. Their use here is for informational and illustrative purposes only.
MARKET SEGMENTS
Source: Secondary Research, Interviews with Experts, MarketsandMarkets Analysis
EPP Foam Market, By Application
The automotive sector is expected to grow significantly during the forecast period, driven by the material's flexibility, lightweight nature, and performance benefits. EPP foam enhances vehicle safety, comfort, and efficiency, making it an indispensable material for modern automobiles. EPP foam's superior energy absorption properties make it ideal for crash-relevant components such as bumpers, side-impact protection, and headrests. Its soundproofing qualities reduce engine and road noise, ensuring a smoother and more relaxed driving experience. Additionally, the lightweight nature of the material makes vehicles lighter, improving fuel efficiency and reducing emissions, aligning with global sustainable goals. EPP foam is also highly moldable, allowing designers to create both aesthetic and ergonomic interiors, from armrests to dashboard trims and door panels, combining comfort with innovative design. All these attributes position EPP foam as a crucial material in the development of new, safe, and sustainable vehicles.
EPP Foam Market, By Type
The demand for high-density EPP foam is anticipated to dominate the market share during the forecast period, attributed to the material’s superior strength, durability, and impact resistance. High-density EPP foam features a dense cellular structure, rendering it a preferred choice over low-density and porous PP for various applications. The automotive industry prefers high-density EPP foam owing to its lightweight properties and high energy absorption capacity, making it suitable for safety components such as bumpers, crash absorbers, and interior protection.
REGION
Asia Pacific is projected to hold the most significant market share during the forecast period
A key driver for EPP foam is the region’s strong position in the global consumer electronics market, where EPP foam is used to protect sensitive components and high-value devices and ensure safe transportation. The lightweight structure and superior cushioning capability of EPP foam help protect sensitive products against shock, vibration, and damage. Asia Pacific is also poised to become a global leader in the automotive sector and is experiencing a rise in the number of automobile manufacturing plants. This trend further drives demand as EPP foam is increasingly adopted in various automotive components to enhance vehicle safety, comfort, and fuel economy. The growing emphasis on sustainability standards and innovation further fuels the adoption of recyclable materials like EPP foam in the region.
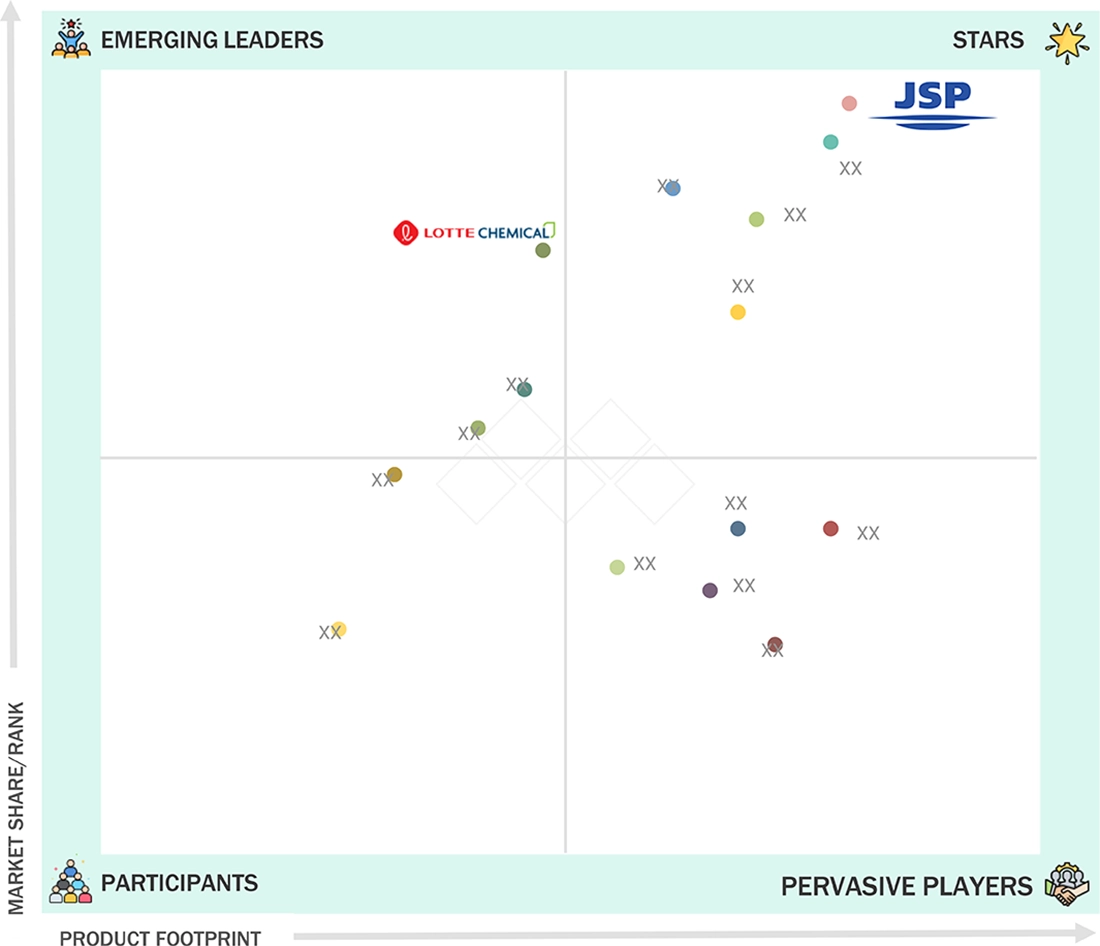
EPP Foam Market: COMPANY EVALUATION MATRIX
In the EPP foam market, JSP Corporation (Star) leads with a strong market share and extensive product range, driven by its well-known reputation as a global leader in the EPP foam industry, backed by decades of experience and a robust manufacturing presence across key regions. Its strength lies in its diversified product portfolio, which includes automotive safety components, HVAC insulation, packaging solutions, and leisure products. Lotte Chemical Corporation (Emerging Leader) is gaining recognition with its specialized EPP Foam solutions for organic synthesis applications, bolstering its position through innovation and niche product offerings.
Source: Secondary Research, Interviews with Experts, MarketsandMarkets Analysis
KEY MARKET PLAYERS
MARKET SCOPE
| REPORT METRIC | DETAILS |
|---|---|
| Market Size in 2024 (Value) | USD 1.84 BN |
| Market Forecast in 2030 | USD 2.49 BN |
| CAGR (2025–2030) | 5.2% |
| Years Considered | 2021–2030 |
| Base Year | 2024 |
| Forecast Period | 2025–2030 |
| Units Considered | Value (USD BN), Volume (Kiloton) |
| Report Coverage | Revenue forecast, company ranking, competitive landscape, growth factors, and trends |
| Segments Covered |
|
| Regional Scope | North America, Europe, Asia Pacific, South America, and Middle East & Africa |
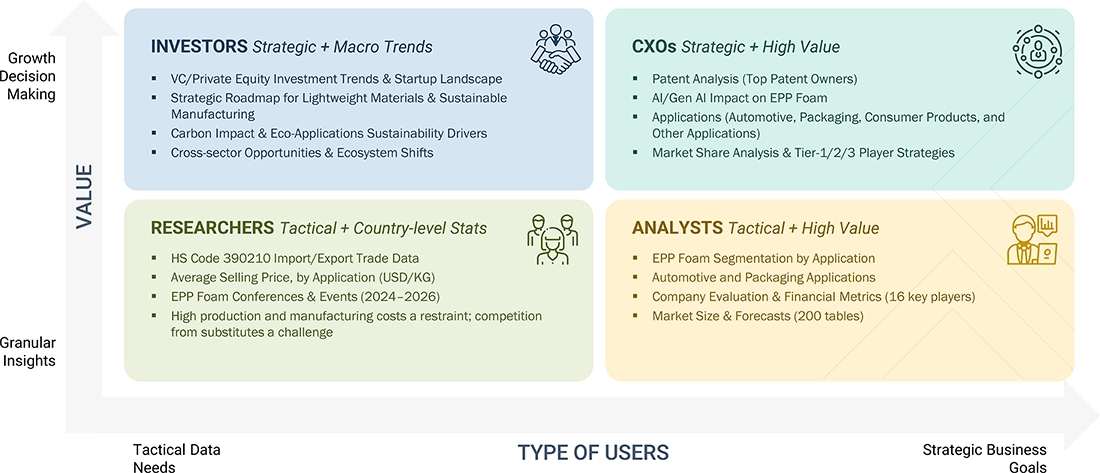
WHAT IS IN IT FOR YOU: EPP Foam Market REPORT CONTENT GUIDE
DELIVERED CUSTOMIZATIONS
We have successfully delivered the following deep-dive customizations:
| CLIENT REQUEST | CUSTOMIZATION DELIVERED | VALUE ADDS |
|---|---|---|
| Automotive OEM | • Crash management system benchmarking using EPP foam | • Enhance vehicle safety & impact resistance |
| Electronics & Consumer Goods Manufacturer | • Market sizing of EPP foam in packaging, housings, protective gear | • Improve product durability & consumer safety |
| HVAC & Insulation Product Manufacturer | • Thermal performance benchmarking of EPP for ducting & insulation | • Meet energy efficiency regulations |
| Sports, Leisure & Toy Manufacturer | • Customization of EPP grades for lightweight, safe recreational goods | • Enhance safety and comfort of end-products |
| Chemical/Polymer Producer | • EPP production capacity analysis across global plants | • Identify expansion or JV opportunities |
RECENT DEVELOPMENTS
- January 2024 : JSP acquired a 30% stake in General-Industries Deutschland GmbH’s foam recycling business, thereby strengthening its position in the EPP foam recycling market. General-Industries Deutschland GmbH is a leading European recycler of EPP and EPE. This move ensures long-term access to high-quality recyclates for JSP, aligning with its Vision2027 sustainability strategy and further supporting its ARPRO RE line of recycled-content foams. The partnership with GID enhances JSP's ability to implement circular economy solutions and ensures a consistent supply of secondary raw materials to meet the growing demand for sustainable EPP foam applications.
- September 2023 : Knauf Industries entered into an agreement to acquire the Neopolen business from BASF to strengthen its position in the foam industry. This acquisition includes the production plant at BASF's Schwarzheide site in Germany, providing Knauf with an attractive, integrated infrastructure and a highly experienced workforce. The transaction secures the Neopolen product line, intellectual property, and existing customer base, perfectly aligning with Knauf's growth strategy to expand its foam portfolio and add valuable technical expertise. The company looks forward to supplying its customers with high-quality Neopolen and integrating the new colleagues into the Knauf team to ensure a smooth transition and a bright future for the business.
- March 2022 : Kaneka Corporation developed a new grade in the EPERAN series; it contains 25% recycled content from end-of-life EPP parts.
Table of Contents
 Exclusive indicates content/data unique to MarketsandMarkets and not available with any competitors.
Methodology
The study involved four main activities in estimating the current size of the EPP foam market: comprehensive secondary research gathered information on the market, related markets, and parent markets. The next step was to validate these findings, assumptions, and sizing with industry experts across the EPP foam value chain through primary research. Both top-down and bottom-up approaches were used to estimate the entire market size. Then, market segmentation and data triangulation helped to estimate the size of segments and subsegments.
Secondary Research
Secondary sources for this research study include annual reports, press releases, and investor presentations of companies; white papers; certified publications; articles by recognized authors; gold- and silver-standard websites; EPP foam manufacturing companies, regulatory bodies, trade directories, and databases. The secondary research was mainly used to obtain key information about the industry’s supply chain, the pool of key players, market classification, and segmentation according to industry trends, to the bottom-most level, and regional markets. It has also been used to obtain information about key developments from a market-oriented perspective.
Primary Research
The EPP foam market includes various stakeholders, such as raw material suppliers, technology support providers, EPP foam manufacturers, and regulatory organizations in the supply chain. Different primary sources from both the supply and demand sides were interviewed to gather qualitative and quantitative information. Supply-side primary sources included industry experts like Chief Executive Officers (CEOs), vice presidents, marketing directors, technology and innovation directors, and other key executives from companies and organizations active in the EPP foam market. On the demand side, primary sources comprised directors, marketing heads, and purchasing managers from various sourcing industries.
The following is the breakdown of the primary respondents:

To know about the assumptions considered for the study, download the pdf brochure
Market Size Estimation
The top-down and bottom-up approaches have been used to estimate and validate the total size of the EPP foam market. These approaches have also been widely employed to estimate the size of various dependent market subsegments. The research methodology used to determine the market size included the following:
The following segments outline the market size estimation process used in this study:
- The key players in the market were identified through secondary research.
- The market share in the respective regions was identified through primary and secondary research.
- Primary and secondary research determined the EPP foam market's value chain and market size in terms of value and volume.
- All percentage shares, splits, and breakdowns were determined using secondary sources and verified through primary sources.
- All possible parameters that affect the market covered in this research study were accounted for, viewed in extensive detail, verified through primary research, and analyzed to obtain the final quantitative and qualitative data.
- The research included studying the annual and financial reports of the top market players and interviewing industry experts, such as CEOs, VPs, directors, sales managers, and marketing executives, for key quantitative and qualitative insights.
Global EPP Foam Market Size: Bottom-up Approach and Top-down Approach

Data Triangulation
After estimating the overall market size using the methods described above, the market was divided into several segments and sub-segments. To finalize the market engineering process and determine accurate statistics for each segment and sub-segment, data triangulation and market breakdown procedures were utilized, where applicable. The data was triangulated by analyzing various factors and trends from both the demand and supply sides in the oil & gas sector.
Market Definition
Expanded polypropylene foam, commonly referred to as EPP foam, is a type of thermoplastic foam material that belongs to the expanded polymer family. It is produced through polymer expansion, wherein unprocessed polypropylene resin beads are enlarged by the addition of steam prior to molding into the desired shape. The resultant product is a lightweight, closed-cell foam material characterized by interconnected spherical beads resembling a beehive. EPP foam is distinguished as an excellent choice for applications requiring adaptable and lightweight materials. Due to its exceptional combination of properties, EPP foam is a distinctive material favored by numerous industries.
Stakeholders
- Manufacturers of EPP foam
- Traders, distributors, and suppliers of EPP foam
- Government and research organizations
- Associations and industrial bodies
- Research and consulting firms
- R&D institutions
- Environmental support agencies
- Investment banks and private equity firms
Report Objectives
- To analyze and forecast the market size of the EPP foam market in terms of value and volume
- To provide detailed information regarding major factors (drivers, restraints, challenges, and opportunities) influencing the market
- To analyze and forecast the global EPP foam market based on type, application, and region
- To analyze opportunities in the market for stakeholders and provide details of a competitive landscape for market leaders
- To forecast the size of various market segments based on five major regions: Asia Pacific, Europe, North America, South America, and the Middle East & Africa, along with their respective key countries
- To analyze competitive developments, such as partnerships and expansions, in the market
- To strategically profile the key players and comprehensively analyze their market share and core competencies
Key Questions Addressed by the Report
Which are the major companies in the EPP foam market?
Major companies in the EPP foam market are JSP Corporation (Japan), BASF SE (Germany), Kaneka Corporation (Japan), Hanwha Solutions (South Korea), and Sonoco Products Company (US), among others.
Which end-use industries in the EPP foam market are likely to exhibit the highest CAGR during the forecast period?
The automotive and packaging industries are expected to witness the highest CAGR due to the growing demand for lightweight, energy-absorbing, and recyclable materials.
Which product types in the EPP foam market are likely to drive growth over the coming years?
Automotive components and protective packaging applications, among offerings of the EPP foam market, are likely to drive market growth during the forecast period.
What are the drivers and opportunities for the EPP foam market?
Increasing demand for lightweight materials in automotive manufacturing, rising focus on fuel efficiency, and growing use of protective packaging solutions are the major drivers and opportunities of the EPP foam market.
What are the restraints and challenges for the players in the EPP foam market?
Fluctuating raw material prices, recycling challenges, and competition from alternative foam materials are the major factors hindering the growth of the EPP foam market.
Need a Tailored Report?
Customize this report to your needs
Get 10% FREE Customization
Customize This ReportPersonalize This Research
- Triangulate with your Own Data
- Get Data as per your Format and Definition
- Gain a Deeper Dive on a Specific Application, Geography, Customer or Competitor
- Any level of Personalization
Let Us Help You
- What are the Known and Unknown Adjacencies Impacting the EPP Foam Market
- What will your New Revenue Sources be?
- Who will be your Top Customer; what will make them switch?
- Defend your Market Share or Win Competitors
- Get a Scorecard for Target Partners

Custom Market Research Services
We Will Customise The Research For You, In Case The Report Listed Above Does Not Meet With Your Requirements
Get 10% Free CustomisationTESTIMONIALS

We at Nissan Chemicals Corporation have been clients of MarketsandMarkets for more than a year now. We recently consulted MarketsandMarkets for a study, the team at MarketsandMarkets was extremely professional and organized. The business insights were very detailed and aligned well with our expectations that really helped us formulate the Business Plans and device new strategies for development themes. MarketsandMarkets offers a unique combination of expertise and dedicated engagement model. Their research findings have helped us in designing our Pricing Strategy which will make it easier for us to predict the future sales and profits for the next ten years. We look forward to working with MarketsandMarkets in the future.
VP of Strategy & New Business Development
Leading Specialty Chemical Company
The MarketsandMarkets Engagement Model, composed of both the Knowledge Store and advisory custom research, has greatly helped us in understanding our markets and making strategic decisions. The Knowledge Store is a fast way to allow everyone in our organization to understand more about most any market they are interested in. The ability to then get custom research done and get answers to specific strategic questions and market insight has been spectacular. The Markets and Markets team feel more like colleagues than vendors and their services have helped us change our culture where statements of things like growth opportunities and competitive position are always backed by industry research.

Rich Gibson,
Director, Corporate Strategy
Milliken & Company,
Leading Industrial Manufacturer of specialty chemical, floor covering, performance and protective textile materials, and healthcaremilliken.com
MarketsandMarkets is a trusted resource that helps us to better understand markets that are near-adjacencies-whether its technology, value chain or geography. Their Knowledge Store platform provides a dashboard of markets and their characteristics which is easy to use and saves us time.
Adam Shaw,
Market Development and Strategy Manager
AdvanSix Inc. USA,
An American Leader in Chemicalswww.advansix.com
The Knowledge Store from MarketsandMarkets is a valuable tool which has helped my team acquire greater insight in to the end markets that our business serves. This has enabled us to help our company build stronger strategies throughout our planning process.
TOSHIO KINOSHITA
Senior Chif Consultion Research & Consulting Division
Mitsubishi Chemical Research Corporation,
Leading Manufacturer of Chemical Productswww.mitsubishichem-res.co.jp/en/

We recently engaged with MarketsandMarkets for a study, the team not only clearly understood our business objectives but was also extremely professional in the way they handled the entire project. The study was efficiently conducted in a phase-wise manner, and the engagement model furnished us with high-quality business insights that far exceeded our expectations at each phase. We were especially happy that MarketsandMarkets could provide us with both, an English as well as a Japanese version of the study. A special thanks to the Analyst Team and Client Services Team, whose fluency in Japanese enhanced our comfort level, as we could converse with them in our preferred language.
Independent entrepreneurs
Arrow Precision
We approached MarketsandMarkets for study on Proppants Market, and their work exceeded our expectations. The study conducted was comprehensive and enabled us to view the market through the various dimensions. In addition, the team was extraordinarily responsive throughout the process and resolved our queries on time. I strongly recommend MarketsandMarkets and will certainly consider them for additional market assessments we will need in the future.
Global engineering company, Japan
Deputy Manager,
Strategic Planning OfficeThe high-quality insights shared by the MarketsandMarkets team helped us understand the pharmaceutical plant designers in a specific geography. It also captured the risks that we may likely face in communicating with our potential partners. The study would enable us identify partners, which would impact our future growth.


Growth opportunities and latent adjacency in EPP Foam Market