The research study involved extensive secondary sources, directories, and databases such as Bloomberg Businessweek and Factiva to identify and collect information useful for a technical, market-oriented, and commercial study of the pea protein market. In-depth interviews were conducted with various primary respondents—such as key industry participants, subject matter experts (SMEs), C-level executives of key market players, and industry consultants—to obtain and verify critical qualitative and quantitative information and assess prospects.
Secondary Research
The secondary sources referred for this research study include government sources, such as the Food and Agriculture Organization (FAO), the US Department of Agriculture (USDA), Eurostat (EU Database), and various national ministries of the agricultural department, corporate filings (such as annual reports, press releases, investor presentations, and financial statements), and trade, business, and professional associations such as In the secondary research process, various organizations such as the Saskatchewan Pulse Growers (Saskpulse), Good Food Institute (GFI), and European Vegetable Protein Association (EUVEPRO), were referred to identify and collect information for this study.
Secondary research was mainly used to obtain key information about the industry's supply chain—the total pool of key players, market classification, and segmentation according to the industry trends and key developments from market-oriented perspectives.
Primary Research
The pea protein market comprises several stakeholders, including raw material suppliers, ingredient suppliers, end-product manufacturers, and regulatory organizations in the supply chain. Various primary sources from both the supply and demand sides of the market were interviewed to obtain qualitative and quantitative information. Primary interviewees from the supply side include research institutions involved in R&D to introduce technology, distributors, wholesalers, importers & exporters of processed ingredients manufacturers and technology providers. Primary sources from the demand-side include key opinion leaders, executives, vice presidents, and CEOs through questionnaires, emails, and telephonic interviews.

To know about the assumptions considered for the study, download the pdf brochure
Market Size Estimation
Both the top-down and bottom-up approaches have been used to estimate and validate the total size of the pea protein market. These approaches were extensive to determine the size of the subsegments in the market. The research methodology used to estimate the market size includes the following details:
-
Top-down approach:
-
The key players in the industry and the market were identified through extensive secondary research.
-
The industry's supply chain and market size were determined through primary and secondary research.
-
All percentage share splits and breakdowns were determined using secondary sources and verified through primary sources.
-
The parent market—the pea processed ingredients market—was considered to validate pea protein's market details further.
-
Bottom-up approach:
-
The market sizes were analyzed based on each type of pea protein share at regional and country levels. Thus, the global market for pea protein was estimated with a bottom-up approach of the type at the country level.
-
Based on the demand for the mode of application, offerings of key players, and the region-wise market share of major players, the global market for the mode of application was estimated.
-
Other factors considered include penetration rate of pea protein in end-user applications such as meat substitutes, performance nutrition, and functional foods, consumer awareness, and function trends, pricing trends, the adoption rate and price factors, patents registered, and organic and inorganic growth attempts.
-
All macroeconomic and microeconomic factors affecting the growth of the pea protein market were considered while estimating the market size.
-
All possible parameters that affect the market covered in this research study were accounted for, viewed in extensive detail, verified through primary research, and analyzed to obtain final quantitative and qualitative data.
Market size estimation: Top-Down approach

To know about the assumptions considered for the study, Request for Free Sample Report
Market size estimation methodology: Bottom-up approach

Data Triangulation
After arriving at the overall market size from the estimation process explained above, the total market was split into several segments and subsegments. The data triangulation and market breakdown procedures were employed, wherever applicable, to estimate the overall pea protein market and arrive at the exact statistics for all segments and subsegments. The data was triangulated by studying various factors and trends from the demand and supply sides. Along with this, the market size was validated using both the top-down and bottom-up approaches.
Market Definition
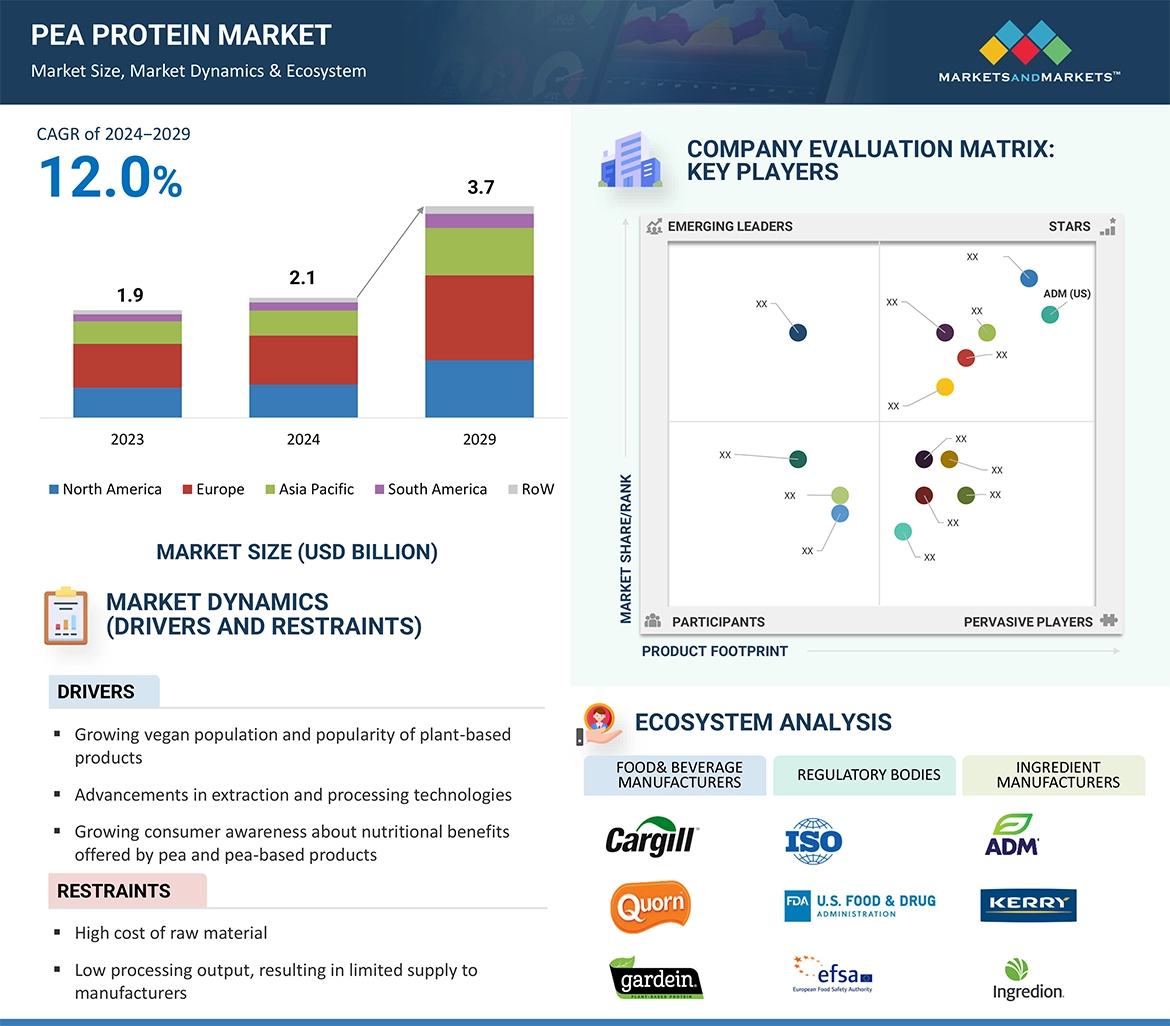
Pea protein is a vegetable protein with a neutral taste derived from different pea types such as chickpeas, yellow peas, lentils, and beans. It is produced as isolates, concentrated, and textured proteins and is highly nutritious. Pea protein is considered vegan and is not classified as a major allergen. Therefore, it is suitable for consumption for a wider consumer base. Pea protein also has a well-maintained amino acid profile and features high solubility and low viscosity, which add to its nutritional value.
Pea proteins can be used in various applications, including performance nutrition, bakery products, snack bars, beverages, meat alternatives, and dairy alternatives.
Key Stakeholders
-
Food manufacturers
-
Meat alternative manufacturers
-
Dairy alternative manufacturers
-
Sports nutrition manufacturers
-
Food importers and exporters
-
Intermediary suppliers include traders and distributors of plant-based sources such as soy, pea, corn, chia, and flax.
-
Government and research organizations
-
Associations and industry bodies:
-
Food and Agriculture Organization (FAO)
-
United States Department of Agriculture (USDA)
-
European Food Safety Authority (EFSA)
-
European Association of Specialty Feed Ingredients and their Mixtures (FEFANA)
-
Organization for Economic Co-operation and Development (OECD)
-
Venture capitalists and investors
Report Objectives
Market Intelligence
-
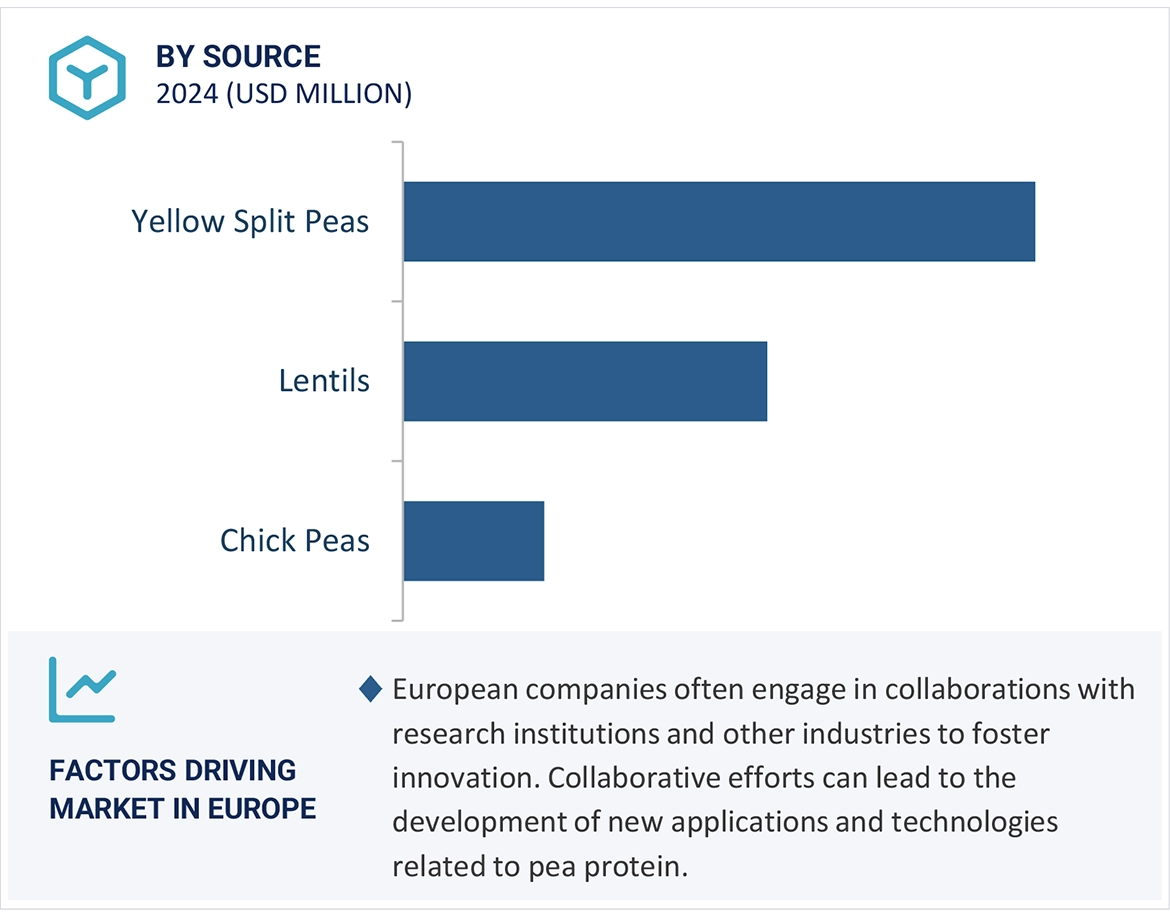
To determine and project the size of the pea protein market by source, type, application, form, and region over five years, ranging from 2024 to 2029.
-
To identify attractive opportunities in the market by determining the largest and fastest-growing segments across regions.
-
To analyze the demand-side factors based on the following:
-
Impact of macro and microeconomic factors on the market.
-
Shifts in demand patterns across different subsegments and regions.
-
To recognize the key drivers and restraints impacting the global pea protein market.
Competitive Intelligence
-
To profile the key players of the pea protein market and comprehensively analyze their market positions and core competencies
-
To provide a comparative analysis of the market leaders based on the following:
-
Product offerings
-
Business strategies
-
Strengths, weaknesses, opportunities, and threats
-
Key financials
-
To understand the competitive landscape and identify the major growth strategies adopted by players across the key regions
-
To provide insights on the key investments in product innovations and patent registrations
Available Customizations:
With the given market data, MarketsandMarkets offers customizations according to company-specific scientific needs.
The following customization options are available for the report:
Product Analysis
-
Product Matrix, which gives a detailed comparison of the product portfolio of each company.
Geographic Analysis
With the given market data, MarketsandMarkets offers customizations according to company-specific scientific needs.
-
Further breakdown of the Rest of European pea protein market, by key country
-
Further breakdown of the Rest of the South American pea protein market, by key country
-
Further breakdown of the Rest of Asia Pacific pea protein market, by key country
Company Information
-
Detailed analyses and profiling of additional market players


Growth opportunities and latent adjacency in Pea Protein Market