The study involved five major segments in estimating the current size of the protein hydrolysates market. Exhaustive secondary research was done to collect information on the market, peer, and parent markets. The next step was to validate these findings, assumptions, and sizing with industry experts across the value chain through primary research. Both top-down and bottom-up approaches were employed to estimate the complete market size. After that, market breakdown and data triangulation were used to estimate the market size of segments and subsegments.
Secondary Research
This research study involved the extensive use of secondary sources—directories and databases such as Bloomberg Businessweek and Factiva—to identify and collect information useful for a technical, market-oriented, and commercial study of the protein hydrolysates market.
In the secondary research process, various sources such as annual reports, press releases & investor presentations of companies, white papers, food journals, certified publications, articles from recognized authors, directories, and databases, were referred to identify and collect information.
Secondary research was mainly used to obtain key information about the industry’s supply chain, the total pool of key players, and market classification and segmentation as per the industry trends to the bottom-most level, regional markets, and key developments from both market- and technology-oriented perspectives.
Primary Research
Extensive primary research was conducted after obtaining information regarding the protein hydrolysates market scenario through secondary research. Several primary interviews were conducted with market experts from both the demand and supply sides across major countries of North America, Europe, Asia Pacific, South America, and the Rest of the World. Primary data was collected through questionnaires, emails, and telephonic interviews. The primary sources from the supply side included various industry experts, such as Chief X Officers (CXOs), Vice Presidents (VPs), Directors, from business development, marketing, research, and development teams, and related key executives from distributors, and key opinion leaders. Primary interviews were conducted to gather insights such as market statistics, data on revenue collected from the products and services, market breakdowns, market size estimations, market forecasting, and data triangulation. Primary research also helped in understanding the various trends related to protein hydrolysates, product type, application, source, process, form and region. Stakeholders from the demand side, such as processed food and functional food products manufacturers who manufacture the protein products were interviewed to understand the buyer’s perspective on the suppliers, products, and their current usage of hydrolyzed protein and the outlook of their business which will affect the overall market.

|
COMPANY NAME
|
designation
|
|
Cargill Incorporated (US)
|
General Manager
|
|
ADM (US)
|
Sales Manager
|
|
Arla Foods amba (Denmark)
|
Manager
|
|
Azelis Group (Belgium)
|
Head of processing department
|
|
Tatua (New Zealand)
|
Marketing Manager
|
|
FrieslandCampina (Netherlands)
|
Sales Executive
|
|
Hofseth BioCare ASA (Norway)
|
Head - Research & Development
|
|
Kerry Group PLC (Ireland)
|
Manager
|
Market Size Estimation
Both the top-down and bottom-up approaches were used to estimate and validate the total size of the protein hydrolysates market. These approaches were also used extensively to determine the size of various subsegments in the market. The research methodology used to estimate the market size includes the following details:
-
The key players in the industry and the overall markets were identified through extensive secondary research.
-
All shares, splits, and breakdowns were determined using secondary sources and verified through primary sources.
-
All possible parameters that affect the market covered in this research study were accounted for, viewed in extensive detail, verified through primary research, and analyzed to obtain final quantitative and qualitative data.
-
The research included the study of reports, reviews, and newsletters of top market players, along with extensive interviews for opinions from leaders, such as CEOs, directors, and marketing executives.
Global Protein Hydrolysates Market: Bottom-Up Approach

To know about the assumptions considered for the study, Request for Free Sample Report
Global Protein Hydrolysates Market: Top-Down Approach

Data Triangulation
After arriving at the overall market size from the estimation process explained above, the total market was split into several segments and subsegments. Data triangulation and market breakdown procedures were employed to estimate the protein hydrolysates market and arrive at the exact statistics for all segments and subsegments. The data was triangulated by studying numerous factors and trends from the demand and supply sides. The market size was also validated using both the top-down and bottom-up approaches.
Market Definition
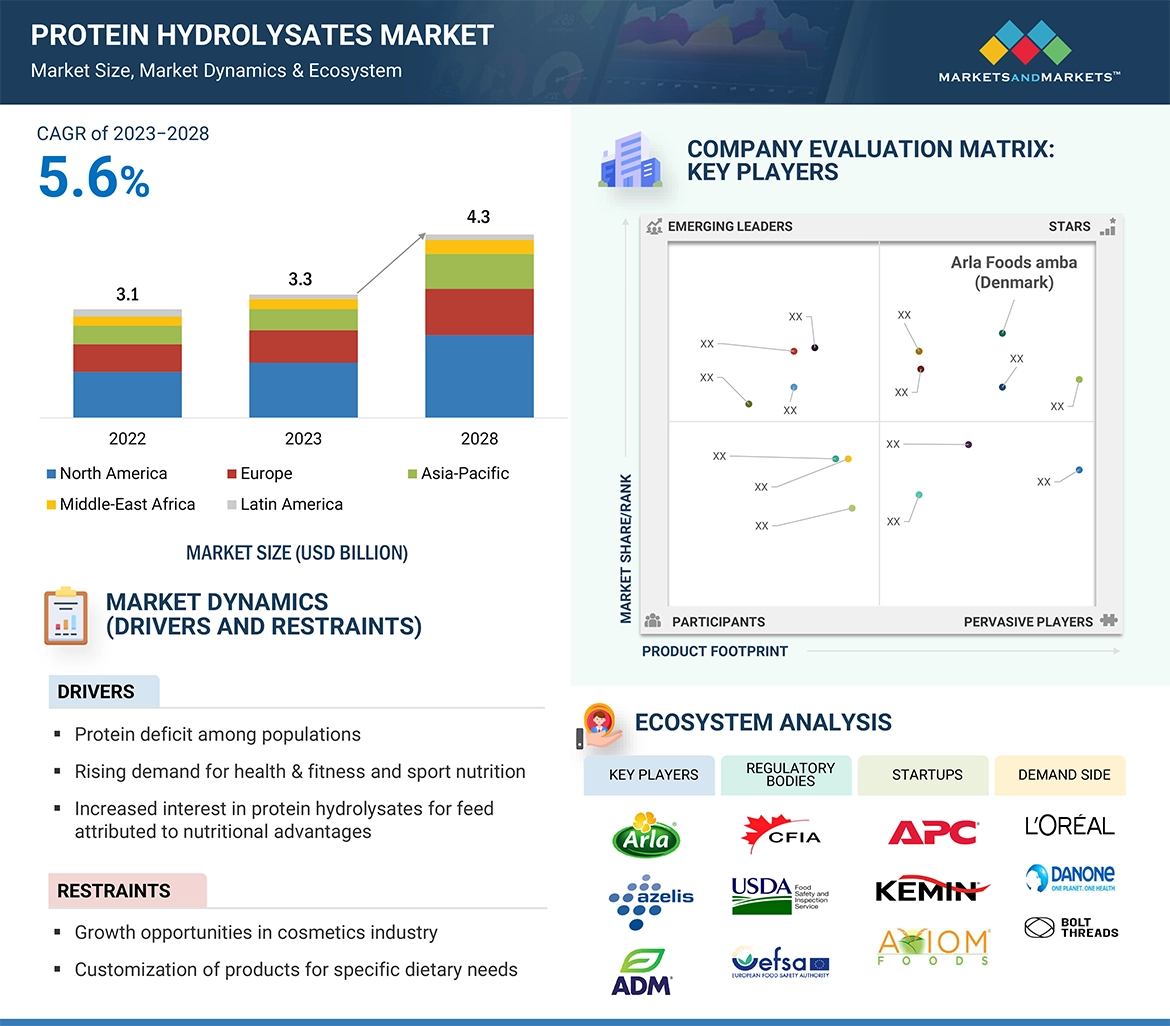
Protein hydrolysates are a mixture of amino acids obtained by the hydrolysis process from various sources, namely, animals, plants, and microbes. They are primarily used in nutritional products, including infant nutrition, weight management, and animal feed.
In the hydrolysis process, protein hydrolysates are broken down into smaller fragments called peptides, which are easily absorbed by the body. They are hence also known as a pre-digested form of protein.
Apart from protein, there are several instant protein hydrolysates which also contain vitamins and minerals. Protein hydrolysates are also used as a flavor enhancing agent in food and feed.
Definition of protein by regulatory bodies or associations:
According to the FDA, “Protein is important for growth and development, and is also one of three macronutrients in food that provide calories, or "energy" for the body.”
According to the FAO, “Proteins are complex, organic compounds composed of many amino acids linked together through peptide bonds and cross-linked between chains by sulfhydryl bonds, hydrogen bonds, and van der Waals forces. There is a greater diversity of chemical composition in proteins than in any other group of biologically active compounds. The proteins in various animal and plant cells confer on these tissues their biological specificity.”
Definition of hydrolyzed foods by regulatory bodies or associations:
-
According to the FDA, “A hydrolyzed food is one in which a food’s chemical components—such as proteins—are broken into smaller organic compounds by reaction with water. These reactions are often accelerated by enzymes. Examples of hydrolyzed foods include hydrolyzed soy protein and hydrolyzed wheat protein.
Key Stakeholders
-
Protein hydrolysates manufacturers
-
Protein hydrolysates importers and exporters
-
Protein hydrolysates traders, distributors, and suppliers
-
Raw material producers, suppliers, processors, and grain distillers
-
Food additive manufacturers, importers, and exporters
-
Food associations of several countries
-
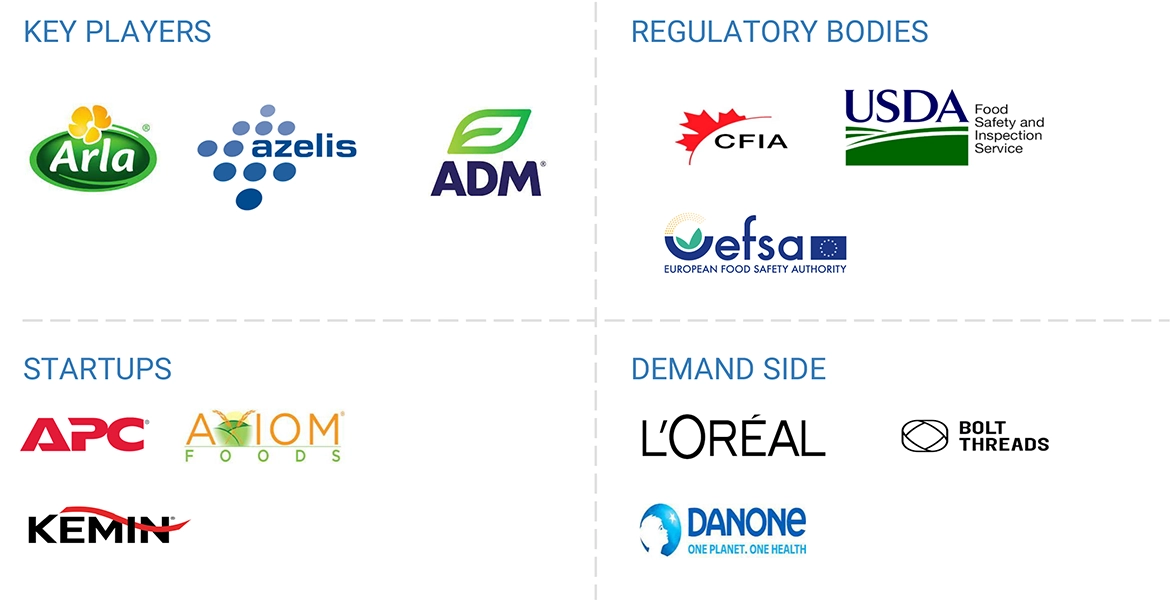
Research organizations and associations such as Food and Agriculture Organization (FAO), Food and Drug Administration (FDA), European Animal Protein Association (EAPA), Food Standards Australia New Zealand (FSANZ), European Food Safety Authority (EFSA), and United States Department of Agriculture (USDA)
-
Regulatory bodies such as
-
US Food and Drug Administration (FDA)
-
European Commission (EC)
-
United States Department of Agriculture (USDA)
-
Commercial research & development (R&D) institutions and financial institutions
-
Food and Agriculture Organization (FAO)
-
Intermediary suppliers such as wholesalers and dealers
Report Objectives
-
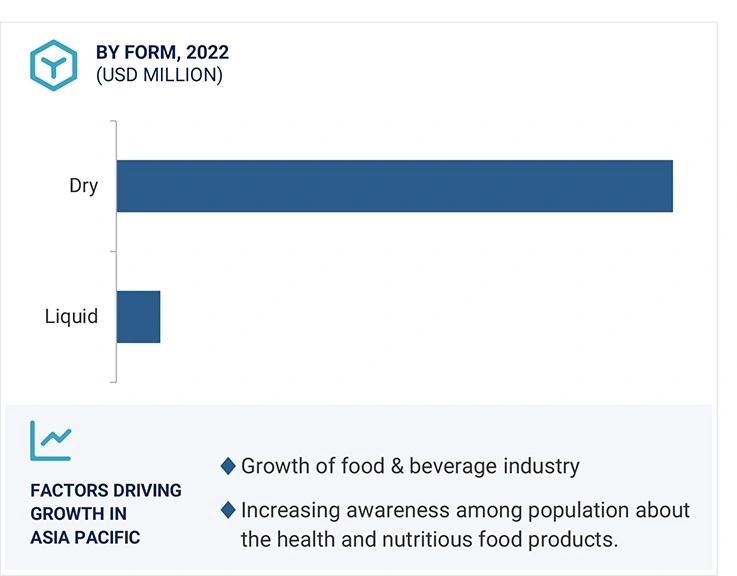
To determine and project the size of the protein hydrolysates market with respect to the product type, applications, sources, process, form, and region in terms of value and volume over five years, ranging from 2023 to 2028.
-
To identify the attractive opportunities in the market by determining the largest and fastest-growing segments across regions
-
To provide detailed information about the key factors influencing market growth (drivers, restraints, opportunities, and challenges)
-
To analyze the opportunities in the market for stakeholders and provide details of the competitive landscape for market leaders.
-
To analyze the micro-markets with respect to individual growth trends, prospects, and their contribution to the total market.
-
To identify and profile the key players in the protein hydrolysates market.
-
To understand the competitive landscape and identify the major growth strategies adopted by players across the key regions.
-
To provide insights on key product innovations and investments in the protein hydrolysates market.
Available Customizations:
With the given market data, MarketsandMarkets offers customizations according to company-specific scientific needs.
The following customization options are available for the report:
Product Analysis
-
Product Matrix, which gives a detailed comparison of the product portfolio of each company.
Geographic Analysis
With the given market data, MarketsandMarkets offers customizations according to company-specific scientific needs.
-
Further breakdown of the European protein hydrolysates market into its key countries.
-
Further breakdown of the Rest of Asia Pacific protein hydrolysates market into its key countries.
Company Information
-
Detailed analyses and profiling of additional market players (up to five)


Growth opportunities and latent adjacency in Protein Hydrolysates Market