Infant Formula Ingredients Market by Ingredient Type (Carbohydrates, Oils & Fats, Proteins, Vitamins, Minerals, Prebiotics), Application (Growing-up Milk, Standard Infant Formula, Follow-on Formula, Specialty), Form, Source, Region-Global Forecast to 2025


The global infant formula ingredients market by size was estimated at USD 16.7 billion in 2019 and anticipated to hit USD 25.5 billion by 2025, growing at a CAGR of 7.3% during the forecast period. Infant formula ingredients are used in the production of safe and highly nutritious formula solutions that facilitate growth and development in infants.
Various ingredients used in infant formulas include carbohydrates, proteins, vitamins, minerals, oils & fats, and prebiotics. These ingredients are available in powdered and liquid & semi-liquid forms. Infant formula is made from industrially modified cow milk or other plant-based sources, such as soy, for infants having allergy issues with cow milk. It is intended to be used as a substitute for breast milk; it is formulated by manufacturers to mimic the nutritional composition of breast milk for normal infant growth and development. However, contamination of infant formula with harmful ingredients is witnessed in both developed and developing regions. Infant formulas often contain small ingredients known as nanoparticles, which pose a threat to human health.

To know about the assumptions considered for the study, Request for Free Sample Report
Infant Formula Ingredients Market Growth Dynamics
Drivers: Extensive R&D by companies operating in the infant formula ingredients market
Manufacturers involved in the infant formula ingredients market are consistently engaged in R&D to develop ingredients as per consumer expectations. In 2019, Nestlé (Switzerland) opened a new R&D center in Ireland. The company made an investment of USD 30.0 million for the same. The center will focus on developing products for infant nutrition. Arla Foods amba (Denmark) invested USD 0.66 million for a project focusing on infant formula. The project aimed at investigating whether a diet with bioactive milk ingredients protects against gut inflammation, which is of huge relevance to improve infant formula. BASF (Germany) and GlycoSyn (US) formed a partnership with a focus on the area of infant nutrition. It involved the development and commercialization of human milk oligosaccharides (HMOs). In 2019, BASF launched its first HMO, PREBILAC 2’-FL, for the infant nutrition market. Thus, the infant formula ingredients market is highly competitive, with a large number of key players involved. Most of these players are expanding their customer base, owing to its increased demand from various countries.
Restraints: Strict regulations for infant formulas in China
In 2008, melamine, an industrial chemical used for making plastic, was found in infant formulas in China. Melamine has a higher protein content but can cause kidney stones. It was found in over 22 Chinese dairy companies. It was reported that over 300,000 babies were sick and caused a few fatalities in the same year. This led to a distrust for local manufacturers among consumers in the country and affected the sales of domestic manufacturers since then. Post this incident, a constant reform is being made for the supervision of the infant formula industry. The country has tightened its infant formula registration process. This is expected to create a hindrance for international players to penetrate the local market in the years to come.
Opportunities: Shift in preference for plant-based infant formula ingredients
The expanding infant formula market has led to increased demand for innovative plant-based infant formulas. Many vegan and vegetarian communities opting for plant-based alternatives are extending their diets to their babies as well, creating a lucrative opportunity for plant-based infant formula manufacturers. For example, soy-based protein infant formulas are known for their high-protein content and used for non-dairy infant formula products, providing a suitable alternative to lactose-intolerant babies. For infants with soy allergies, Israel-based Else Nutrition (Israel) is developing 100% plant-based dairy and soy-free infant formula using almonds and buckwheat. Another alternative for both soy and dairy allergenic infants are lentils. Lentil-based formulas are expected to serve as a suitable alternative, owing to their high protein content and amino acid profile. PROTEIN2FOOD (Denmark) formed a partnership with Fraunhofer Institute to develop a model infant formula prototype (in powder form) with a well-balanced protein (amino acid) profile. Thus, plant-based infant formula ingredients stand high-growth prospects in the years to come.
Challenges: Cases of contamination found in infant formulas
In the past, traces of melamine were found in infant formulas in China and the US. This has negatively affected the growth prospects of the infant formula ingredients market. In another incident, in 2018, a Slovenian consumer found dead insects in Danone’s infant formula. The Ministry of Health in Slovenia recalled the affected batch from stores across the country. The agency advised consumers who had purchased the product not to use it and to return it to the seller or discard it. In another incident, in Singapore, the Agri-Food and Veterinary Authority (AVA) of Singapore detected Cronobacter sakazakii bacteria in the samples of Dumex Mamil Gold Infant Milk Formula. Cronobacter sakazakii is a bacterium found in the environment; it can survive dry conditions, such as in food like infant formula and powdered milk. It is known to cause meningitis or sepsis in newborns.
Scope of the Report
|
Report Attributes |
Details |
| Estimated Value | USD 16.7 billion |
| Projected Value | USD 25.5 billion |
| Market size estimation | 2019–2025 |
| Base year considered | 2018 |
| Forecast period considered | 2019–2025 |
| Units considered | Value (USD) |
| Segments Covered |
|
| Regions covered |
|
| Companies studied |
Arla Foods Amba, Vitablend Nederland B.V., Carbery Food Ingredients Limited, Fonterra Co-Operative Group Limited, Aarhuskarlshamn AB, Royal Frieslandcampina N.V., Sachsenmilch Leppersdorf GmbH, BASF SE, Koninklijke DSM N.V., Chr. Hansen Holding A/S, Glanbia PLC, Kerry Group PLC |
Fats & Oils are One of the Key Ingredients required for the Growth of Infants
Fats & oils are one of the key ingredients required for the growth of infants, as they meet the need for high energy and also help in a wide range of metabolic and physiological functions critical to the development, growth, and health of infants. The composition of lipid content in breast milk varies with the lactation and diet of the mother; however, the lipid composition in infant formula varies in accordance with a blend of various sources of fats. The composition of saturated fatty acids and unsaturated fatty acids varies largely in infant formulas and breast milk.
A mixture of vegetable oils is the most widely used fat source in infant formulas. Formulas containing dairy fats were used traditionally; although this trend is presently followed in some countries, their use is not encouraged in most parts of the world. Other lipid sources used in infant formulas include single-cell oils, esterified structured lipids, fractionated lipids, polar lipids, fish oils, and egg phospholipids.
Liquid & Semi-Liquid Infant Formula Ingredients are used in making Liquid Concentrates and Ready-to-Feed Infant Formulas
Liquid & semi-liquid infant formula ingredients are used in infant formulas that are produced using wet blending or offered as liquid concentrates and ready-to-feed infant formulas. Fats & oils and some of the micronutrients are mostly used liquid & semi-liquid ingredients in the manufacturing of infant formulas. In wet blending, ingredients are homogenized in a liquid solution or added in a liquid form; they are then spray-dried to obtain the final infant formula product. They are also converted to liquid concentrates and ready-to-feed formulas and sold in the market. In the Asia Pacific region, Japan remains a key revenue generator, as consumers in the country opt for liquid formulas, owing to frequent cases of natural disasters in the country, making the liquid form a convenient option.
Protein Hydrolysates are used by Babies who are Allergic to Proteins that are Found in Cow-Based Formulas
Infant formula ingredients based on protein hydrolysates, the protein is broken down partially or extensively into smaller sizes, which aids babies during digestion. These are mainly useful for babies who are intolerant to both cow’s milk and soy-based formulas. Extensively hydrolyzed formulas are an option for babies who are allergic to normal proteins that are found in cow-based formulas. These ingredients can either be obtained through plant-based or animal-based sources. Whey protein hydrolysate formulas are becoming increasingly popular among users and many manufacturers. Some of the protein hydrolyzed-based infant formula products include Enfamil Gentlease and Similac Sensitive, which are partially hydrolyzed. The milk proteins in these formulas are partially broken down, which caters to infants who are highly sensitive to both cow’s milk and soy.
Suitable for Low Birth Weight Infants and in Cases Where Mother’s Milk cannot be Fed
The inability of mothers to lactate, making it a suitable recommended alternative. Standard infant formulas are given to infants between 0 and 6 months of age. It is also known as stage 1 milk formula and first infant milk formula. In the first six months of an infant’s life, it is recommended that mothers breastfeed their babies, as breast milk has nutritional elements and antibodies that are required for infant nutrition. However, where breastfeeding is not feasible or insufficient, feeding infants with formula milk offers a great alternative. Usually, a formula based on cow’s milk is recommended, as it has ingredients similar to that of human milk. Other formulas, such as soy protein-based, hydrolyzed protein-based, and amino acid-based formulas are also preferred based on the nutritional requirements of infants. Also, the World Health Organization (WHO) recommends standard infant formula for low-birth-weight infants, in cases where mother’s milk cannot be fed. Thus, standard formula serves as a suitable alternative, and its sales are expected to boost in the years to come.
The Asia Pacific region is projected to witness the highest growth rate in the infant formula ingredients market, with a value of USD 9.1 billion in 2019; it is projected to reach USD 15.4 billion by 2025, at a CAGR of 9.1% during the forecast period.
China has dominated the market in the region, as it is one of the largest consumers of infant formulas in the world, and hence, any market fluctuation in China is expected to significantly affect the global infant formulas market, which will, in turn, consequently, affect the infant formula ingredients market. As the government in China has started easing its stand on the one-child policy and is allowing couples to have two children, the market is expected to grow with the increase in the number of newborn infants. The country is a significant importer of international infant formula products, especially from New Zealand and Australia; the high demand for infant formulas in China has forced global manufacturers, such as Fonterra Co-operative Group (New Zealand), to increase their production of ingredients as well as expand their geographic reach in the Chinese market.
In terms of imports of infant formulas, New Zealand is one of the major exporters of infant formulas to China, which generates high revenue for the country; hence, the market of infant formula ingredients is projected to witness substantial growth during the forecast period.

To know about the assumptions considered for the study, download the pdf brochure
Infant Formula Ingredients Market Key Players
The key players in this market include Vitablend Nederland B.V. (Netherlands), Carbery Food Ingredients (Ireland), AAK AB (Sweden), Sachsenmilch Leppersdorf GMBH (Germany), BASF SE (Germany), Koninklijke DSM N.V. (Netherlands), Hilmar Ingredients (US), and Lactalis Ingredients (France).
Impact of COVID-19
COVID-19 will have positive and negative impacts on the overall infant formula ingredients market. The sales of processed and packaged foods have increased as consumers rush to stock their pantries. It is expected that the COVID-19 pandemic will increase the consumption of processed foods and other shelf-stable foods that have a longer shelf-life. Furthermore, with the shutdown of various foodservice outlets and restaurants across the globe due to nationwide lockdown, consumers are compelled to cook at home. Hence, consumers are stockpiling food products that can be easily cooked and opt for ready-to-eat foods with longer shelf life. Owing to this, it is expected to have a positive impact on the processed and packaged food industry.
Recent Developments
- In May 2019, AAK AB increased its stake in its joint venture with Kamani Oil industries to 64%; through this, the company wants to strengthen its position in the Indian market.
- In May 2019, FrieslandCampina Ingredients incorporated its four individual operating companies—DOMO, Kievit, DMV, and Nutrifeed. This marks the company’s evolution to a unique position in value-added, healthy, and functional ingredients and solutions for infant formula development
- In September 2018, Arla Foods amba acquired Yeo Valleys Dairies Limited to strengthen its branded organic food ingredients business in the UK.
- In January 2018, Fonterra Co-operative Group Limited formed a partnership with Hema Fresh, which is Alibaba’s new retail space. The partnership would help the company to expand its presence in the retail market for infant formula ingredients.
Frequently Asked Questions (FAQ):
Which region is projected to account for the largest share in the infant formula ingredients market?
Asia Pacific dominated the infant formula ingredients market, with a value of USD 9.1 billion in 2019; it is projected to reach USD 15.4 billion by 2025, at a CAGR of 9.1% during the forecast period. Australia has a strong export market for infant formulas (mainly to China) while India is expected to witness increasing consumption of infant formulas. With the relaxation of the one-child policy, China is expected to be a major consumer of infant formulas.
How big is the global infant formula ingredients market?
The global infant formula ingredients market is estimated to be valued at USD 16.7 billion in 2019. It is projected to reach USD 25.2 billion by 2025, recording a CAGR of 7.3% during the forecast period.
Which are the key players in the market, and how intense is the competition?
Majority of the emerging players in the infant formula ingredients market have niche product offerings and are still carving their position in the market. When compared to other players, they do not have very strong business strategies or product portfolios. They are constantly seeking to tap into the opportunities in the market. Vitalus Nutrition (Canada), Danisco A/S (Denmark), Erie Foods International (US), and Stephan Company (US) are some of the emerging companies. .
To speak to our analyst for a discussion on the above findings, click Speak to Analyst
 Exclusive indicates content/data unique to MarketsandMarkets and not available with any competitors.
Table of Contents
1 Introduction (Page No. - 20)
1.1 Objectives of the Study
1.2 Market Definition
1.3 Market Segmentation
1.3.1 Regions Covered
1.3.2 Periodization Considered
1.4 Currency Considered
1.5 Stakeholders
2 Research Methodology (Page No. - 24)
2.1 Research Data
2.1.1 Secondary Data
2.1.1.1 Key Data From Secondary Sources
2.1.2 Primary Data
2.1.2.1 Key Data From Primary Sources
2.1.2.2 Breakdown of Primaries
2.2 Market Size Estimation
2.2.1 Bottom-Up Approach
2.2.2 Top-Down Approach
2.3 Data Triangulation
2.4 Assumptions for the Study
2.5 Limitations of the Study
3 Executive Summary (Page No. - 31)
4 Premium Insights (Page No. - 37)
4.1 Attractive Opportunities in the Global Market
4.2 Infant Formula Ingredients Market, By Region, 2019 vs 2025
4.3 Infant Formula Ingredient Market, By Ingredient, 2019 vs 2025
4.4 Infant Formula Ingredient Market, By Source, 2019 vs 2025
4.5 Asia Pacific: Infant Formula Ingredients Market, By Application and Country, 2018
4.6 Market, By Form, 2019 vs 2025
4.7 Market For Infant Formula Ingredients, By Region, 2019 vs 2025
5 Market Overview (Page No. - 41)
5.1 Introduction
5.2 Market Dynamics
5.2.1 Drivers
5.2.1.1 Asia Pacific: A Key Revenue Generator in the Years to Come
5.2.1.2 Rise in the Infant Population
5.2.1.3 Extensive R&D By Companies Operating in the Infant Formula Ingredients Market
5.2.2 Restraints
5.2.2.1 Strict Regulations for Infant Formulas in China
5.2.3 Opportunities
5.2.3.1 Shift in Preference for Plant-Based Infant Formula Ingredients
5.2.3.2 Alternate Animal Milk Sources Coming Up in the Market
5.2.4 Challenges
5.2.4.1 Cases of Contamination Found in Infant Formulas
5.3 Value Chain Analysis
6 Infant Formula Ingredients Market, By Ingredient (Page No. - 47)
6.1 Introduction
6.2 Carbohydrates
6.2.1 Lactose is the Preferred Carbohydrate Ingredient Used in Infant Formula
6.3 Fats & Oils
6.3.1 Fats & Oils are One of the Key Ingredients Required for the Growth of Infants
6.4 Proteins
6.4.1 Whey Proteins
6.4.2 Casein Proteins
6.4.3 Plant Proteins
6.5 Vitamins
6.5.1 Infant Formulas are Fortified With Vitamins to Match the Vitamin Content Found in Human Milk
6.6 Minerals
6.6.1 Minerals are Used in Infant Formulas to Provide Enhanced Nutrition to Infants
6.7 Prebiotics
6.7.1 Human Milk Oligosaccharides-Based Prebiotic Ingredients are Being Increasingly Used in Infant Formula
6.8 Others
6.8.1 Demand for Infant Formulas With Enhanced Nutritional Values is Growing
7 Infant Formula Ingredients Market, By Form (Page No. - 59)
7.1 Introduction
7.2 Powder
7.2.1 Powder Form of Infant Formula Ingredients are the Most Convenient to Use
7.3 Liquid & Semi-Liquid
7.3.1 Liquid & Semi-Liquid Infant Formula Ingredients are Used in Making Liquid Concentrates and Ready-To-Feed Infant Formulas
8 Infant Formula Ingredient Market, By Source (Page No. - 64)
8.1 Introduction
8.2 Cow Milk
8.2.1 Cow Milk-Based Ingredients are Widely Used in the Manufacturing of Infant Formulas
8.3 Soy
8.3.1 Soy-Based Ingredients are Preferred By Lactose Intolerant Infants
8.4 Protein Hydrolysates
8.4.1 Protein Hydrolysates are Used By Babies Who are Allergic to Proteins That are Found in Cow-Based Formulas
8.5 Other Sources
8.5.1 Demand for Goat Milk- and Camel Milk-Based Sources of Infant Formula Ingredients is Increasing
9 Infant Formula Ingredients Market, By Application (Page No. - 71)
9.1 Introduction
9.2 Growing-Up Milk
9.2.1 Growing-Up Milk is the Most Commonly Used Application
9.3 Standard Infant Formula
9.3.1 Suitable for Low Birth Weight Infants and in Cases Where Mother’s Milk Cannot Be Fed
9.4 Follow-On Formula
9.4.1 Follow-On Formulas have Higher Concentration Levels of Phosphorus and Calcium
9.5 Specialty Formula
9.5.1 Suited for Premature Infants and Infants With Disorders Associated With Amino Acid Metabolism
10 Infant Formula Ingredients Market, By Region (Page No. - 79)
10.1 Introduction
10.2 North America
10.2.1 US
10.2.1.1 Increased Demand From End-User Companies Such as Nestlé S.A. (Switzerland) and Danone S.A. (France)
10.2.2 Canada
10.2.2.1 Demand for Organic Infant Formulas Expected to Play A Key Role
10.2.3 Mexico
10.2.3.1 Rise in Income Levels Expected to Boost the Sales of Infant Formulas, and Ultimately, of Infant Formula Ingredients
10.3 Asia Pacific
10.3.1 China
10.3.1.1 Large Number of Infant Formula Ingredient Manufacturers are Exporting Their Products to China
10.3.2 Japan
10.3.2.1 Liquid Infant Formulas are Gaining Popularity in Japan
10.3.3 South Korea
10.3.3.1 South Korean Infant Formula Ingredients Market is Dominated By Domestic Manufacturers
10.3.4 Australia & New Zealand
10.3.4.1 Infant Formula Ingredients Market in Australia & New Zealand is Driven By End-User Demand in China
10.3.5 Vietnam
10.3.5.1 Human Milk Oligosaccharides-Based Ingredients are Being Preferred By Infant Formula Manufacturers
10.3.6 Indonesia
10.3.6.1 Multinational Companies Such as Nestle and Danone are Dominating the Indonesian Infant Formula Market
10.3.7 Rest of Asia Pacific
10.3.7.1 Favorable Export Market and Improving Economic Condition are Expected to Drive the Market
10.4 Europe
10.4.1 UK
10.4.1.1 Rise in Demand From End-User Companies Such as Nestlé S.A. (Switzerland) and Danone S.A. (France)
10.4.2 Germany
10.4.2.1 The Demand for Infant Formulas From China is Expected to Boost the Sales of Infant Formula Ingredients in the Coming Years
10.4.3 France
10.4.3.1 Increase in Export Opportunities in China and Other Developing and Developed Countries at A Global Level
10.4.4 Netherlands
10.4.4.1 Presence of Key Players Operating in the Infant Formula Ingredients Market Operating in the Country
10.4.5 Turkey
10.4.5.1 Rise in Demand on the Domestic Front Expected to Create Lucrative Opportunities for Infant Formula Ingredient Manufacturers
10.4.6 Rest of Europe
10.4.6.1 Countries in This Region are Expected to Be Key Revenue Generators in the Years to Come
10.5 Rest of the World
10.5.1 South America
10.5.1.1 Powdered Infant Formulas are Gaining Popularity Due to Their Ease of Use
10.5.2 Middle East & Africa
10.5.2.1 Huge-Growth Potential for Organic Infant Formula Ingredients in the Middle East
11 Competitive Landscape (Page No. - 135)
11.1 Overview
11.2 Competitive Leadership Mapping (Overall Market)
11.2.1 Terminology/Nomenclature
11.2.1.1 Visionary Leaders
11.2.1.2 Innovators
11.2.1.3 Dynamic Differentiators
11.2.1.4 Emerging Companies
11.3 Strength of Product Portfolio
11.4 Business Strategy Excellence
11.5 Ranking of Key Players, 2018
11.6 Competitive Scenario
11.6.1 New Product Launches
11.6.2 Expansions & Investments
11.6.3 Mergers & Acquisitions
11.6.4 Agreements, Joint Ventures, and Partnerships
11.7 Competitive Leadership Mapping (Start-Ups/SMEs)
11.7.1 Progressive Companies
11.7.2 Emerging Companies
11.7.3 Responsive Companies
11.7.4 Dynamic Companies
12 Company Profiles (Page No. - 146)
(Business Overview, Products Offered, Recent Developments, SWOT Analysis, MnM View)*
12.1 Arla Foods Amba
12.2 Vitablend Nederland B.V.
12.3 Carbery Food Ingredients Limited
12.4 Fonterra Co-Operative Group Limited
12.5 Aarhuskarlshamn AB
12.6 Royal Frieslandcampina N.V.
12.7 Sachsenmilch Leppersdorf GmbH
12.8 BASF SE
12.9 Koninklijke DSM N.V.
12.10 Chr. Hansen Holding A/S
12.11 Glanbia PLC
12.12 Kerry Group PLC
*Details on Business Overview, Products Offered, Recent Developments, SWOT Analysis, MnM View Might Not Be Captured in Case of Unlisted Companies.
13 Appendix (Page No. - 180)
13.1 Discussion Guide
13.2 Knowledge Store: Marketsandmarkets’ Subscription Portal
13.3 Available Customizations
13.4 Related Reports
13.5 Author Details
List of Tables (165 Tables)
Table 1 US Dollar Exchange Rates Considered, 2015–2018
Table 2 Market Snapshot, 2019 vs 2025
Table 3 Market Size For Infant Formula Ingredients, By Ingredient, 2017–2025 (USD Million)
Table 4 Market Size For Infant Formula Ingredients, By Ingredient, 2017–2025 (KT)
Table 5 Carbohydrate Content in Infant Formula
Table 6 Infant Formula Ingredients Market Size for Carbohydrates, By Region, 2017–2025 (USD Million)
Table 7 Market Size for Carbohydrates, By Region, 2017–2025 (KT)
Table 8 Market Size for Fats & Oils, By Region, 2017–2025 (USD Million)
Table 9 Market Size for Fats & Oils, By Region, 2017–2025 (KT)
Table 10 Market Size for Proteins, By Region, 2017–2025 (USD Million)
Table 11 Infant Formula Ingredients Market Size for Proteins, By Region, 2017–2025 (KT)
Table 12 Infant Formula Ingredients Market Size for Proteins, By Subtype, 2017–2025 (USD Million)
Table 13 Infant Formula Ingredients Market Size for Proteins, By Subtype, 2017–2025 (KT)
Table 14 Market Size for Vitamins, By Region, 2017–2025 (USD Million)
Table 15 Market Size for Vitamins, By Region, 2017–2025 (KT)
Table 16 Market Size for Minerals, By Region, 2017–2025 (USD Million)
Table 17 Market Size for Minerals, By Region, 2017–2025 (KT)
Table 18 Market Size for Prebiotics, By Region, 2017–2025 (USD Million)
Table 19 Market Size for Prebiotics, By Region, 2017–2025 (KT)
Table 20 Market Size for Other Types, By Region, 2017–2025 (USD Million)
Table 21 Market Size for Other Types, By Region, 2017–2025 (KT)
Table 22 Market Size, By Form, 2017–2025 (USD Billion)
Table 23 Market Size, By Form, 2017–2025 (KT)
Table 24 Market Size for the Powder Form, By Region, 2017–2025 (USD Million)
Table 25 Market Size for the Powder Form, By Region, 2017–2025 (KT)
Table 26 Market Size for the Liquid & Semi-Liquid Form, By Region, 2017–2025 (USD Million)
Table 27 Market Size for the Liquid & Semi-Liquid Form, By Region, 2017–2025 (KT)
Table 28 Infant Formula Ingredients Market Size, By Source, 2017–2025 (USD Million)
Table 29 Infant Formula Ingredients Market Size, By Source, 2017–2025 (KT)
Table 30 Market Size for Cow Milk, By Region, 2017–2025 (USD Million)
Table 31 Market Size for Cow Milk, By Region, 2017–2025 (KT)
Table 32 Market Size for Soy, By Region, 2017–2025 (USD Million)
Table 33 Market Size for Soy, By Region, 2017–2025 (KT)
Table 34 Market Size for Protein Hydrolysates, By Region, 2017–2025 (USD Million)
Table 35 Market Size for Protein Hydrolysates, By Region, 2017–2025 (KT)
Table 36 Infant Formula Ingredients Market Size for Other Sources, By Region, 2017–2025 (USD Million)
Table 37 Infant Formula Ingredients Market Size for Other Sources, By Region, 2017–2025 (KT)
Table 38 Infant Formula Ingredients Market Size, By Application, 2017–2025 (USD Billion)
Table 39 Infant Formula Ingredients Market Size, By Application, 2017–2025 (KT)
Table 40 Market Size for Growing-Up Milk, By Region, 2017–2025 (USD Million)
Table 41 Market Size for Growing-Up Milk, By Region, 2017–2025 (KT)
Table 42 Market Size for Standard Infant Formula, By Region, 2017–2025 (USD Million)
Table 43 Market Size for Standard Infant Formula, By Region, 2017–2025 (KT)
Table 44 Market Size for Follow-On Formula, By Region, 2017–2025 (USD Million)
Table 45 Market Size for Follow-On Formula, By Region, 2017–2025 (KT)
Table 46 Market Size for Specialty Formula, By Region, 2017–2025 (USD Million)
Table 47 Market Size for Specialty Formula, By Region, 2017–2025 (KT)
Table 48 Market Size, By Region, 2017–2025 (USD Billion)
Table 49 Infant Formula Ingredients Market Size, By Region, 2017–2025 (KT)
Table 50 North America: Market Size For Infant Formula Ingredients, By Country, 2017–2025 (USD Million)
Table 51 Infant Formula Ingredients North America: Market Size, By Country, 2017–2025 (KT)
Table 52 Infant Formula Ingredients North America: Market Size, By Ingredient, 2017–2025 (USD Million)
Table 53 Infant Formula Ingredients North America: Market Size, By Ingredient, 2017–2025 (KT)
Table 54 Infant Formula Ingredients North America: Market Size, By Source, 2017–2025 (USD Million)
Table 55 North America: Market Size, By Source, 2017–2025 (KT)
Table 56 North America: Market Size, By Form, 2017–2025 (USD Million)
Table 57 North America: Market Size, By Form, 2017–2025 (KT)
Table 58 North America: Market Size, By Application, 2017–2025 (USD Million)
Table 59 North America: Market Size, By Application, 2017–2025 (KT)
Table 60 US: Infant Formula Ingredients Market Size, By Form, 2017–2025 (USD Million)
Table 61 US: Market Size, By Form, 2017–2025 (KT)
Table 62 US: Market Size, By Application, 2017–2025 (USD Million)
Table 63 US: Infant Formula Ingredients Market Size, By Application, 2017–2025 (KT)
Table 64 Canada: Market Size For Infant Formula Ingredients, By Form, 2017–2025 (USD Million)
Table 65 Canada: Market Size, By Form, 2017–2025 (KT)
Table 66 Canada: Market Size, By Application, 2017–2025 (USD Million)
Table 67 Canada: Market Size, By Application, 2017–2025 (KT)
Table 68 Mexico: Market Size For Infant Formula Ingredients, By Form, 2017–2025 (USD Million)
Table 69 Mexico: Market Size, By Form, 2017–2025 (KT)
Table 70 Mexico: Market Size, By Application, 2017–2025 (USD Million)
Table 71 Mexico: Market Size, By Application, 2017–2025 (KT)
Table 72 Asia Pacific: Infant Formula Ingredients Market Size, By Country/Region, 2017–2025 (USD Million)
Table 73 Asia Pacific: Market Size, By Country/Region, 2017–2025 (KT)
Table 74 Asia Pacific: Infant Formula Ingredients Market Size, By Ingredient, 2017–2025 (USD Million)
Table 75 Asia Pacific: Infant Formula Ingredients Market Size, By Ingredient, 2017–2025 (KT)
Table 76 Asia Pacific: Market Size, By Form, 2017–2025 (USD Million)
Table 77 Asia Pacific: Infant Formula Ingredients Market Size, By Form, 2017–2025 (KT)
Table 78 Asia Pacific: Market Size, By Source, 2017–2025 (USD Million)
Table 79 Asia Pacific: Market Size, By Source, 2017–2025 (KT)
Table 80 Asia Pacific: Market Size, By Application, 2017–2025 (USD Million)
Table 81 Asia Pacific: Market Size, By Application, 2017–2025 (KT)
Table 82 China: Market Size For Infant Formula Ingredients, By Application, 2017–2025 (USD Million)
Table 83 China: Market Size, By Application, 2017–2025 (KT)
Table 84 China: Market Size, By Form, 2017–2025 (USD Million)
Table 85 China: Market Size, By Form, 2017–2025 (KT)
Table 86 Japan: Market Size For Infant Formula Ingredients, By Application, 2017–2025 (USD Million)
Table 87 Japan: Market Size, By Application, 2017–2025 (KT)
Table 88 Japan: Infant Formula Ingredients Market Size, By Form, 2017–2025 (USD Million)
Table 89 Japan: Market Size, By Form, 2017–2025 (KT)
Table 90 South Korea: Infant Formula Ingredients Market Size, By Application, 2017–2025 (USD Million)
Table 91 South Korea: Market Size, By Application, 2017–2025 (KT)
Table 92 South Korea: Market Size, By Form, 2017–2025 (USD Million)
Table 93 South Korea: Market Size, By Form, 2017–2025 (KT)
Table 94 Australia & New Zealand: Market Size, By Application, 2017–2025 (USD Million)
Table 95 Australia & New Zealand: Market Size, By Application, 2017–2025 (KT)
Table 96 Australia & New Zealand: Market Size, By Form, 2017–2025 (USD Million)
Table 97 Australia & New Zealand: Market Size, By Form, 2017–2025 (KT)
Table 98 Vietnam: Market Size For Infant Formula Ingredients, By Application, 2017–2025 (USD Million)
Table 99 Vietnam: Market Size, By Application, 2017–2025 (KT)
Table 100 Vietnam: Market Size, By Form, 2017–2025 (USD Million)
Table 101 Vietnam: Infant Formula Ingredients Market Size, By Form, 2017–2025 (KT)
Table 102 Indonesia: Infant Formula Ingredients Market Size, By Application, 2017–2025 (USD Million)
Table 103 Indonesia: Market Size, By Application, 2017–2025 (KT)
Table 104 Indonesia: Market Size, By Form, 2017–2025 (USD Million)
Table 105 Indonesia: Market Size, By Form, 2017–2025 (KT)
Table 106 Rest of Asia Pacific: Market Size, By Application, 2017–2025 (USD Million)
Table 107 Rest of Asia Pacific: Market Size, By Application, 2017–2025 (KT)
Table 108 Rest of Asia Pacific: Market Size, By Form, 2017–2025 (USD Million)
Table 109 Rest of Asia Pacific: Market Size, By Form, 2017–2025 (KT)
Table 110 Europe: Market Size For Infant Formula Ingredients, By Country, 2017–2025 (USD Million)
Table 111 Europe: Market Size, By Country, 2017–2025 (KT)
Table 112 Europe: Market Size, By Ingredient, 2017–2025 (USD Million)
Table 113 Europe: Market Size, By Ingredient, 2017–2025 (KT)
Table 114 Europe: Market Size, By Source, 2017–2025 (USD Million)
Table 115 Europe: Infant Formula Ingredients Market Size, By Source, 2017–2025 (KT)
Table 116 Europe: Infant Formula Ingredients Market Size, By Form, 2017–2025 (USD Million)
Table 117 Europe: Market Size, By Form, 2017–2025 (KT)
Table 118 Europe: Market Size, By Application, 2017–2025 (USD Million)
Table 119 Europe: Market Size, By Application, 2017–2025 (KT)
Table 120 UK: Infant Formula Ingredients Market Size, By Form, 2017–2025 (USD Million)
Table 121 UK: Market Size, By Form, 2017–2025 (KT)
Table 122 UK: Market Size, By Application, 2017–2025 (USD Million)
Table 123 UK: Market Size, By Application, 2017–2025 (KT)
Table 124 Germany: Market Size For Infant Formula Ingredients, By Form, 2017–2025 (USD Million)
Table 125 Germany: Market Size, By Form, 2017–2025 (KT)
Table 126 Germany: Infant Formula Ingredients Market Size, By Application, 2017–2025 (USD Million)
Table 127 Germany: Market Size, By Application, 2017–2025 (KT)
Table 128 France: Market Size For Infant Formula Ingredients, By Form, 2017–2025 (USD Million)
Table 129 France: Market Size, By Form, 2017–2025 (KT)
Table 130 France: Infant Formula Ingredients Market Size, By Application, 2017–2025 (USD Million)
Table 131 France: Market Size, By Application, 2017–2025 (KT)
Table 132 Netherlands: Market Size For Infant Formula Ingredients, By Form, 2017–2025 (USD Million)
Table 133 Netherlands: Market Size, By Form, 2017–2025 (KT)
Table 134 Netherlands: Market Size, By Application, 2017–2025 (USD Million)
Table 135 Netherlands: Infant Formula Ingredients Market Size, By Application, 2017–2025 (KT)
Table 136 Turkey: Market Size For Infant Formula Ingredients, By Form, 2017–2025 (USD Million)
Table 137 Turkey: Market Size, By Form, 2017–2025 (KT)
Table 138 Turkey: Market Size, By Application, 2017–2025 (USD Million)
Table 139 Turkey: Market Size, By Application, 2017–2025 (KT)
Table 140 Rest of Europe: Market Size For Infant Formula Ingredients, By Form, 2017–2025 (USD Million)
Table 141 Rest of Europe: Market Size, By Form, 2017–2025 (KT)
Table 142 Rest of Europe: Market Size, By Application, 2017–2025 (USD Million)
Table 143 Rest of Europe:Market Size, By Application, 2017–2025 (KT)
Table 144 RoW: Infant Formula Ingredients Market Size, By Region, 2017–2025 (USD Million)
Table 145 RoW: Market Size, By Region, 2017–2025 (KT)
Table 146 RoW: Infant Formula Ingredients Market Size, By Ingredient, 2017–2025 (USD Million)
Table 147 RoW: Infant Formula Ingredients Market Size, By Ingredient, 2017–2025 (KT)
Table 148 RoW: Infant Formula Ingredients Market Size, By Form, 2017–2025 (USD Million)
Table 149 RoW: Market Size, By Form, 2017–2025 (KT)
Table 150 RoW: Market Size, By Source, 2017–2025 (USD Million)
Table 151 RoW: Market Size, By Source, 2017–2025 (KT)
Table 152 RoW: Market Size, By Application, 2017–2025 (USD Million)
Table 153 RoW: Market Size, By Application, 2017–2025 (KT)
Table 154 South America: Market Size For Infant Formula Ingredients, By Application, 2017–2025 (USD Million)
Table 155 South America: Market Size, By Application, 2017–2025 (KT)
Table 156 South America: Market Size, By Form, 2017–2025 (USD Million)
Table 157 South America: Infant Formula Ingredients Market Size, By Form, 2017–2025 (KT)
Table 158 Middle East & Africa: Market Size For Infant Formula Ingredients, By Application, 2017–2025 (USD Million)
Table 159 Middle East & Africa: Market Size, By Application, 2017–2025 (KT)
Table 160 Middle East & Africa: Market Size, By Form, 2017–2025 (USD Million)
Table 161 Middle East & Africa: Market Size, By Form, 2017–2025 (KT)
Table 162 New Product Launches
Table 163 Expansions & Investments
Table 164 Mergers & Acquisitions
Table 165 Agreements, Joint Ventures, and Partnerships
List of Figures (41 Figures)
Figure 1 Research Design
Figure 2 Data Triangulation Methodology
Figure 3 Infant Formula Ingredients Market Size, By Ingredient, 2019 vs 2025 (USD Million)
Figure 4 Infant Formula Ingredients Market Size, By Source, 2019 vs 2025 (USD Million)
Figure 5 Infant Formula Ingredients Market Size, By Form, 2019 vs 2025 (USD Million)
Figure 6 Infant Formula Ingredients Market Share & Growth (Value), By Region
Figure 7 Infant Formula Ingredients: an Emerging Market With Promising Growth Potential
Figure 8 Asia Pacific is Projected to Dominate the Global Market From 2019 to 2025
Figure 9 The Fats & Oils Segment is Projected to Account for the Largest Share From 2019 to 2025
Figure 10 The Cow Milk Segment is Projected to Account for the Largest Share From 2019 to 2025
Figure 11 The Growing-Up Milk Segment Accounted for the Largest Share of the Asia Pacific Infant Formula Ingredients Market in 2018
Figure 12 The Powder Segment is Estimated to Dominate the Market in 2019
Figure 13 China, Turkey, and Japan are Projected to Grow at High CAGRs During the Forecast Period, in Terms of Value
Figure 14 Infant Formula Consumption, By Region, 2015
Figure 15 Infant Formula Ingredients Market: Drivers, Restraints, Opportunities, and Challenges
Figure 16 Infant Formula Imports By China, By Country of Origin, 2016
Figure 17 Value Chain Analysis of Infant Formula Ingredients: Major Value is Added During the Manufacturing Stage
Figure 18 Infant Formula Ingredients Market, By Ingredient, 2019 vs 2025 (USD Million)
Figure 19 Market Size, By Form, 2019 vs 2025 (USD Billion)
Figure 20 Market Size, By Source, 2019 vs 2025 (USD Million)
Figure 21 Market Size, By Application, 2019 vs 2025 (USD Billion)
Figure 22 Geographic Snapshot (2019–2025): Rapidly Growing Markets in Asia Pacific Emerging as the New Hotspots
Figure 23 Asia Pacific is Projected to Dominate the Global Market By 2025
Figure 24 North America: Market Snapshot
Figure 25 Asia Pacific: Market Snapshot
Figure 26 Europe: Market Snapshot
Figure 27 Key Developments of the Leading Players in the Market, 2014–2019
Figure 28 Infant Formula Ingredients – Large Players: Competitive Leadership Mapping, 2018
Figure 29 BASF SE Led the Infant Formula Ingredients Market in Terms of Rank in 2018
Figure 30 Infant Formula Ingredients Market Evaluation Framework, 2017–2019
Figure 31 Infant Formula Ingredients – Start-Ups/SMEs: Competitive Leadership Mapping, 2018
Figure 32 Arla Foods Amba: Company Snapshot
Figure 33 Carbery Food Ingredients Limited: Company Snapshot
Figure 34 Fonterra Co-Operative Group Limited: Company Snapshot
Figure 35 Aarhuskarlshamn AB: Company Snapshot
Figure 36 Royal Frieslandcampina N.V.: Company Snapshot
Figure 37 BASF SE: Company Snapshot
Figure 38 Koninklijke DSM N.V.: Company Snapshot
Figure 39 Chr. Hansen Holding A/S: Company Snapshot
Figure 40 Glanbia PLC: Company Snapshot
Figure 41 Kerry Group PLC: Company Snapshot
The study involves four major activities to estimate the current infant formula ingredients market size. Exhaustive secondary research was conducted to collect information on the market, peer market, and parent market. These findings, assumptions, and market size were validated with industry experts across the value chain through primary research. Both the top-down and bottom-up approaches were employed to estimate the complete market size. After that, the market breakdown and data triangulation were used to estimate the market size of segments and subsegments.
Secondary Research
In the secondary research process, various secondary sources such as Hoovers, Bloomberg BusinessWeek, and Dun & Bradstreet were referred to, to identify and collect information for this study. These secondary sources included annual reports, press releases & investor presentations of companies, white papers, certified publications, articles by recognized authors, gold standard & silver standard websites, food safety organizations, regulatory bodies, trade directories, and databases.
Primary Research
The global market comprises several stakeholders such as manufacturers of infant formula ingredients, suppliers of raw materials, manufacturers of infant formula ingredients, Infant Nutrition Council (INC), International Special Dietary Foods Industries (ISDI), government & research organizations, and industry bodies. The demand-side of this market is characterized by the rising demand for from various end-use industries such as automotive, aerospace & defense, electrical & electronics, industrial machinery, medical device, and construction. The supply-side is characterized by advancements in technology and diverse application industries. Various primary sources from both the supply and demand sides of the market were interviewed to obtain qualitative and quantitative information.
Following is the breakdown of the primary respondents:
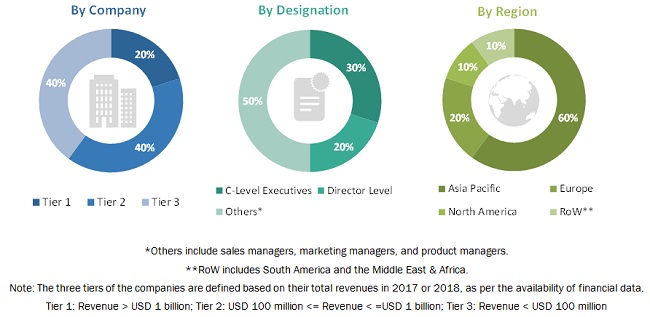
To know about the assumptions considered for the study, download the pdf brochure
Infant Formula Ingredients Market Size Estimation
Both the top-down and bottom-up approaches were used to estimate and validate the total size of the market. These methods were also used extensively to estimate the size of various subsegments in the market. The research methodology used to estimate the market size includes the following:
- The key players in the industry and markets were identified through extensive secondary research.
- The industry’s supply chain and market size, in terms of value and volume, were determined through primary and secondary research processes.
- All percentage shares, splits, and breakdowns were determined using secondary sources and verified through primary respondents
Data Triangulation
After arriving at the overall market size—using the market size estimation processes, as explained above—the market was split into several segments and subsegments. To complete the overall market engineering process and arrive at the exact statistics of each market segment and subsegment, the data triangulation and market breakdown procedures were employed. The data was triangulated by studying various factors and trends from both the demand and supply sides.
Report Objectives
- To define, segment, and project the global size for the infant formula ingredients market
- To understand the structure of the global infant formula ingredients market by identifying its various subsegments
- To provide detailed information about the key factors influencing the growth of the infant formula ingredients market (drivers, restraints, opportunities, and industry-specific challenges)
- To analyze the micro-markets, with respect to individual growth trends, future prospects, and their contribution to the total infant formula ingredients market
- To project the size of the infant formula ingredients market and its submarkets, in terms of value and volume, with respect to the regions (along with their respective key countries)
- To profile the key players and comprehensively analyze their core competencies
- To understand the competitive landscape and identify the major growth strategies adopted by the players across key regions
- To analyze the competitive developments such as expansions and investments, mergers & acquisitions, new product launches, partnerships, joint ventures, and agreements
Available Customizations
Based on the given market data, MarketsandMarkets offers customizations in the reports as per client-specific requirements. The available customization options are as follows:
Regional Analysis
- Further breakdown of the Rest of Asia Pacific infant formula ingredients market, by country
- Further breakdown of other Rest of Europe infant formula ingredients market, by country
- Further breakdown of other Rest of the World infant formula ingredients market, by country
Company Information
- Detailed analysis and profiling of additional market players (up to five)


Growth opportunities and latent adjacency in Infant Formula Ingredients Market