Silicon Nitride Market by Type (Reaction Bonded Silicon Nitride, Hot Pressed Silicon Nitride, Sintered Silicon Nitride), End-use Industry (Photovoltaic, Automotive, General Industrial, Aerospace, Medical), and Region - Global Forecast to 2023


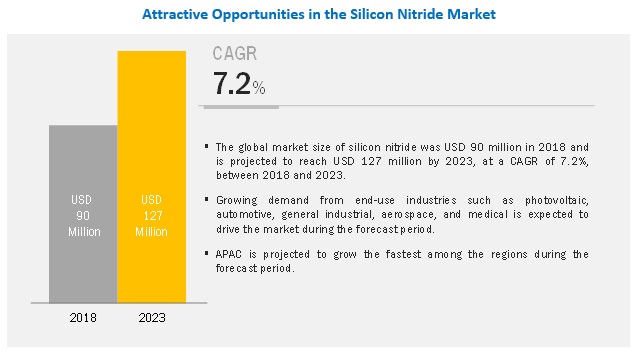
The silicon nitride market is projected to reach USD 127 million by 2023, at a CAGR of 7.2%. Silicon nitride (Si3N4) is an inorganic, non-metallic compound of silicon and nitrogen. It is used as a ceramic material. It offers excellent resistance against abrasion, corrosion, and most chemicals. Among the advanced ceramics, silicon nitride has the highest fracture resistance than other advanced ceramic. Hence, these desirable properties make silicon nitride a suitable material for use in end-use industries such as solar photovoltaic, automotive, general industrial, aerospace, and medical among.
Medical is projected to be the fastest-growing end-use industry during the forecast period.
In the medical industry, silicon nitride is used as a material for manufacturing surgical screws, plates, and bearings for use in applications such as prosthetic hips, knee joints, and dental implants. Silicon nitride composites are also used in cervical spacers and spinal fusion devices. It is biocompatible, bioactive, bacterial resistant, and shows excellent bone affinity.
Also, silicon nitride can provide an exceptionally smooth and wear-resistant surface for applications, such as bearings for hip and knee replacements in the medical industry. The market for silicon nitride in the medical industry is in the nascent stage and is expected to grow the fastest in the coming years.
Sintered silicon nitride (SSN) is projected to be the largest segment of the silicon nitride market during the forecast period.
SSN exhibits properties such as high-temperature strength, superior thermal shock resistance, creep resistance, good fracture toughness, oxidation resistance, and excellent wear resistance. SSN is used in applications such as components in glow plugs in diesel engines, pre-combustion chambers, turbochargers, rocker arm pads in spark ignition engines, and components in exhaust gas control valves.
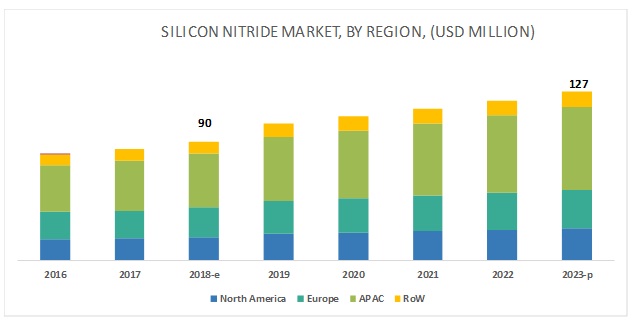
APAC is projected to be the largest market during the forecast period.
APAC is the largest silicon nitride market, and this trend is expected to continue until 2023. China accounted for the largest market in the region, followed by Japan, South Korea, and India in the year 2017. China is also projected to grow the fastest, in terms of consumption, between 2018 and 2023. There is an increase in the consumption of silicon nitride in the automotive industry. Growing innovation and the rising demand for improved products in the end-use industries are driving the use of silicon nitride in the region.
Key Market Players in Silicon Nitride Market
The leading silicon nitride powder manufacturers are UBE (Japan), Denka (Japan), AlzChem (Germany), H.C. Starck (Germany), Yantai Tomley Hi-Tech Advanced Materials Co. Ltd (China), and Vesta Si (Sweden). The leading players for the fabrication of silicon nitride are 3M (US), CeramTec (Germany), Kyocera Fine Ceramics (Japan), Morgan Advanced Ceramics (UK), Toshiba (Japan), Rogers Corporation (US), and CoorsTek (US). These players adopted expansions, acquisitions, new product launches, and agreements as their key growth strategies from 2014 to 2018, which helped them increase their capacities and cater to the widening customer base.
Denka is one of the leading industry players in the silicon nitride market. The company is involved in the manufacturing of silicon nitride powders and is also the largest manufacturer of silicon nitride substrates. It has its presence in APAC, North America, the Middle East & Africa, and Europe.
UBE Industries was established in 1897 and headquartered in Tokyo, Japan. The company manufactures different grades of silicon nitride that cater to the needs of end-use industries such as automotive, aerospace, and electronics as well as custom coating requirements. The company generates a major share of its revenue from Japan and has its presence in Europe, North America, and Asia.
AlzChem was established in 2006 and is headquartered in Trostberg, Germany. The silicon nitride manufactured by the company is used in applications such as manufacturing of bearings, cutting tools, high endurance ceramic parts for the automotive industry, heater plugs, sealing, components for generators, and thermal shock resistant elements for application in the aerospace industry. The company has its presence in 70 countries across Europe, Asia, North America, and the rest of the world.
Silicon Nitride Market Report Scope
|
Report Metric |
Details |
|
Years considered for the study |
2016–2023 |
|
Base year |
2017 |
|
Forecast period |
2018–2023 |
|
Units considered |
Value (USD Thousand and Million) and Volume (Ton) |
|
Segments |
Type, End-use industry, and Region |
|
Regions |
North America, APAC, Europe, and RoW |
|
Companies profiled |
UBE (Japan), Denka (Japan), AlzChem (Germany), H.C. Starck (Germany), Yantai Tomley Hi-Tech Advanced Materials Co. Ltd (China), Vesta Si (Sweden), 3M (US), CeramTec (Germany), Kyocera Fine Ceramics (Japan), Morgan Advanced Ceramics (UK), Toshiba (Japan), Rogers Corporation (US), and CoorsTek (US). |
This research report categorizes the global silicon nitride market on the basis of type, end-use industry, and region.
On the basis of type:
- Reaction bonded silicon nitride (RBSN)
- Hot pressed silicon nitride (HPSN)
- Sintered silicon nitride (SSN)
On the basis of end-use industry:
- Photovoltaic
- Automotive
- General industrial
- Aerospace
- Medical
- Others
On the basis of region:
- North America
- Europe
- APAC
- RoW
The market is further analyzed for the key countries in each of these regions.
Recent Developments
- In January 2019, Denka has planned to make an investment for the expansion of its silicon nitride ceramic substrates manufacturing by three folds. The expansion helps the company cater to the demand for silicon nitride in automotive applications. The plant is expected to be operational by 2020–21
- In February 2019, Kyocera planned to acquire H.C. Starck, which manufactures silicon nitride powder. The acquisition enables the company to integrate backward and strengthen the company across the silicon nitride value chain.
Key Questions Addressed by the Report
- What are the global demand trends for silicon nitride? Will the market witness an increase or decline in demand in the coming years?
- What is the estimated demand for silicon nitride? Which type is used the most in end-use industries?
- What were the revenue pockets for the silicon nitride market in 2017?
- What are the upcoming technologies/product areas that will have a significant impact on the market in the future?
- Who are the major silicon nitride manufacturers, globally?
Frequently Asked Questions (FAQ):
What are factors responsible for growth in silicon nitride market?
What are the different types for silicon nitride in the market?
Which major industries use silicon nitrides?
The major industries using silicon nitride include automotive, photovoltaic, general industry, aerospace, medical, and others.
What are the challenges faced by the silicon nitride industry?
Who are the major manufacturers?
What are the opportunities for silicon nitride market?
What is the future outlook of each segment?
To speak to our analyst for a discussion on the above findings, click Speak to Analyst
 Exclusive indicates content/data unique to MarketsandMarkets and not available with any competitors.
Table of Contents
1 Introduction (Page No. - 13)
1.1 Objectives of the Study
1.2 Market Definition
1.2.1 Silicon Nitride
1.3 Market Scope
1.3.1 Markets Covered
1.3.1.1 Silicon Nitride Market, By Region
1.3.2 Years Considered for the Study
1.4 Currency
1.5 Package Size
1.6 Limitations
1.7 Stakeholders
2 Research Methodology (Page No. - 16)
2.1 Research Data
2.1.1 Secondary Data
2.1.1.1 Key Data From Secondary Sources
2.1.2 Primary Data
2.1.2.1 Key Data From Primary Sources
2.1.2.2 Key Industry Insights
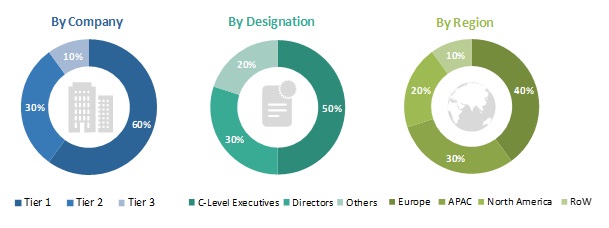
2.1.2.3 Breakdown of Primary Interviews
2.2 Market Size Estimation
2.2.1 Bottom-Up Approach
2.2.2 Top-Down Approach
2.3 Data Triangulation
2.4 Assumptions
3 Executive Summary (Page No. - 24)
4 Premium Insights (Page No. - 27)
4.1 Attractive Opportunities in the Silicon Nitride Market
4.2 Silicon Nitride Market, By Type
4.3 Silicon Nitride Market, By Country
5 Market Overview (Page No. - 29)
5.1 Introduction
5.2 Market Dynamics
5.2.1 Drivers
5.2.1.1 Use of Silicon Nitride as an Alternative in the End-Use Industries
5.2.2 Restraints
5.2.2.1 High Manufacturing Cost
5.2.3 Opportunities
5.2.3.1 Use of Silicon Nitride in the Medical Industry
5.2.3.2 Adoption of Electric and Hybrid Vehicles
5.2.4 Challenges
5.2.4.1 Decline in Fossil Fuel-Based Vehicles
5.2.4.2 Effect of Chinese Pv Market Impacting the Global Solar Photovoltaic Cell Manufacturing
5.3 Porter’s Five Forces Analysis
5.3.1 Bargaining Power of Suppliers
5.3.2 Threat of New Entrants
5.3.3 Threat of Substitutes
5.3.4 Bargaining Power of Buyers
5.3.5 Intensity of Competitive Rivalry
5.4 Macroeconomic Indicators
5.4.1 Growth of Electric Vehicles
5.4.2 Growth of the Photovoltaic Industry
6 Silicon Nitride Market, By Type (Page No. - 37)
6.1 Introduction
6.2 Reaction Bonded Silicon Nitride (RBSN)
6.2.1 Poor Mechanical Properties are Impacting the Market for RBSN
6.3 Hot Pressed Silicon Nitride (HPSN)
6.3.1 High Fabrication Cost is A Key Factor Hampering the Growth of This Silicon Nitride Type
6.4 Sintered Silicon Nitride (SSN)
6.4.1 Economical Fabrication Process is Driving the Usage of SSN in Various Applications
6.5 Others
7 Silicon Nitride Market, By End-Use Industry (Page No. - 43)
7.1 Introduction
7.2 Automotive
7.2.1 Increasing Focus on Electric & Hybrid Vehicles to Drive the Market for Silicon Nitride
7.3 Photovoltaic
7.3.1 Increasing Solar Panel Installations to Drive the Demand for Silicon Nitride in the Photovoltaic Industry
7.4 General Industry
7.4.1 Use of Silicon Nitride for Cutting and Tooling Applications to Drive the Market in General Industries
7.5 Aerospace
7.5.1 Need for High-Performance Materials for Applications With Extreme Operating Environments is Driving the Demand for Silicon Nitride in the Aerospace Industry
7.6 Medical
7.6.1 Excellent Biocompatibility of Silicon Nitride Makes It A Suitable Material for Use in Medical Implants
7.7 Others
8 Silicon Nitride Market, By Region (Page No. - 52)
8.1 Introduction
8.2 North America
8.2.1 US
8.2.1.1 Increasing Ev Sales and Rising Usage of Silicon Nitride in Medical Industry to Drive the Silicon Nitride Market in US
8.2.2 Canada
8.2.2.1 Increasing Exports of Solar Pv Cells is Driving the Demand for Silicon Nitride in Canada
8.2.3 Mexico
8.2.3.1 Investment in End-Use Industries Such as Solar Pv and Automotive is Expected to Drive the Market in Mexico
8.3 APAC
8.3.1 China
8.3.1.1 Governmental Policy to Influence the Growth of Silicon Nitride Market in China
8.3.2 Japan
8.3.2.1 Slow Growth in the Ev Sales and Competition From China’s Solar Pv Manufacturers to Impact the Silicon Nitride Market in Japan
8.3.3 South Korea
8.3.3.1 Government Initiatives to Boost the Consumption of Silicon Nitride in South Korea
8.3.4 India
8.3.4.1 Increasing Adoption of Ev to Drive the Market for Silicon Nitride in India
8.3.5 Rest of APAC
8.4 Europe
8.4.1 Germany
8.4.1.1 Growing Automotive Manufacturing to Drive the Market for Silicon Nitride in Germany
8.4.2 France
8.4.2.1 Increasing Orthopaedic Surgeries to Boost the Demand for Silicon Nitride in France
8.4.3 UK
8.4.3.1 Rising Pv Installations and Adoption of Evs to Drive the Consumption of Silicon Nitride in UK
8.4.4 Sweden
8.4.4.1 Adoption of New Swedish Car Policies to Drive the Demand for Silicon Nitride Market in Sweden
8.4.5 Rest of Europe
8.5 Rest of World (RoW)
9 Competitive Landscape (Page No. - 83)
9.1 Overview
9.2 Competitive Scenario
9.2.1 Expansions
9.2.2 New Product Launches
9.2.3 Mergers & Acquisitions
9.2.4 Agreements/Collaborations
10 Company Profiles (Page No. - 86)
(Business Overview, Products Offered, Recent Developments, SWOT Analysis, MnM View)*
10.1 Silicon Nitride Powder Manufacturers
10.1.1 UBE
10.1.2 Denka
10.1.3 Alzchem
10.1.4 H.C. Stark
10.1.5 Yantai Tomley Hi-Tech Advanced Materials
10.1.6 Vesta Si
10.2 Fabricators of Silicon Nitride
10.2.1 3M
10.2.2 Ceramtec
10.2.3 Kyocera Corporation
10.2.4 Morgan Advanced Materials
10.2.5 Toshiba
10.2.6 Rogers Corporation
10.2.7 Coorstek
*Details on Business Overview, Products Offered, Recent Developments, SWOT Analysis, MnM View Might Not Be Captured in Case of Unlisted Companies.
11 Appendix (Page No. - 104)
11.1 Discussion Guide
11.2 Knowledge Store: Marketsandmarkets Subscription Portal
11.3 Related Reports
11.4 Author Details
List of Tables (85 Tables)
Table 1 Global Ev Registrations (Units)
Table 2 Silicon Nitride Market Size, By Type, 2016–2023 (Ton)
Table 3 Silicon Nitride Market Size, By Type, 2016–2023 (USD Thousand)
Table 4 RBSN Market Size, By Region, 2016–2023 (Ton)
Table 5 RBSN Market Size, By Region, 2016–2023 (USD Thousand)
Table 6 HPSN Market Size, By Region, 2016–2023 (Ton)
Table 7 HPSN Market Size, By Region, 2016–2023 (USD Thousand)
Table 8 SSN Market Size, By Region, 2016–2023 (Ton)
Table 9 SSN Market Size, By Region, 2016–2023 (USD Thousand)
Table 10 Other Silicon Nitride Types Market Size, By Region, 2016–2023 (Ton)
Table 11 Other Silicon Nitride Types Market Size, By Region, 2016–2023 (USD Thousand)
Table 12 Silicon Nitride Market Size, By End-Use Industry, 2016–2023 (Ton)
Table 13 Silicon Nitride Market Size, By End-Use Industry, 2016–2023 (USD Thousand)
Table 14 Silicon Nitride Market Size in Automotive Industry, By Region, 2016–2023 (Ton)
Table 15 Silicon Nitride Market Size in Automotive Industry, By Region, 2016–2023 (USD Thousand)
Table 16 Silicon Nitride Market Size in Photovoltaic Industry, By Region, 2016–2023 (Ton)
Table 17 Silicon Nitride Market Size in Photovoltaic Industry, By Region, 2016–2023 (USD Thousand)
Table 18 Silicon Nitride Market Size in General Industry, By Region, 2016–2023 (Ton)
Table 19 Silicon Nitride Market Size in General Industry, By Region, 2016–2023 (USD Thousand)
Table 20 Silicon Nitride Market Size in Aerospace Industry, By Region, 2016–2023 (Ton)
Table 21 Silicon Nitride Market Size in Aerospace Industry, By Region, 2016–2023 (USD Thousand)
Table 22 Silicon Nitride Market Size in Medical Industry, By Region, 2016–2023 (Ton)
Table 23 Silicon Nitride Market Size in Medical Industry, By Region, 2016–2023 (USD Thousand)
Table 24 Silicon Nitride Market Size in Other End-Use Industries, By Region, 2016–2023 (Ton)
Table 25 Silicon Nitride Market Size in Other End-Use Industries, By Region, 2016–2023 (USD Thousand)
Table 26 Silicon Nitride Market Size, By Region, 2016–2023 (Ton)
Table 27 Silicon Nitride Market Size, By Region, 2016–2023 (USD Thousand)
Table 28 North America: Silicon Nitride Market Size, By Country, 2016–2023 (Ton)
Table 29 North America: Silicon Nitride Market Size, By Country, 2016–2023 (USD Thousand)
Table 30 North America: Silicon Nitride Market Size, By Type, 2016–2023 (Ton)
Table 31 North America: Silicon Nitride Market Size, By Type, 2016–2023 (USD Thousand)
Table 32 North America: Silicon Nitride Market Size, By End-Use Industry, 2016–2023 (Ton)
Table 33 North America: Silicon Nitride Market Size, By End-Use Industry, 2016–2023 (USD Thousand)
Table 34 US: Silicon Nitride Market Size, By End-Use Industry, 2016–2023 (Ton)
Table 35 US: Silicon Nitride Market Size, By End-Use Industry, 2016–2023 (USD Thousand)
Table 36 Canada: Silicon Nitride Market Size, By End-Use Industry, 2016–2023 (Ton)
Table 37 Canada: Silicon Nitride Market Size, By End-Use Industry, 2016–2023 (USD Thousand)
Table 38 Mexico: Silicon Nitride Market Size, By End-Use Industry, 2016–2023 (Ton)
Table 39 Mexico: Silicon Nitride Market Size, By End-Use Industry, 2016–2023 (USD Thousand)
Table 40 APAC: Silicon Nitride Market Size, By Country, 2016–2023 (Ton)
Table 41 APAC: Silicon Nitride Market Size, By Country, 2016–2023 (USD Thousand)
Table 42 APAC: Silicon Nitride Market Size, By Type, 2016–2023 (Ton)
Table 43 APAC: Silicon Nitride Market Size, By Type, 2016–2023 (USD Thousand)
Table 44 APAC: Silicon Nitride Market Size, By End-Use Industry, 2016–2023 (Ton)
Table 45 APAC: Silicon Nitride Market Size, By End-Use Industry, 2016–2023 (USD Thousand)
Table 46 China: Silicon Nitride Market Size, By End-Use Industry, 2016–2023 (Ton)
Table 47 China: Silicon Nitride Market Size, By End-Use Industry, 2016–2023 (USD Thousand)
Table 48 Japan: Silicon Nitride Market Size, By End-Use Industry, 2016–2023 (Ton)
Table 49 Japan: Silicon Nitride Market Size, By End-Use Industry, 2016–2023 (USD Thousand)
Table 50 South Korea: Silicon Nitride Market Size, By End-Use Industry, 2016–2023 (Ton)
Table 51 South Korea: Silicon Nitride Market Size, By End-Use Industry, 2016–2023 (USD Thousand)
Table 52 India: Silicon Nitride Market Size, By End-Use Industry, 2016–2023 (Ton)
Table 53 India: Silicon Nitride Market Size, By End-Use Industry, 2016–2023 (USD Thousand)
Table 54 Rest of APAC: Silicon Nitride Market Size, By End-Use Industry, 2016–2023 (Ton)
Table 55 Rest of APAC: Silicon Nitride Market Size, By End-Use Industry, 2016–2023 (USD Thousand)
Table 56 Europe: Silicon Nitride Market Size, By Country, 2016–2023 (Ton)
Table 57 Europe: Silicon Nitride Market Size, By Country, 2016–2023 (USD Thousand)
Table 58 Europe: Silicon Nitride Market Size, By End-Use Industry, 2016–2023 (Ton)
Table 59 Europe: Silicon Nitride Market Size, By End-Use Industry, 2016–2023 (USD Thousand)
Table 60 Europe: Silicon Nitride Market Size, By Type, 2016-2023 (Ton)
Table 61 Europe: Silicon Nitride Market Size, By Type, 2016-2023 (USD Thousand)
Table 62 Germany: Silicon Nitride Market Size, By End-Use Industry, 2016–2023 (Ton)
Table 63 Germany: Silicon Nitride Market Size, By End-Use Industry, 2016–2023 (USD Thousand)
Table 64 France: Silicon Nitride Market Size, By End-Use Industry, 2016–2023 (Ton)
Table 65 France: Silicon Nitride Market Size, By End-Use Industry, 2016–2023 (USD Thousand)
Table 66 UK: Silicon Nitride Market Size, By End-Use Industry, 2016–2023 (Ton)
Table 67 UK: Silicon Nitride Market Size, By End-Use Industry, 2016–2023 (USD Thousand)
Table 68 Sweden: Silicon Nitride Market Size, By End-Use Industry, 2016–2023 (Ton)
Table 69 Sweden: Silicon Nitride Market Size, By End-Use Industry, 2016–2023 (USD Thousand)
Table 70 Rest of Europe: Silicon Nitride Market Size, By End-Use Industry, 2016–2023 (Ton)
Table 71 Rest of Europe: Silicon Nitride Market Size, By End-Use Industry, 2016–2023 (USD Thousand)
Table 72 RoW: Silicon Nitride Market Size, By Region, 2016–2023 (Ton)
Table 73 RoW: Silicon Nitride Market Size, By Region, 2016–2023 (USD Thousand)
Table 74 RoW: Silicon Nitride Market Size, By Type, 2016-2023 (Ton)
Table 75 RoW: Silicon Nitride Market Size, By Type, 2016-2023 (USD Thousand)
Table 76 RoW: Silicon Nitride Market Size, By End-Use Industry, 2016–2023 (Ton)
Table 77 RoW: Silicon Nitride Market Size, By End-Use Industry, 2016–2023 (USD Thousand)
Table 78 South America: Silicon Nitride Market Size, By End-Use Industry, 2016–2023 (Ton)
Table 79 South America: Silicon Nitride Market Size, By End-Use Industry, 2016–2023 (USD Thousand)
Table 80 Middle East & Africa: Silicon Nitride Market Size, By End-Use Industry, 2016–2023 (Ton)
Table 81 Middle East & Africa: Silicon Nitride Market Size, By End-Use Industry, 2016–2023 (USD Thousand)
Table 82 Expansion, 2014–2019
Table 83 New Product Launches, 2014–2019
Table 84 Mergers & Acquisitions, 2014–2019
Table 85 Agreements/Collaborations, 2014–2019
List of Figures (34 Figures)
Figure 1 Silicon Nitride: Market Segmentation
Figure 2 Silicon Nitride Market: Research Design
Figure 3 Market Size Estimation: Bottom-Up Approach
Figure 4 Market Size Estimation: Top-Down Approach
Figure 5 Data Triangulation: Silicon Nitride
Figure 6 SSN Accounted for the Largest Share in the Silicon Nitride Market in 2017
Figure 7 Medical to Be the Fastest-Growing End-Use Industry OfSilicon Nitride Between 2018 and 2023
Figure 8 APAC to Be the Fastest-Growing Market for Silicon Nitride
Figure 9 Increasing Demand From APAC to Drive the Silicon Nitride Market
Figure 10 SSN By Type Segment and China Accounted for the Largest Share Inthe Silicon Nitride Market in APAC in 2017
Figure 11 China to Grow at the Highest Rate During the Forecast Period
Figure 12 Drivers, Restraints, Opportunities, and Challenges in the Silicon Nitride Market
Figure 13 Porter’s Five Forces Analysis
Figure 14 Cumulative Ev Car Sales By Country, 2018
Figure 15 Share of Top Solar Pv Markets, in Terms of Total Installed CAPACity By 2017
Figure 16 Sintered Silicon Nitride Accounted for the Largest Share in 2017
Figure 17 Photovoltaic Accounted for the Largest Share in the Silicon Nitride Market in 2017
Figure 18 APAC to Lead the Global Silicon Nitride Market
Figure 19 North America: Silicon Nitride Market Snapshot
Figure 20 APAC: Silicon Nitride Market Snapshot
Figure 21 Europe: Silicon Nitride Market Snapshot
Figure 22 Companies Adopted New Product Launch as the Key Growth Strategy Between 2014–2019
Figure 23 UBE: Company Snapshot
Figure 24 UBE: SWOT Analysis
Figure 25 Denka: Company Snapshot
Figure 26 Denka: SWOT Analysis
Figure 27 Alzchem: Company Snapshot
Figure 28 Alzchem: SWOT Analysis
Figure 29 3M: Company Snapshot
Figure 30 Ceramtec: Company Snapshot
Figure 31 Kyocera: Company Snapshot
Figure 32 Morgan Advanced Ceramics: Company Snapshot
Figure 33 Toshiba: Company Snapshot
Figure 34 Rogers Corporation: Company Snapshot
This study involved four major activities in estimating the current market size of silicon nitride. Exhaustive secondary research was carried out to collect information on the peer and parent markets. The next step was to validate these findings, assumptions, and sizing with industry experts across the value chain through primary research. Both top-down and bottom-up approaches were employed to estimate the overall market size. Thereafter, market breakdown and data triangulation were used to estimate the market size of segments and sub-segments.
Secondary Research
In the secondary research process, various sources such as annual reports, press releases, and investor presentations of companies; white papers; publications by recognized websites; and databases were referred to for identifying and collecting information. Secondary research was used to obtain key information about the supply chain of the industry, the total pool of key players, market classification, and segmentation according to the industry trends to the bottom-most level, regional markets, and key developments from both, the market- and technology-oriented perspectives.
Primary Research
The silicon market comprises several stakeholders such as raw material suppliers, processors, fabricators, end-product manufacturers, and regulatory organizations in the supply chain. The demand side of this market is characterized by the development of the automotive, photovoltaic, aerospace, general industrial, medical, and other industries. The supply side is characterized by advancements in technology and diverse end-use industries. Various primary sources from both, the supply and demand sides of the market were interviewed to obtain qualitative and quantitative information.
Following is the breakdown of primary respondents
To know about the assumptions considered for the study, download the pdf brochure
Market Size Estimation
Both top-down and bottom-up approaches were used to estimate and validate the size of the global silicon nitride market and to estimate the sizes of various other dependent submarkets. The research methodology used to estimate the market size includes the following:
- The key players in the industry were identified through extensive secondary research.
- The supply chain of the industry and market size, in terms of value and volume, were determined through primary and secondary research.
- All percentage shares were determined using secondary sources and verified through primary sources.
- All possible parameters that affect the markets covered in this research study were accounted for, viewed in extensive detail, verified through primary research, and analyzed to obtain the final quantitative and qualitative data.
- The research includes the study of reports, reviews, and newsletters of key industry players along with extensive interviews with key officials such as directors and marketing executives.
Data Triangulation
After arriving at the total market size through the estimation process, the overall market was split into several segments and sub-segments. The data triangulation and market breakdown procedures were employed, wherever applicable, to complete the overall market size estimation process and arrive at the exact statistics for all segments and sub-segments. The data was triangulated by studying various factors and trends from both, the demand and supply sides. In addition, the market size was validated by using the top-down and bottom-up approaches. Then, it was verified through primary interviews. Thus, for every data segment, there were three sources—top-down approach, bottom-up approach, and expert interviews. The data was assumed to be correct when the values arrived at from the three sources matched.
Objectives of the Study
- To define, describe, and forecast the size of the silicon nitride market, in terms of value and volume
- To provide detailed information regarding the significant factors (drivers, restraints, opportunities, and challenges) influencing the growth of the market
- To analyze and forecast the market size on the basis of type and end-use industry
- To forecast the market size of different segments with respect to four main regions, namely, North America, Europe, Asia Pacific (APAC), and Rest of the world (RoW)
- To analyze the opportunities in the market for stakeholders by identifying the high-growth segments of the market
- To analyze the competitive developments such as expansions, new product launches, and acquisitions
- To strategically profile the key players and comprehensively analyze their growth strategies
Available Customizations:
With the given market data, MarketsandMarkets offers customizations according to the company’s specific needs. The following customization options are available for the report:
Geographical Analysis:
- Country-level analysis of the global silicon nitride market
Company Information:
- Detailed analysis and profiles of additional market players
Product Analysis
- Product Matrix, which gives a detailed comparison of the product portfolio of each company


Growth opportunities and latent adjacency in Silicon Nitride Market