
Mining Automation Market Size, Share & Trends

Mining Automation Market Size, Share, Growth & Trends by Offering (Autonomous Hauling/Mining Trucks, Autonomous Drilling Rigs, Underground LHD Loaders, Tunneling Equipment, Smart Ventilation Systems), Software (Remote Monitoring, Asset Management System) - Global Forecast to 2030


MINING AUTOMATION MARKET SIZE, SHARE & TRENDS
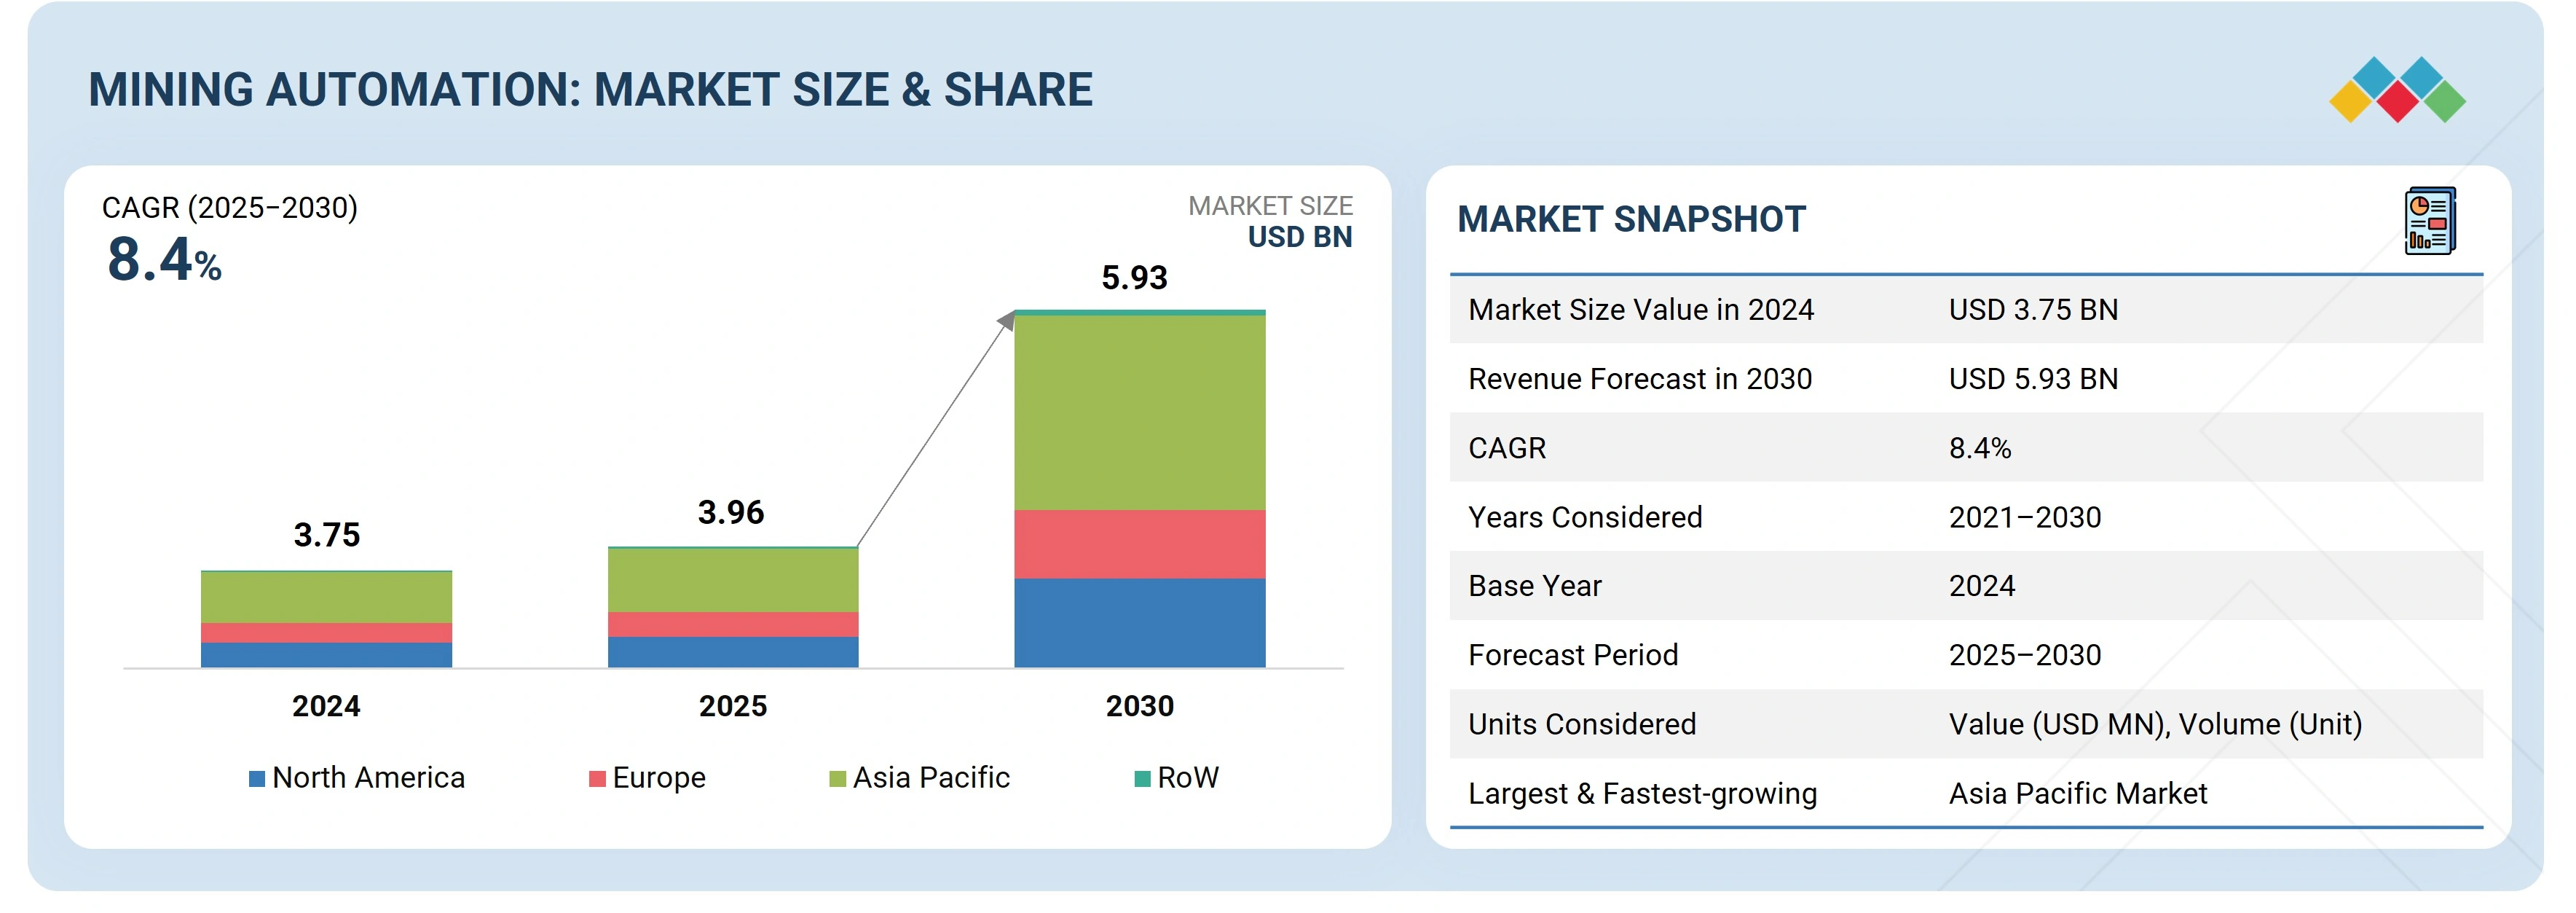
According to Marketsandmarkets, the global mining automation market size was valued at USD 3.96 billion in 2025 and is projected to reach USD 5.93 billion by 2030, growing at a CAGR of 8.4% from 2025 to 2030. Mining automation refers to the minimization or the complete removal of human intervention from mining activities, including exploration, drilling, excavation, loading, hauling, and dumping. The growth of mining automation driven by the growing focus on enhancing safety and operational efficiency at mining sites.
MARKET SNAPSHOT TABLE
| REPORT METRIC | DETAILS |
|---|---|
| Market Size in 2025 (Value) | USD 3.96 Billion |
| Market Forecast in 2030 (Value) | USD 5.93 Billion |
| Growth Rate | CAGR of 8.4% from 2025-2030 |
| Years Considered | 2021-2030 |
| Base Year | 2024 |
| Forecast Period | 2025-2030 |
| Units Considered | Value (USD Million/Billion), Volume (In Units) |
| Report Coverage | Revenue forecast, company ranking, competitive landscape, growth factors, and trends |
| Segments Covered |
|
| Regional Scope | North America, Europe, Asia Pacific, and RoW |
| Top Companies |
|
| Growth Drivers |
|
Market Size & Forecast
KEY TAKEAWAYS
-
BY TECHNIQUEMining automation leverages techniques such as surface mining and underground mining, with underground mining witnessing strong adoption due to safety, labor shortage mitigation, and efficiency needs. Surface mining automation is driven by the demand for large-scale ore extraction, precision, and cost optimization.
-
BY OFFERINGThe market comprises equipment, software, and communication systems. Equipment such as autonomous haul trucks, drilling rigs, and loaders dominate adoption, while software platforms enable fleet management and predictive analytics. Communication systems play a critical role in integrating IoT and AI for seamless mining operations.
-
BY APPLICATIONApplications include metal mining, mineral mining, coal mining, and others. Metal mining leads adoption due to rising demand for iron, copper, and other base metals, while coal mining automation is driven by the need for efficiency and safety. Mineral mining is also expanding due to increased demand for rare earth and industrial mineral
-
BY WORKFLOWAutomation supports core mining workflows such as mine development, mining process, and mine maintenance. Mine maintenance is gaining traction as mines adopt predictive maintenance, remote diagnostics, and asset health monitoring to reduce unplanned downtime and extend equipment life.
-
BY REGIONAsia Pacific is projected to record the fastest growth with a CAGR of 8.9% due to rising demand for minerals, increasing adoption of smart mining technologies, and supportive government initiatives in countries like Australia, China, and India. North America and Europe lead in technology adoption due to strong presence of mining automation providers and stringent safety regulations
-
COMPETITIVE LANDSCAPELeading players such as Caterpillar, Sandvik AB, Epiroc AB, Komatsu, and Hitachi Construction Machinery Co., Ltd. focus on partnerships, product innovation, and acquisitions to expand their automation portfolios. Heavy investments in AI, robotics, and IoT integration are driving competitiveness, with collaborations between mining operators and technology providers shaping future opportunities.
The mining automation industry is projected to grow steadily over the next decade, driven by the rising demand for operational efficiency, worker safety, and cost optimization in mining activities. The adoption of autonomous equipment, AI-driven analytics, and IoT-enabled monitoring solutions is transforming traditional mining operations, enabling higher productivity, reduced human intervention in hazardous environments, and improved resource utilization
Source: Secondary Research, Interviews with Experts, MarketsandMarkets Analysis
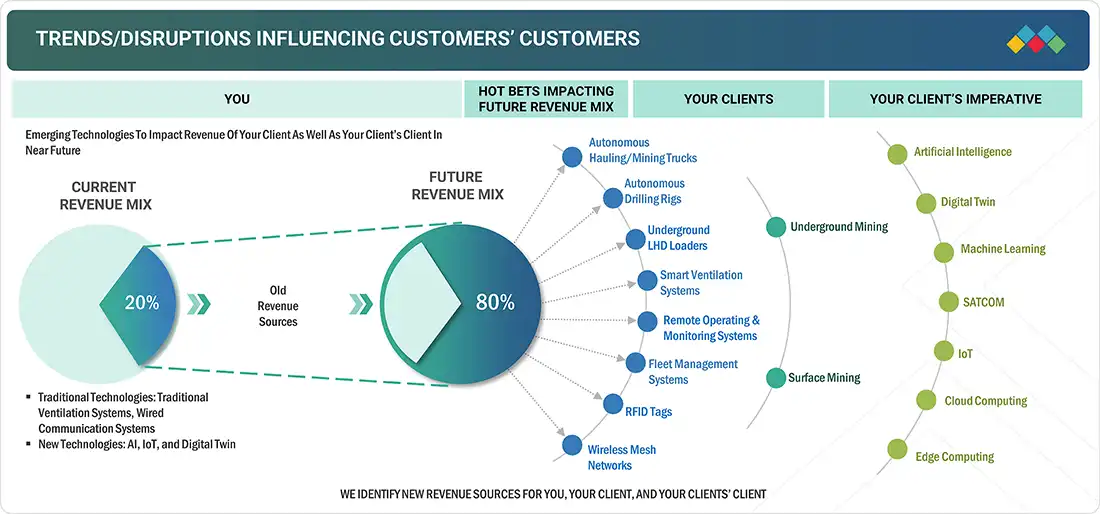
TRENDS & DISRUPTIONS IMPACTING CUSTOMERS' CUSTOMERS
The mining automation market growth is undergoing a significant transformation driven by emerging trends and technological disruptions. As shown in the diagram, there is a clear shift from traditional technologies to advanced systems such as autonomous mining trucks, drilling rigs, and smart ventilation solutions. These innovations are supported by wireless mesh networks, RFID tags, and remote monitoring systems that enhance operational efficiency and safety. Moreover, the integration of digital technologies such as AI, IoT, and digital twins is reshaping underground and surface mining operations, aligning with clients' imperatives to boost productivity and reduce costs. This evolving landscape is redefining revenue sources and creating new growth opportunities across the mining value chain.
Source: Secondary Research, Interviews with Experts, MarketsandMarkets Analysis
MARKET DYNAMICS
Level
-
Growing focus on enhancing safety and operational efficiency at mining sites

-
Rising emphasis of mining firms on minimizing operating expenditure

Level
-
Depletion of natural resources

-
Automation-induced job disruptions and GDP impact on mining-dependent economies

Level
-
Inclination of mine operators toward digital technologies

-
Growing trend of smart connected mining

Level
-
Interoperability issues associated with mining automation

-
Workforce shortage and skill gaps in operating automated mining systems

Source: Secondary Research, Interviews with Experts, MarketsandMarkets Analysis
Driver: Growing focus on enhancing safety and operational efficiency at mining sites
The remote location of mining sites makes it difficult for authorities to provide aid at the right time. Therefore, mining automation is a logical option for mining companies to tackle the challenges pertaining to safety and productivity as it replaces humans with automated machines.
Restraint: Depletion of natural resources
Mining depletes natural resources, causing environmental degradation and habitat destruction. As a consequence, carbon dioxide and other greenhouse gases are released, disrupting biomes and causing erosion. These processes contribute to enduring ecological harm, emphasizing the critical need for sustainable mining practices to mitigate environmental impact and preserve ecosystems.
Opportunity: Growing trend of smart connected mining
Connected mining uses advanced technologies to improve productivity and safety while reducing operating costs for mining sites. It combines IT, automation, and instrumentation technologies to enhance the mining process, from surveying and planning to exploration, extraction, and analysis.
Challenge: Workforce shortage and skill gaps in operating automated mining systems
The increasing use of automation in the mining automation industry creates a skill gap in the existing labor pool. Since automation is expected to replace the jobs of mine workers with automated equipment in the coming years, it also creates new job opportunities requiring a particular set of skills.
Mining Automation Market Trends: COMMERCIAL USE CASES ACROSS INDUSTRIES
| COMPANY | USE CASE DESCRIPTION | BENEFITS |
|---|---|---|
 |
Autonomous haul trucks and drilling systems integrated with AI-enabled fleet management solutions | Improved productivity with 24/7 operations, reduced labor dependency, enhanced safety in hazardous mining conditions |
 |
Autonomous haulage system (AHS) with real-time monitoring and collision avoidance | Increased fuel efficiency, optimized fleet utilization, reduced downtime, enhanced operational safety |
 |
Automated loaders and smart drilling rigs with remote operation capability | Improved ore recovery, reduced human presence in dangerous zones, higher drilling precision and efficiency |
 |
Autonomous drilling rigs and tele-remote control systems for underground and surface mines | Improvement in drilling accuracy, reduced maintenance costs, higher asset utilization |
 |
Autonomous dump trucks and advanced fleet management systems integrated with IoT | Increased haulage productivity, predictive maintenance to reduce breakdowns, lower total cost of ownership |
Logos and trademarks shown above are the property of their respective owners. Their use here is for informational and illustrative purposes only.
MARKET ECOSYSTEM
Mining automation ecosystem comprises established hardware, software, and communication system providers, which includes Caterpillar (US), Komatsu (Japan), Sandvik AB (Sweden), Epiroc AB (Sweden), and Hitachi Construction Machinery Co., Ltd. (Japan). These companies offer advanced mining automation systems. The ecosystem also comprises automation technology providers and end users.
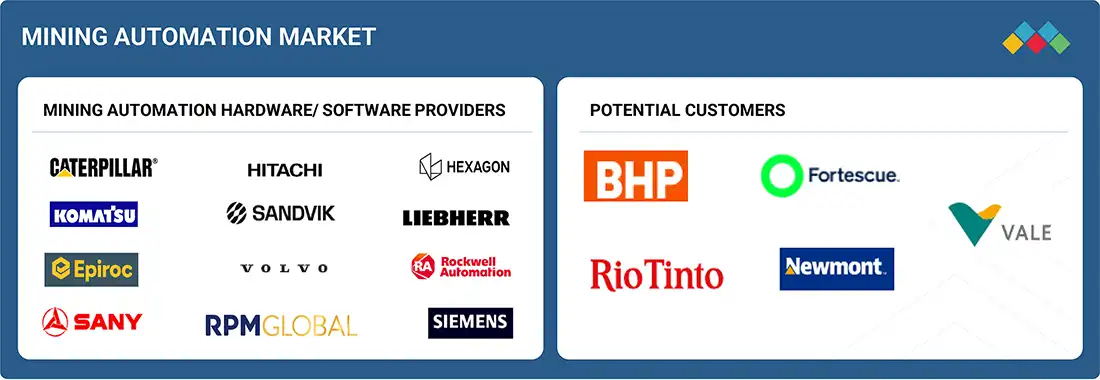
Logos and trademarks shown above are the property of their respective owners. Their use here is for informational and illustrative purposes only.
MARKET SEGMENTS
Source: Secondary Research, Interviews with Experts, MarketsandMarkets Analysis
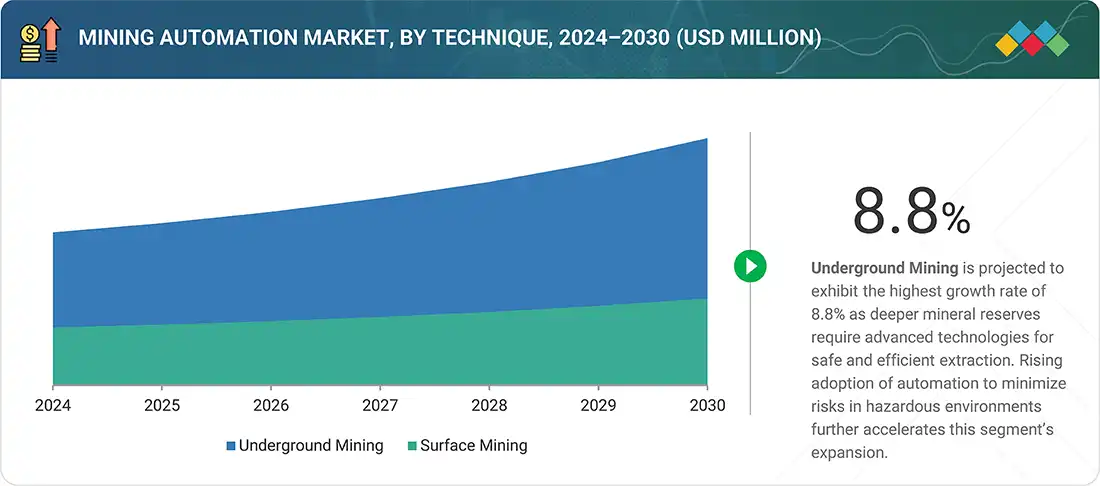
Mining Automation Market, By Technique
The underground mining segment held the largest market share in 2024, as it involves high-risk environments where safety, efficiency, and precision are critical. Automation technologies such as autonomous drilling, hauling, and monitoring systems significantly reduce human exposure to hazardous conditions while improving productivity. Additionally, the growing demand for minerals and metals located in deep deposits further drives the reliance on automated underground mining solutions.
Mining Automation Market, By Offering
The equipment segment accounted for a significant share in 2024, as autonomous trucks, drilling rigs, loaders, and haulage systems form the backbone of automated mining operations. These machines directly enhance productivity, reduce labor dependency, and ensure safety in hazardous environments. Growing investments by mining companies in advanced autonomous fleets and the proven cost savings from equipment automation further strengthen this segment’s market share.
Mining Automation Market, By Workflow
The mine development segment held the largest share in 2024, as it is the foundation of any mining project, involving critical activities like planning, excavation, and infrastructure setup. Automation in this stage ensures precision, safety, and efficiency, reducing project delays and long-term operational costs.
Mining Automation Market, By Application
The mineral mining segment held the largest share in 2024, as the demand for rare earth elements, industrial minerals, and aggregates continues to surge across electronics, renewable energy, and construction industries. Automation enhances extraction efficiency and safety, making it the preferred choice for meeting rising global mineral requirements.
REGION
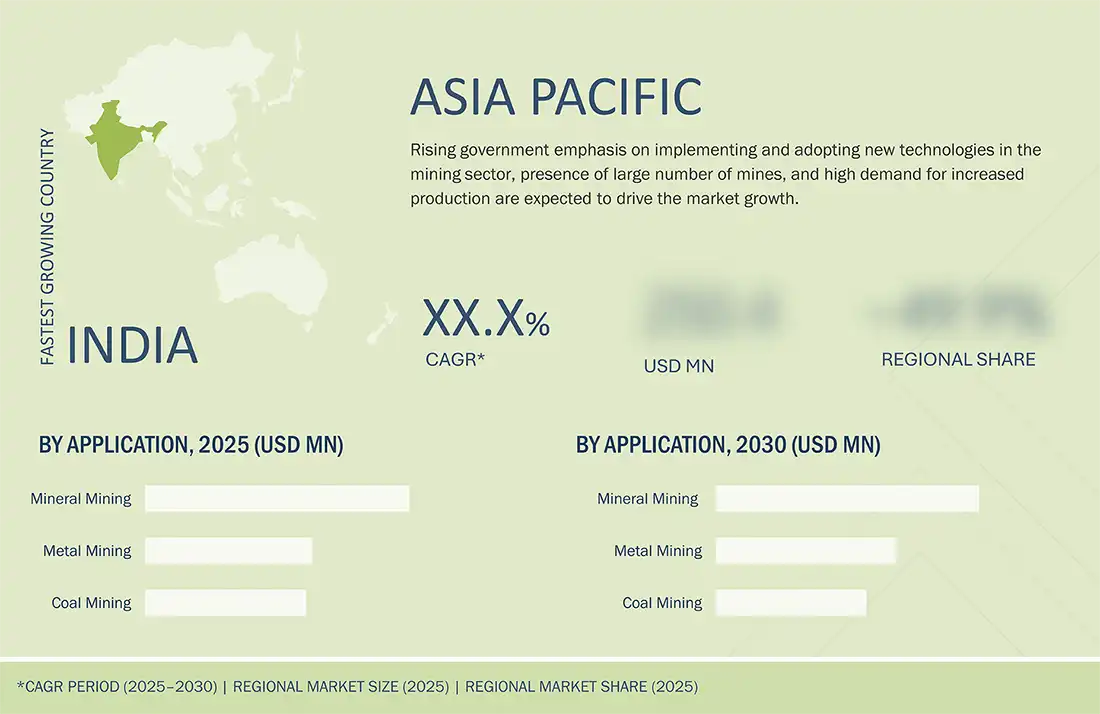
Asia Pacific to register highest CAGR in global mining automation market growth during forecast period
Asia Pacific is projected to be the fastest-growing market for mining automation, due to extensive mineral and metal reserves, rising demand from rapidly industrializing economies like China and India, and significant investments in smart mining technologies. Supportive government policies and increasing adoption of autonomous equipment further accelerate regional growth.
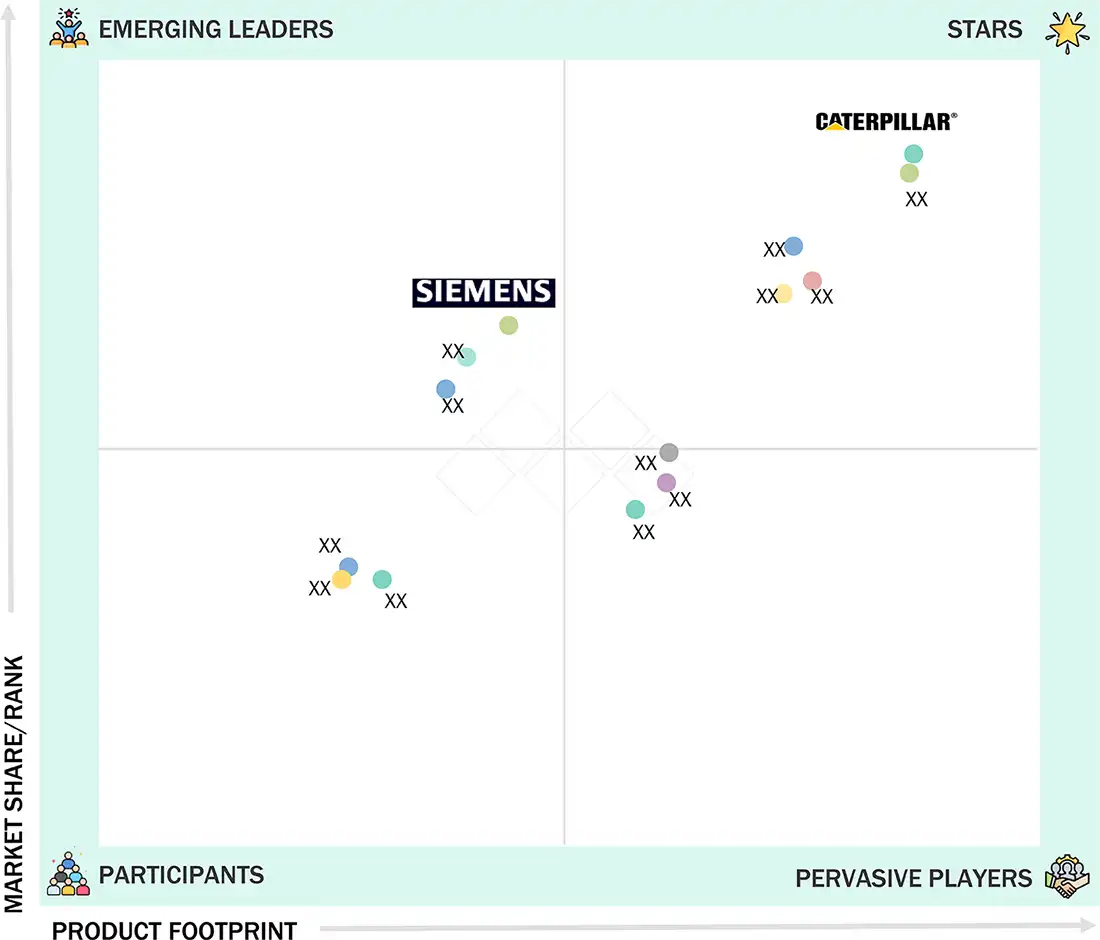
Mining Automation Market Share: COMPANY EVALUATION MATRIX
In the mining automation companies market matrix, Caterpillar (Star) leads with a strong market presence and comprehensive product portfolio, driving large-scale adoption of autonomous trucks, drilling rigs, and hauling systems across mining operations. Siemens (Emerging Leader) is gaining traction with its advanced automation and digitalization solutions, supporting energy-efficient and intelligent mining processes. While Caterpillar dominates with scale and equipment strength, Siemens shows strong potential to move toward the leaders’ quadrant through its innovations in IoT, AI, and digital mining ecosystems.
Source: Secondary Research, Interviews with Experts, MarketsandMarkets Analysis
WHAT IS IN IT FOR YOU: Mining Automation Market GrowthREPORT CONTENT GUIDE

DELIVERED CUSTOMIZATIONS
We have successfully delivered the following deep-dive customizations:
| CLIENT REQUEST | CUSTOMIZATION DELIVERED | VALUE ADDS |
|---|---|---|
| Global Mining Equipment OEM | • Competitive benchmarking of automation capabilities (haul trucks, drills, loaders) • Vendor analysis for automation software and hardware providers • Analysis of technology partnerships and JVs | • Identify white spaces in product automation portfolio • Optimize M&A and partnership strategies • Benchmark automation maturity against key rivals |
| Mining Services Provider | • Mapping of automation adoption by mine type (surface vs. underground) • Regional analysis of regulatory and labor drivers • Cost-benefit analysis of retrofitting vs. greenfield automation | • Enable go-to-market strategy in high-readiness markets • Uncover service opportunities in retrofit automation • Support pricing decisions with ROI analysis |
| Industrial Automation Company | • End-user needs analysis for fleet management, remote operations, and predictive maintenance • Analysis of interoperability issues with legacy systems • Competitive landscape of key solution providers | • Position solutions around highest-value pain points • Identify co-innovation partners and OEM integration pathways • Reduce go-to-market risk with deep customer insights |
| Mining Operator | • Site-level automation readiness assessment • Vendor selection criteria and decision frameworks • Workforce reskilling and change management trends | • De-risk CAPEX with tech-vendor fit analysis • Accelerate automation ROI through best practice insights • Build workforce strategies aligned with tech adoption |
RECENT DEVELOPMENTS
- July 2025 : Epiroc AB collaborated with Chilean mining company Sociedad Punta del Cobre SA (Pucobre) to supply a significant fleet of underground mine trucks along with digital solutions. This partnership aims to enhance Pucobre’s productivity, safety, and cost efficiency.
- June 2025 : Barrick Mining Corporation signed a USD 440 million agreement with Komatsu to supply primary mining equipment for the Reko Diq copper-gold project in Pakistan starting in 2026. This marks Komatsu’s first major mining equipment deal in the Middle East, highlighting their growing partnership.
- April 2025 : Hitachi Construction Machinery launched the LANDCROS Connect Fleet Management System, enabling companies to monitor and analyze operational data from mixed-brand equipment fleets.
Table of Contents
 Exclusive indicates content/data unique to MarketsandMarkets and not available with any competitors.
Methodology
The study involved four major activities in estimating the current size of the mining automation market. Exhaustive secondary research was conducted to gather information on the market, adjacent markets, and the overall mining automation landscape. These findings, along with assumptions and projections, were validated through primary research involving interviews with industry experts and key stakeholders across the value chain. Both top-down and bottom-up approaches were utilized to estimate the overall market size. Subsequently, market breakdown and data triangulation techniques were applied to determine the sizes of various segments and subsegments. Two key sources, secondary and primary, were leveraged to conduct a comprehensive technical and commercial assessment of the mining automation market.
Secondary Research
The secondary research process referred to various secondary sources to identify and collect necessary information for this study. The secondary sources included annual reports, press releases, and investor presentations of companies; white papers; journals and certified publications; and articles from recognized authors, websites, directories, and databases. Secondary research was conducted to obtain key information about the industry’s supply chain, the market’s value chain, the total pool of key players, market segmentation according to the industry trends (to the bottom-most level), regional markets, and key developments from market- and technology-oriented perspectives. The secondary data was collected and analyzed to determine the overall market size, further validated by primary research.
Primary Research
Extensive primary research was conducted after gaining knowledge about the current scenario of the mining automation market through secondary research. Several primary interviews were conducted with experts from the demand and supply sides across four major regions—North America, Europe, Asia Pacific, and RoW. This primary data was collected through questionnaires, emails, and telephonic interviews.

Note: Three tiers of companies have been defined based on their total revenue as of 2024: The 3 tiers are defined based on their total revenues as of 2024. Tier 1: >USD 5 billion, Tier 2: USD 500 million–USD 5 billion, and Tier 3: USD 500 million. Other designations include sales managers, marketing managers, and product managers.
To know about the assumptions considered for the study, download the pdf brochure
Market Size Estimation
Both top-down and bottom-up approaches were used to estimate and validate the total size of the mining automation market. These methods have also been used extensively to estimate the size of various subsegments in the market. The following research methodology was used to estimate the market size:
- Major players in the industry and markets were identified through extensive secondary research.
- The industry’s value chain and market size (in terms of value) were determined through primary and secondary research processes.
- All percentage shares, splits, and breakdowns were determined using secondary sources and verified through primary sources.
Mining Automation Market : Top-Down and Bottom-Up Approach

Data Triangulation
After arriving at the overall size of the mining automation market using the market size estimation process explained above, the total market was split into several segments and subsegments. Data triangulation and market breakdown procedures were employed, wherever applicable, to complete the overall market engineering process and arrive at the exact statistics for all segments and subsegments of the market. The data was triangulated by studying various factors and trends from both the demand and supply sides. The market size was also validated using both top-down and bottom-up approaches.
Market Definition
Mining automation refers to the minimization or the complete removal of human intervention from mining activities, including exploration, drilling, excavation, loading, hauling, and dumping. The adoption of mining automation technologies provides several advantages, such as enhanced safety, increased efficiency and productivity, cost reduction, optimized resource utilization, environmental impact mitigation, data-driven decision-making, remote operation and monitoring, and compliance with regulatory policies.
Mining operations can be automated by using automated mining equipment such as autonomous haulage trucks and drilling rigs, automated ventilation systems, pumping/dewatering, and HVAC control systems, and dedicated software such as fleet management software, workforce safety and management software, remote monitoring software, asset management software, and communication systems.
Key Stakeholders
- End users of mining automation tools and software
- Manufacturers of mining automation equipment
- Distributors of mining automation equipment and software
- Mining automation industry associations
- Professional service/solution providers
- Research institutions and organizations
- Standards organizations, regulatory authorities, government bodies, venture capitalists, and private equity firms related to the mining automation market
- System integrators
- Technology consultants
Report Objectives
- To define, describe, and forecast the mining automation market, in terms of offering, technique, workflow, application, and region, in terms of value
- To forecast the market, by offering, in terms of volume
- To describe and forecast the market, in terms of value, with regard to four main regions: North America, Europe, Asia Pacific, and Rest of the World (RoW), along with their respective countries
- To provide detailed information regarding major factors such as drivers, restraints, opportunities, and challenges influencing the market growth
- To provide a detailed overview of the mining automation value chain
- To strategically analyze micromarkets with respect to individual growth trends, prospects, and contributions to the mining automation market
- To analyze opportunities in the market for stakeholders by identifying high-growth segments of the mining automation market
- To strategically profile key players and comprehensively analyze their market position in terms of ranking and core competencies, along with detailing the competitive landscape for market leaders
- To analyze competitive strategies, such as product launches, expansions, and mergers and acquisitions, adopted by key players in the mining automation market
Available Customizations
With the given market data, MarketsandMarkets offers customizations according to the company’s specific needs. The following customization options are available for the report:
Company Information:
- Detailed analysis and profiling of additional market players (up to 5)
Key Questions Addressed by the Report
What is the current size of the Mining Automation market?
The global Mining Automation market is valued at USD 3.96 billion in 2025 and is projected to reach USD 5.93 billion by 2030. (MarketsandMarkets)
What is the expected growth rate of the Mining Automation market?
The market is expected to grow at a CAGR of 8.4% from 2025 to 2030, driven by increasing automation adoption across mining operations. (MarketsandMarkets)
What are the key growth drivers for the Mining Automation industry?
Major growth drivers include the need to improve worker safety, enhance operational efficiency, reduce labor dependency, minimize operating costs, and increase productivity through autonomous equipment and AI-powered systems. (MarketsandMarkets)
What are the major technology trends in the Mining Automation market?
Key trends include autonomous haulage systems, automated drilling systems, AI-powered analytics, IoT-enabled monitoring, digital twins, predictive maintenance, remote operations, and smart ventilation systems. (MarketsandMarkets)
Which mining technique segment is growing the fastest?
Underground mining is expected to register the highest CAGR due to increasing safety requirements, labor shortages, and the need for efficient extraction from deep mineral deposits. (MarketsandMarkets)
Which application segment dominates the Mining Automation market?
Mineral mining held the largest market share in 2024 due to rising demand for rare earth elements, industrial minerals, and materials required for renewable energy and electronics industries. (MarketsandMarkets)
Which region is expected to grow the fastest in the Mining Automation market?
Asia Pacific is projected to be the fastest-growing region, with an estimated CAGR of 8.9%, supported by strong mining activity in China, India, and Australia and increasing investments in smart mining technologies. (MarketsandMarkets)
Who are the leading companies operating in the Mining Automation market?
Major companies include Caterpillar, Komatsu, Sandvik AB, Epiroc AB, and Hitachi Construction Machinery Co., Ltd.. (MarketsandMarkets)
What opportunities exist in the Mining Automation industry?
Significant opportunities include smart connected mining, digital transformation initiatives, AI-driven decision-making, predictive maintenance systems, and expansion of autonomous mining fleets. (MarketsandMarkets)
How is the Mining Automation market analyzed in the report?
The report utilizes top-down and bottom-up market sizing approaches, primary interviews, secondary research, data triangulation, competitive benchmarking, regional analysis, and segment-level forecasting to estimate market trends and growth. (MarketsandMa
Need a Tailored Report?
Customize this report to your needs
Get 10% FREE Customization
Customize This ReportPersonalize This Research
- Triangulate with your Own Data
- Get Data as per your Format and Definition
- Gain a Deeper Dive on a Specific Application, Geography, Customer or Competitor
- Any level of Personalization
Let Us Help You
- What are the Known and Unknown Adjacencies Impacting the Mining Automation Market
- What will your New Revenue Sources be?
- Who will be your Top Customer; what will make them switch?
- Defend your Market Share or Win Competitors
- Get a Scorecard for Target Partners

Custom Market Research Services
We Will Customise The Research For You, In Case The Report Listed Above Does Not Meet With Your Requirements
Get 10% Free CustomisationTESTIMONIALS

Tetsuya Ohhira
Business Development Manager-Technology Business
Nikon Corporation,
Leading Japanese MNC specializing in optics and imaging productswww.nikon.com
MarketsandMarkets™ response
is quick. Their attitude is flexible and positive. Analyst Insights are globally considered and
significant. Client Services quickly respond to our inquiry and demand. Their wide range of global
surveys help us make our strategic plan.
We hope Knowledge Store will be easier to search
for a report.
VP - Marketing & Business Development
Leading Provider of Process Control Solutions
We engaged with MarketsandMarkets on a study to perform an analysis and recommend a Go-To-Market strategy for metrology and process control in the semiconductor market. The study was tailored to our targets and needs with well-defined milestones. Our overall experience with the MarketsandMarkets team was very good throughout the project in all aspects including the analysis methodologies used, the quality and depth of primary and secondary data sets, the professionalism and flexibility of the team and the ability to meet the target schedule and milestones. We want to thank MarketsandMarkets team for a job well done.
Growth opportunities and latent adjacency in Mining Automation Market


Terry
Apr, 2026
Which automation technologies (AI, digital twins, IoT, autonomous haulage) are expected to generate the highest ROI and fastest adoption across mining operations?.
Gerald
Apr, 2026
What role does electrification of mining equipment play in shaping future investment opportunities alongside automation.