The study involved four major activities in estimating the size of the smart home market . Exhaustive secondary research has been carried out to collect information on the market, the peer markets, and the parent market. Both top-down and bottom-up approaches have been employed to estimate the total market size. Market breakdown and data triangulation methods have also been used to estimate the market for segments and subsegments.
Secondary Research
Revenues of companies offering data center accelerator systems have been obtained from the secondary data available through paid and unpaid sources. The revenues have also been derived by analyzing the product portfolio of key companies, and these companies have been rated according to the performance and quality of their products.
In the secondary research process, various sources have been referred to for identifying and collecting information for this study on the smart home market share . Secondary sources considered for this research study include government sources, corporate filings, and trade, business, and professional associations. Secondary data has been collected and analyzed to arrive at the overall market size, which has been further validated through primary research.
Secondary research has been mainly used to obtain key information about the supply chain of data center accelerator systems to identify key players based on their products and prevailing industry trends in the smart home market share by product, offering, sales channel, and installation type, and region. Secondary research also helped obtain market information- and technology-oriented key developments undertaken by market players to expand their presence and increase their market share.
Primary Research
Extensive primary research has been conducted after understanding and analyzing the current scenario of the smart home market share through secondary research. Several primary interviews have been conducted with the key opinion leaders from the demand and supply sides across four main regions—North America, Europe, Asia Pacific, and the Rest of Europe. Approximately 25% of the primary interviews were conducted with the demand-side respondents, while approximately 75% were conducted with the supply-side respondents. The primary data has been collected through questionnaires, emails, and telephone interviews.
After interacting with industry experts, brief sessions were conducted with highly experienced independent consultants to reinforce the findings from our primary. This, along with the in-house subject matter experts’ opinions, has led us to the findings as described in the remainder of this report. The breakdown of primary respondents is as follows:

To know about the assumptions considered for the study, download the pdf brochure
Market Size Estimation
The bottom-up approach has been employed to arrive at the overall size of the smart home market share from the revenues of key players and their share. Calculations based on revenues of the key players identified in the market led to the estimation of the market’s overall size.
-
Approach to arrive at market size using bottom-up analysis (demand side)
-
Initially, over 25 companies offering smart home solutions were identified. Their offerings were mapped based on products, software, and services.
-
After understanding the different types of smart homes offered by various manufacturers, the market was categorized into different segments based on the data gathered through primary and secondary sources.
-
To derive the global smart home market share , global shipments of top players for each smart home device that were considered in the scope of the report were tracked.
-
A suitable penetration rate was assigned for each product type to derive the shipments of smart homes.
-
We derived the smart home market share based on different product types using the average selling price (ASP) at which a particular company offers its devices. The ASP of each device was identified based on secondary sources and validated from primaries.
-
For the projected market values of each device type, the Y-o-Y projections showed a steep growth initially until 2023. The market is expected to witness a sharp ascent after that, considering the demand for smart homes for different applications.
-
For the CAGR, the market trend analysis was carried out by understanding the industry penetration rate and the demand and supply of smart homes in different applications.
-
The smart home market share is also tracked through the data sanity method. The revenues of over 25 key providers were analyzed through annual reports and press releases and summed to derive the overall market.
-
For each company, a percentage is assigned to its overall revenue or, in a few cases, segmental revenue to derive its revenue for the smart home. This percentage for each company is assigned based on its product portfolio and range of smart home offerings.
-
The estimates at every level have been verified and cross-checked by discussing them with key opinion leaders, including CXOs, directors, and operation managers, and finally, with the domain experts at MarketsandMarkets.
Various paid and unpaid sources of information, such as annual reports, press releases, white papers, and databases, have been studied’

The top-down approach has been used to estimate and validate the total size of the smart home Industry .
-
The global market size of smart homes was estimated through the data sanity of 25 major companies.
-
The growth of the smart home Industry witnessed an upward trend during the studied period, as it is currently in the initial stage of the product cycle, with major players beginning to expand their business into various application areas of the market.
-
Types of smart homes, their features and properties, geographical presence, and key applications served by all players in the smart home Industry were studied to estimate and arrive at the percentage split of the segments.
-
Different types of smart homes and their penetration for products were also studied.
-
Based on secondary research, the market split for smart homes by sales channel, offering, and installation type was estimated.
-
Multiple discussions with key opinion leaders across major companies involved in developing the smart home and related components were conducted to validate the market split of sales channel, offering, and installation type.
-
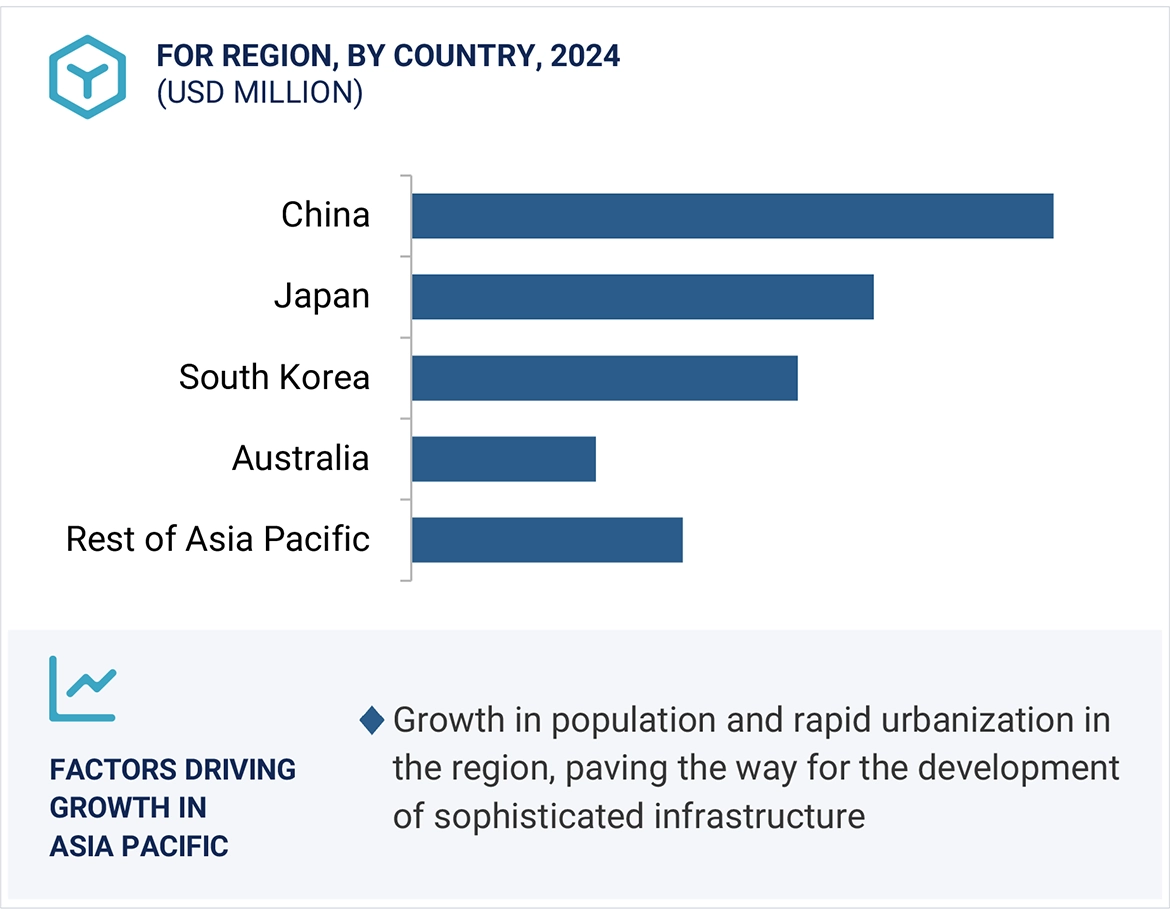
The regional splits were estimated using secondary sources based on factors such as the number of players in a specific country and region and the adoption and use cases of each implementation type with respect to products in the region.

Data Triangulation
After arriving at the overall market size-using the market size estimation processes as explained above-the market has been split into several segments and subsegments. To complete the entire market engineering process and arrive at the exact statistics of each market segment and subsegment, data triangulation and market breakdown procedures have been employed, wherever applicable. The data has been triangulated by studying various factors and trends from the demand and supply sides in the smart home Industry growth.
Market Definition
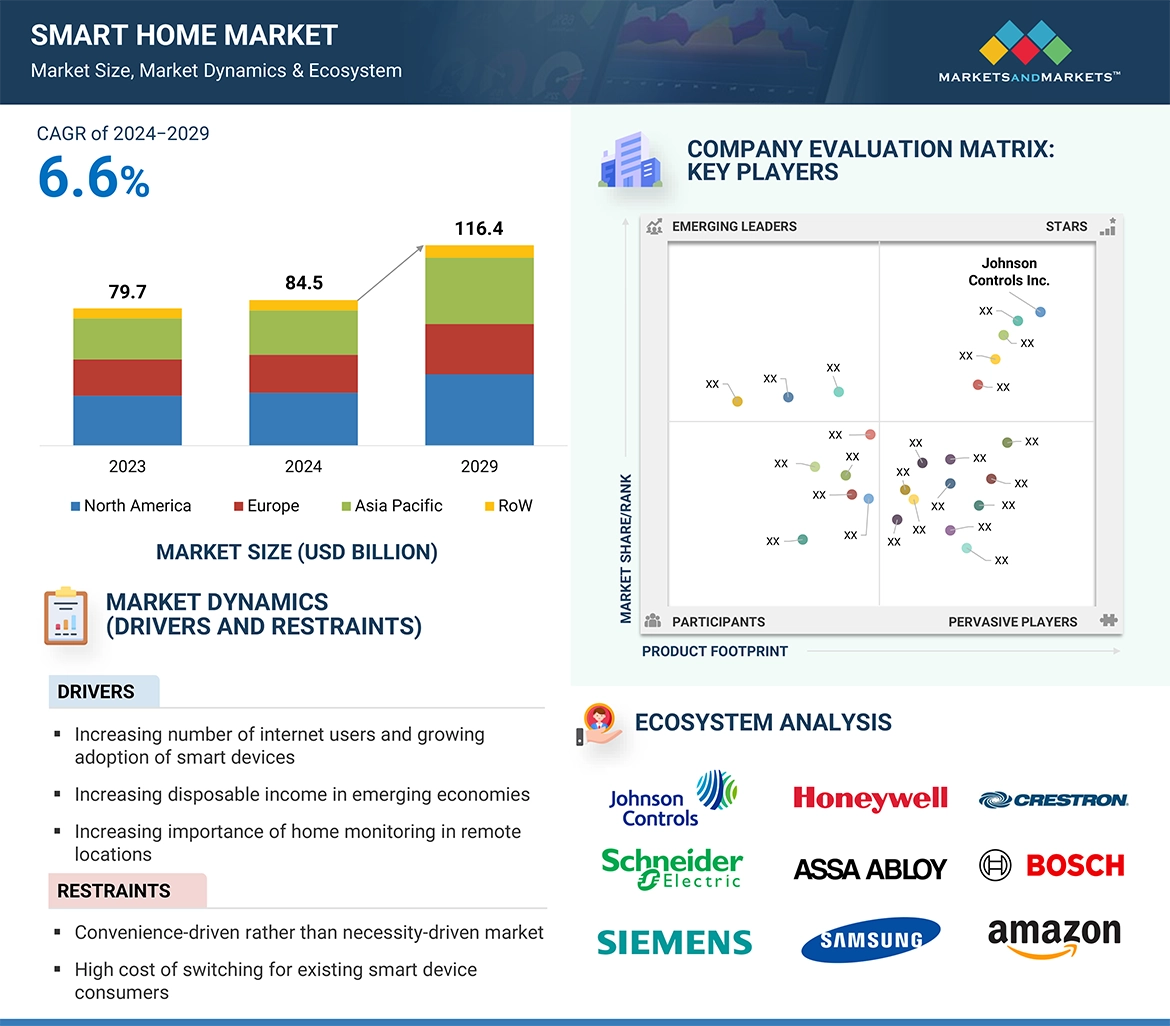
A smart home is incorporated with advanced automation systems that enable inhabitants to monitor and control the functions of the house. Smart home systems enable owners to control lights, heating, ventilation, and air conditioning (HVAC), security alarms, and other household devices remotely through their smartphones, tablets, or computers. Smart homes are equipped with wired and wireless communication technologies such as Wi-Fi, Bluetooth, universal powerline bus (UPB), Insteon, Z-Wave, and Zigbee to offer intelligent insights and details to homeowners by continuously monitoring various aspects of the homes. As part of the Internet of Things (IoT), smart home systems and devices often operate together, sharing consumer usage data and automating actions based on homeowners’ preferences.
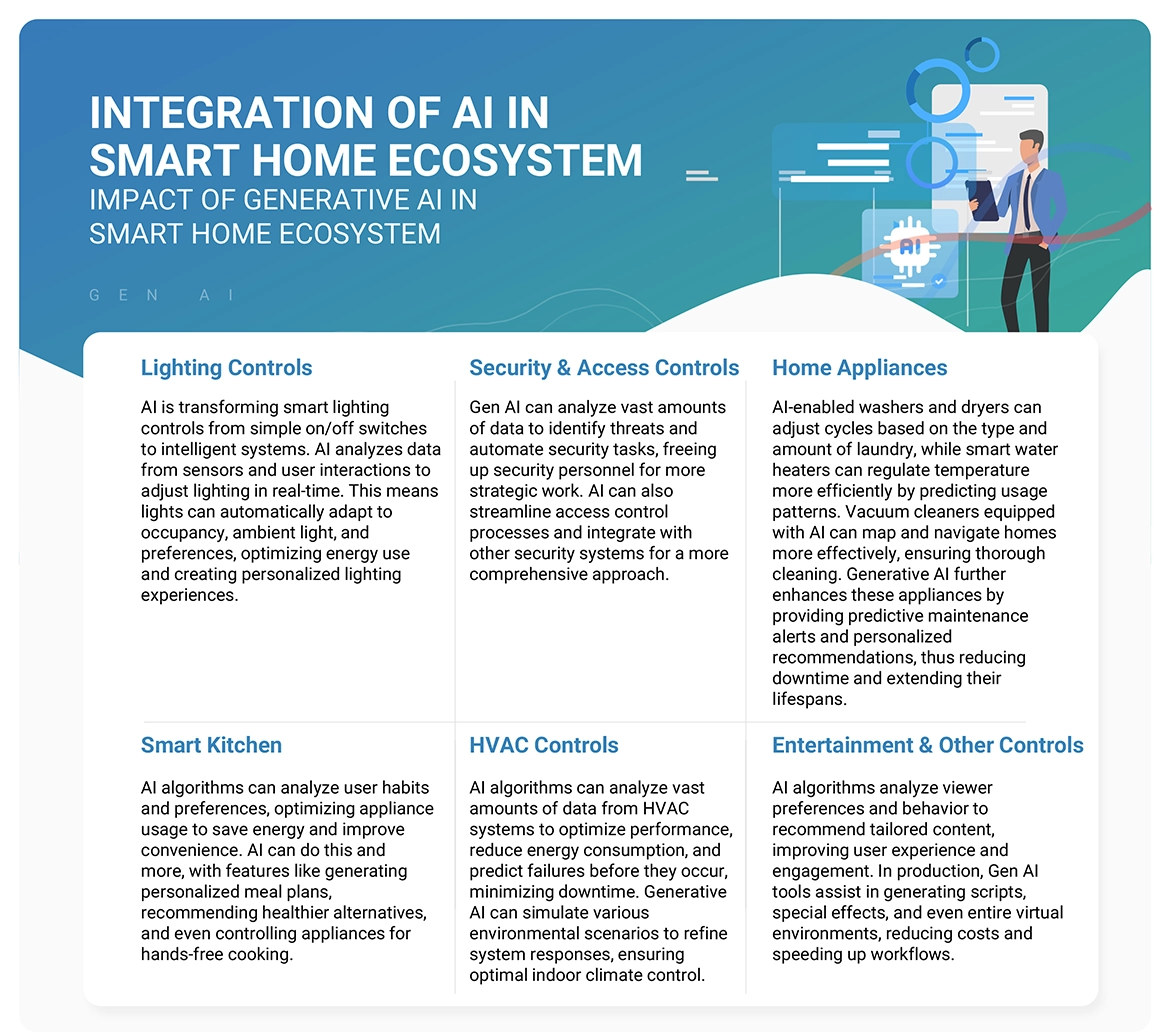
According to Smart Home Energy, an association in the UK, smart homes use home automation technologies to provide homeowners with intelligent feedback and information by monitoring many aspects of a home. For example, a smart home’s refrigerator may be able to catalog its contents, suggest menus, recommend healthy alternatives, and order replacements as food is used up.
Key Stakeholders
-
Raw Material and Manufacturing Equipment Suppliers
-
Automation and Control Vendors
-
Automation and Control Networking Technology Vendors
-
Real Estate Builders
-
System Integrators
-
Homeowners
-
Project Consultants
-
Designers/Consultants (HVAC, Security, and Fire and Safety)
-
Component Manufacturers (Sensors and Controls)
-
Home Management System (Products and Servers) Providers
-
Smart Home-related Associations, Organizations, Forums, and Alliances
-
Government Bodies Associated with Green Buildings
Report Objectives
-
To define, describe, segment, and forecast the smart home market, by product, offering, sales channel, and installation type, in terms of value
-
To forecast the market for products, in terms of volume
-
To describe the protocols and technologies used for smart home
-
To describe and forecast the market for various segments, with respect to four main regions: North America, Europe, Asia Pacific, and the Rest of the World (RoW), along with their respective countries, in terms of value
-
To provide detailed information regarding the drivers, restraints, opportunities, and challenges influencing the growth of the smart home industry
-
To provide a detailed overview of the smart home market’s supply chain, along with the ecosystem, technology trends, use cases, regulatory environment, and Porter’s five forces analysis
-
To analyze industry trends, pricing data, patents and innovations, and trade data (export and import data) related to the smart home
-
To strategically analyze the micromarkets1 with respect to individual growth trends, prospects, and contributions to the total market
-
To strategically profile the key players and comprehensively analyze their market shares and core competencies2
-
To analyze opportunities for stakeholders and provide a detailed competitive landscape of the market
-
To analyze competitive developments, such as product launches/developments, collaborations, partnerships, acquisitions, and research & development (R&D) activities carried out by players in the smart home Industry
Available customizations:
With the given market data, MarketsandMarkets offers customizations according to the specific requirements of companies. The following customization options are available for the report:
-
Detailed analysis and profiling of additional market players based on various blocks of the supply chain


piter
Mar, 2019
Need to understand about market share analysis..
matt
Sep, 2015
On this report - is it possible to get a market forecast and other commentary on the Middle East region? .
User
Jan, 2020
What is the market size of the Middle-East smart home market?.
Kevin
Jan, 2017
Will Google and Amazon or any other big player enter the market for central controlling device of the smart home, are players like alarm.com on their way out?.
Johanna
Mar, 2019
I would like to get an overview of the heating/cooling, security, connected care and remote diagnostics of the smart home market..
Maegan
Nov, 2017
Looking specifically at Security & Access Control, HVAC, Entertainment in US markets and growth trends technology diffusion, learning curves and competition, and IP analysis..
Jiangyu
Jun, 2019
Hi, I'd like to learn more about the smart home market, including its market size and growth trend, details of different product categories and strong players in this domain. I would appreciate a lot if you can provide me a sample of this report..
Christy
Oct, 2014
Does this report provide data on any new industries that consumers have indicated an interest in for smart home technologies, such as lawn and garden or outdoor living/spaces?.
William
Jun, 2015
I am looking at a few different markets and I am hoping for at least the following questions: I am looking for the following items in order from most important to least important. 1: Forecast 3-5 years through 2025 (Units and Revenue) broken down by country: US, Canada, France, Belgium, UK, Netherlands (all of Europe) 2: 2019 actuals by competitor share 3: Historical (2017, 2018)..
Rebecca
Mar, 2019
Dear Sir, we're on the process of working on smart home market now. Can we get market research report example from your side. .
Joana
Feb, 2015
I would like to obtain projections for the investments in the smart homes market in Europe and possible projections of human resources involved in the smart homes field (graphics with these information's if possible)..
James
Oct, 2018
Hi, we are particularly interested in smart lock market size and penetration rate of different countries, do you got any report suitable for this? .
Sachin
Sep, 2019
I am extremely fascinated by the idea of smart homes as it is a way forward for the construction & designing industry. I am planning to setup a venture in this space, and for that I wish to do a thorough and detailed research about its market share, customer requirements and future prospects..
Ian
Nov, 2014
Hi, I am interested to know about the reform in our industry. Especially the development of new innovations that can help provide additional value to customers..
VALERY
Mar, 2019
In case of market analysis, we would like to understand this market before launching our SaaS solution. .
Hoa
Mar, 2015
I'd like to know the market segmentation and in particular anything about the smart homes in the bathroom..
Chuck
Feb, 2019
I am an MBA student and as part of my final project I am researching the smart home and smart home security industry. I came across this report in my search and think it would be beneficial to my research. I cannot afford to pay for this report, but would appreciate a sample PDF or a full copy. .
Paul
Feb, 2015
I am interested to know about this market. This is purely for individual curiosity, not a business interest at this time..
Marcel
Mar, 2016
Looking to understand viability of installation and customization services company for the smart home market in greater LA. Is there demand for these services today?.
Marcel
Mar, 2016
Looking to understand viability of installation and customization services for smart home market in North America. What is the current demand for these services?.
Rahul
Jun, 2019
I'm thinking of setting up a smart home products company and I needed some data to understand consumers. Would be great if you could share a sample that's more geared towards consumer personals / profiles. .
Jaroslaw
Nov, 2018
Dear Team Members, I would like to find out, if you could sell us the report for the UK market only. If so, what would be the price? .
Philipp
Mar, 2016
Need information on Smart Home Market by Product especially for Air Quality surveillance including Temperature, Humidity and air pollutants like PM2.5, VOCs, Ozone etc..
Madeleine
Feb, 2019
Writing my thesis on voice interaction in the smart home and would like to get a free sample of the report if possible..
Andrew
Jul, 2022
I will be looking at:* UK Specific Smart home market data only* The ability to look at lock penetration by market segment* The ability to understand lock type sold in volumes* To understand ideally, who is selling these locks* To understand/confirm the route to market for these.This will allow me to propose market opportunities for our existing solutions and proposals for those we need to develop further..
Rom
Mar, 2019
Our team is evaluating investment opportunities in the space and is analyzing whether this is a market thematic to pay attention to. Kindly clarify about your report scope..
Sam
Mar, 2017
Interest in smart thermostat and home surveillance markets. Particularly NEST products and competitor products.
Aug, 2019
Looking for quality market data on smart home space, as well as additional specifics around the smart lighting sub-category..
Jae
Feb, 2019
I want to write a paper on which company is the most important firm in Home IoT, with its key local suppliers or intermediaries information. I also require a brief initial description of the kind of governance structure that characterizes home IoT industry. .
Benas
Apr, 2019
I wish to use the information presented in the article for research on the smart home market as part of a bachelor's project..
Fangzhou
Apr, 2019
Our company is building an IoT platform, and smart home is the most important part of IoT project. So we want to download this article and learn more about marketing information..
davidhuang
Mar, 2019
Hello, could you pls send me the pdf brochure of Global forecast of Smart home market in the next 3-5years? .
Darshan
Dec, 2015
Specifically interested in a deep dive of the home appliance segment, with a further deep dive of the smart components used within each category. Services are also an area of interest, as there is potential for revenue models based on this..
Franz
Sep, 2019
Need to identify addressable market, related to numbers of connected appliances and know about estimates for software market size..
Abdullah
Apr, 2019
I'm starting a smart home construction business and looking for information on the smart homes market segmentation in South Africa..
Ted
Feb, 2015
I am a tech industry journalist. I would like the whole report if possible to extract a few items from..
ram
Oct, 2016
Interested in smart home market for internet service providers in 2016-2022. Need to know market trends for applications for safety &security and entertainment..
Francis
Apr, 2019
I am currently reviewing an investment opportunity for major corporations in this sector. Need general market trends. .
Joongho
Sep, 2019
I'm conducting consult study for a government agency and writing report for construction road map. So I need global market forecast about Smart Home..
Ankit
Aug, 2019
I am a student studying MBA and I am interested in this report which can help me in my project assignment. It would be grateful if you could provide the report free of cost for my project..
sissiyam
May, 2019
My company will launch the new product line, smart home products and we want to extend oversea market and need to understand about the market..
Bernardino
Jul, 2016
I am interested to get samples of: Smart Home Market by Lighting Control (Timer, Daylight Sensor, Occupancy Sensor) - Security & Access Control - HVAC - Entertainment - Home Healthcare - Smart Kitchen. .
Philippa
Aug, 2018
Just looking for projected market size to calculate building industry growth for a school assignment..
Nabil
Mar, 2019
We are a startup in Smart Homes and would love to understand the market a little better - we don't have the scale to afford the full report but start with the sample and then hopefully as we scale and can afford the full report in some time..
Francisco
Feb, 2019
We need to understand about the research methodology used by MarketsandMarkets for market size calculation?.
jinlong
Jan, 2014
I am interest in product analysis and global forecast, especially for the market in America and Canada. .
Sibay
Nov, 2017
Market penetration of smart homes potential for Turkey region. .
Izabela
Oct, 2019
I'm looking for data about smart refrigerators (or household products) and how many people use them now and plan to use in the future. I'm preparing press release about Korean company which cooperates with my Client and this data will be helpful to make my article more interesting..
Sayantani
May, 2019
To The Team of Markets and Markets. What we are looking for the facts & figures that will tell us how many smart homes are built in India and what is the percentage of that compared to the total number of homes built in the country (a region-specific report would be very useful). The report should also include general trends and other related statistics, the key market players, and also the possible impact of the home automation phenomenon on builders, system integrators and other middle players/ channel partners. Please let us know if such report is available and what is the price of the same. .
kristine
Dec, 2016
Our product line engage with smart home automation devices, all parts and functionality therein; and we are interested in the following sections: 1. Who are the prime distributor of smart home systems in Dubai, Europe, and emerging cities in Russia 2. Who are the major integrators, building supplier/contractors for residential buildings, hotels, and or business centers in Dubai, Europe..
Patrick
Dec, 2016
Dear MarketsandMarkets Team, I am a student and in one subject we have to generate business model for a start-up idea for active assisted living. Thus, we also have to come up with a market analysis and I think that the reports could be used as a reliable source because of your expertise. Since I am a student, I cannot buy all the reports I would like to have, therefore I only can ask you if you would be so kind to offer me this report. .
Damola
Nov, 2016
Hi, I am very interested in learning more about Smart Home report or anything that you may have that's specific to the North America market. We are looking to learn more about the industry and would like to discuss what your report entails. .
Valentin
Oct, 2019
Dear Markets and Markets Team, for my dissertation in Marketing Management in Turin (Italy), I need some information and statistic data about trend of Smart Home Market. .
Laura
Sep, 2015
Need to know about market scenario for commercial/residential security systems CCTV (commercial/residential) systems, access control (commercial/residential systems), and fire (commercial) systems..
Jann
Sep, 2015
We would like to know which are smart gateway major players and overall units shipped. .
Cade
Sep, 2019
I'm looking to get a better understanding of the your smart home market definition, as well as an understanding of for which segment the key growth is expected over the next few years. We're trying to ascertain the relevance of standalone product sales vs. bundled subscriptions, and which will more greatly influence projected growth. .
Anton
Sep, 2019
We are interested in smart home control and engineering automation systems..
Anton
Sep, 2019
We are interested in intelligent buildings management system..
chris
Aug, 2011
Client is looking for some clarification on market numbers and trends..
Helen
Aug, 2016
I am interested in how the Smart Home Market and market scenario of Europe region. .
Gary
Aug, 2019
Need market analysis of smart home products in China. Who are the main players, what is the size of the market..
혜영
Jul, 2015
Need to understand about the market scope and coverage..
Veijo
Jul, 2016
I belong to the group that makes an international study on request of government agencies. The aim of the study is to investigate how new smart technology solutions and innovations as well as the ongoing process of digitalization of services could support and facilitate independent and safe living at home for older people. It is also essential to consider the international context and cooperation. The research consortium will interview expert in companies and research institutions/universities and make e-mail surveys in order to collect the necessary date for study. This involves several countries (Denmark, the Netherlands, USA and Japan) and will be carried out between June 2020 and December 2020..
carl
Jul, 2010
Need to know about market growth rate, key global service providers for the smart home market, and key smart home device manufacturers..
Sohail
Jul, 2021
Hi greetings! I have seen that you have analyzed Schneider Electric. Is there a possibility to just get total information about them, instead of this report ?. Waiting for your response. .
Joshua
Jul, 2019
Hi, I am looking at a subset of this report. My only interest and focus is on Smart Thermostats and nothing else. What would be the cost for sub section of this report that only includes information on smart thermostats?.
Jordan
Jul, 2019
For personal knowledge I would like to understand the current size of the smart home market and its predicted future growth..
Justin
Jul, 2013
I would like to buy smart home market sample report. Can u send me via e-mail? This is for study of market insight in general. .
Artyom
Jun, 2014
Dear Team Members, we are group of three students of eMBA program and we are making a master project on Smart Home Renovation Solutions. Your market report may be useful in our work. Would it be possible to buy it with any discount?.
Renee
Jun, 2019
I'm writing a story about practical home gadgets, like fitness gadget MIRROR, smart fridges, robotic lawnmowers, etc. I'd love to chat with an expert about industry trends..
Weibost
Jun, 2019
We need to know more about the Smart Home. We need to get information on market for smart kitchen and home appliances. .
Julien
Jun, 2011
I want some parts of this report for a school study. In fact, I study in an engineering school and I have to do a project of enterprise creation in home automation. .
Hamza
May, 2016
Need details on Smart Home Market by Product (Lighting Control (Timer, Daylight Sensor, Occupancy Sensor), Security & Access Control, HVAC, Entertainment, Home Healthcare and Smart Kitchen), Software & Service (Behavioral, Proactive), and Geography - Global Forecast to 2022 .
Eric
May, 2019
Focusing on investment and M&A opportunities in the Smart Home, Connected Home, Home Automation and IoT (residential/home) space. Looking at research sources to support investment strategies..
Elvis
May, 2019
I am interested in understanding the overall market my company is in and make recommendations if needed..
Manon
Apr, 2018
Hello, I am a first year master's degree student. Please could you send me the sample of the marketing study case by email (I'm very interested in the "Smart Kitchen"). .
Andrea
Apr, 2017
Good Evening, I am a Master's student, writing my dissertation about an evaluation of the smart home market. I was wondering if I could get free access to this report to include it in my academic research. .
J
Apr, 2019
This is a new industry for me, so I wonder if I can obtain more information about it. I appreciate it if you could send me a copy. .
Natasha
Mar, 2018
The robot that we offer is also incorporated with Alexa speaking interaction. Need to know how smart home devices will help us to understand our go to market strategies..
Franca
Mar, 2019
I am currently writing a thesis about Smart Homes and it would be very valuable to get the insights from this study. .
Richard
Mar, 2015
I'm interested in topline numbers for the development of the smart home market across Europe for an article I'm writing. What is the current European position in terms of smart homes devices shipped in 2018 and where those to numbers will go by 2025. .
Bryan
Feb, 2019
We are analyzing an opportunity in the smart home space and would like to better understand the breakdown of the smart home marketing by category..
Anne
Feb, 2010
Interested to know about market size for energy management devices for consumer consumption?.
Tim
Feb, 2017
We are hoping to understand who are the major companies in each of the product categories, preferably with sales figures. .
Mahmoud
Feb, 2017
Need information on Smart home Lighting control Smart Kitchen, Security, Access Control Software & Service ..
George
Jan, 2019
Need information on smart home IoT barriers. Education and benefit value proposition are real barriers to market penetration. .
Ofer
Jan, 2015
Need to know about upcoming market trends and their effects..
Monika
Jan, 2015
Need to know about market scenario for connected lighting - lighting's role and place in a smart home, consumer insights, expectations, and demand..