The study involved four major activities in estimating the market size for Synthetic Lubricants market. Intensive secondary research was done to gather information on the market, the peer market, and the parent market. The next step was to validate these findings, assumptions, and sizing with industry experts across the value chain through primary research. Both top-down and bottom-up approaches were employed to estimate the complete market size. Post that, the market breakdown and data triangulation procedures were used to estimate the market size of the segments and subsegments.
Secondary Research
Secondary sources used in this study included annual reports, press releases, and investor presentations of companies; white papers; certified publications; articles from recognized authors; and gold standard & silver standard websites such as Factiva, ICIS, Bloomberg, and others. The findings of this study were verified through primary research by conducting extensive interviews with key officials such as CEOs, VPs, directors, and other executives. The breakdown of profiles of the primary interviewees is illustrated in the figure below:
Primary Research
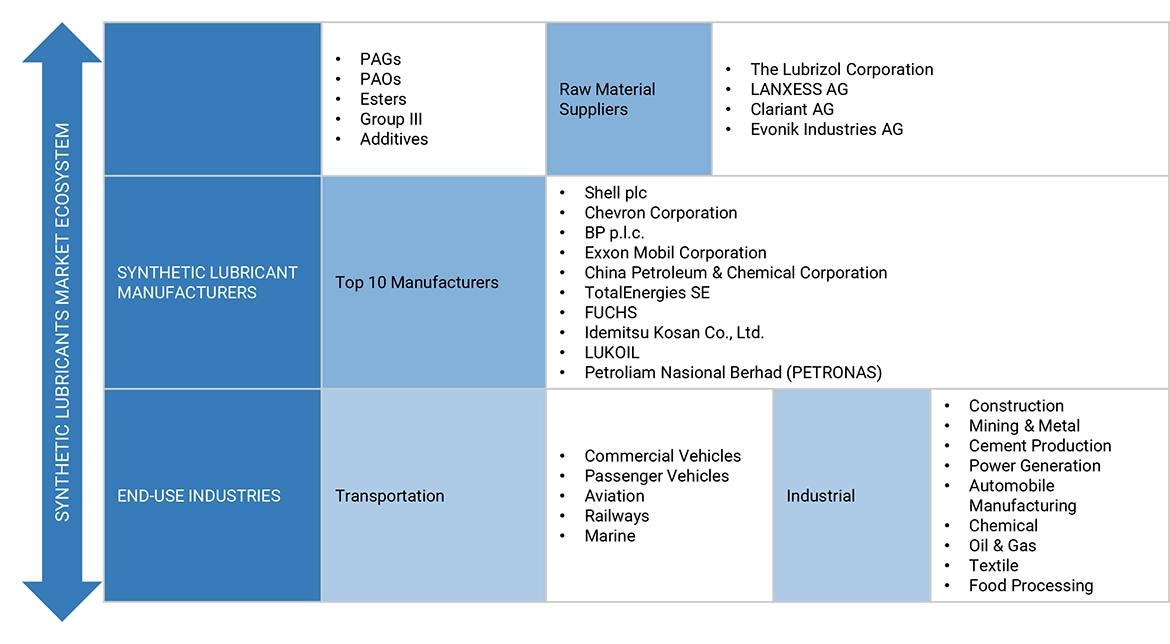
The Synthetic Lubricants market comprises several stakeholders, such as raw material suppliers, end-product manufacturers, and regulatory organizations in the supply chain. The demand side of this market is characterized from key opinion leaders in various applications for the Synthetic Lubricants market. The supply side is characterized by advancements in technology and diverse application industries. Various primary sources from both the supply and demand sides of the market were interviewed to obtain qualitative and quantitative information.
Breakdown of Primary Participants

Note: Tier 1, Tier 2, and Tier 3 companies are classified based on their market revenue in 2022 available in the public domain, product portfolios, and geographical presence.
Other designations include consultants and sales, marketing, and procurement managers.
To know about the assumptions considered for the study, download the pdf brochure
|
COMPANY NAME
|
DESIGNATION
|
|
Shell plc
|
Global Strategy & Innovation Manager
|
|
Exxon Mobil Corporation
|
Technical Sales Manager
|
|
BP p.l.c,
|
Senior Supervisor
|
|
Chevron Corporation
|
Production Supervisor
|
|
China Petroleum & Chemical Company
|
Production Manager
|
Market Size Estimation
Both top-down and bottom-up approaches were used to estimate and validate the total size of the Synthetic Lubricants market. These methods were also used extensively to estimate the size of various subsegments in the market. The research methodology used to estimate the market size includes the following:
-
The key players in the industry have been identified through extensive secondary research.
-
The supply chain of the industry has been determined through primary and secondary research.
-
All percentage shares, splits, and breakdowns have been determined using secondary sources and verified through primary sources.
-
All possible parameters that affect the markets covered in this research study have been accounted for, viewed in extensive detail, verified through primary research, and analyzed to obtain the final quantitative and qualitative data.
Synthetic Lubricants Market: Bottom-Up Approach

To know about the assumptions considered for the study, Request for Free Sample Report
Synthetic Lubricants Market: Top-Down Approach

Data Triangulation
After arriving at the overall market size—using the market size estimation processes as explained above—the market was split into respective segments and subsegments. To realize the overall market engineering process and arrive at the exact statistics of each market segment and subsegment, the data triangulation, and market breakdown procedures were employed, wherever applicable. The data was triangulated by studying several factors and trends from both the demand and supply sides in the Synthetic Lubricants industry.
Market Definition
Synthetic oil is a lubricant consisting of chemical compounds that are artificially modified or synthesised. In addition to being made from different source materials, synthetic lubricants can also be produced from complete crude oil by utilising chemically altered petroleum components. But the majority of the starting material is still crude oil, which is distilled before being physically and chemically altered. Synthetic lubricants are engineered to provide superior performance characteristics compared to conventional mineral-based lubricants.
Key Stake Holders
-
Synthetic Lubricants’ manufacturers
-
Raw material manufacturers
-
Government planning commissions and research organizations
-
Industry associations
-
End-use industries
-
R&D institutions
Report Objectives
-
To analyze and forecast the size of the Synthetic Lubricants market in terms of value and volume
-
To provide detailed information regarding key factors, such as drivers, restraints, challenges, and opportunities influencing the growth of the market
-
To define, describe, and segment the Synthetic Lubricants market based on type and product type
-
To forecast the size of the market segments for regions such as Asia Pacific, North America, Europe, South America, and the Middle East & Africa
-
To strategically analyze the segmented markets with respect to individual growth trends, prospects, and contribution to the overall market
-
To identify and analyze opportunities for stakeholders in the market
-
To strategically profile key players and comprehensively analyze their core competencies
Available Customizations
Along with the given market data, MarketsandMarkets offers customizations according to the company’s specific needs. The following customization options are available for the report:
Regional Analysis
-
Further breakdown of a region with respect to a particular country or additional product type or type
Company Information
-
Detailed analysis and profiles of additional market players (up to five)


Sabine
Jan, 2019
General information on specialty lubricants market.
Othmane
Dec, 2019
Interested in knowing all the lubricant blending plants in West Africa, except for Nigeria .
Anil
Apr, 2019
Interested in formulations of Synthetic and Semi-synthetic lubricants manufacturing in India..
GANAPATHYKRISHNAN
May, 2022
Interested in details of synthetic oil used for refrigeration industry. .
Raymond
May, 2016
Information on lubricants used in air conditioning and refrigeration, and the name of the supplier of auto a/c lubricants and their market share..
Koji
Jan, 2019
Market information Global Engine Oil, Hydraulic Fluids, Gear Oil and Transmission Fluids market.