
Heat Transfer Fluids Market

Heat Transfer Fluids Market by Product Type (Mineral Oils, Synthetic Fluids, Glycol-Based Fluids, Other Product Types), Temperature (Low, Medium, High, Ultra-High), Application (Industrial Process Heating, Thermal Energy Storage, Chilled/Hot Water Loops, Pharmaceutical & Biotech, Power Generation & Waste Heat Recovery, Thermal Management, Other Applications), End-Use Industry (Chemical & Petrochemicals, Oil & Gas, Automotive, Food & Beverage, Pharmaceuticals, Hvac, Renewable Energy, Other End-Use Industries), and Region - Global Forecast to 2030


HEAT TRANSFER FLUIDS MARKET SIZE
Source: Secondary Research, Interviews with Experts, MarketsandMarkets Analysis | Updated on : April 28, 2026
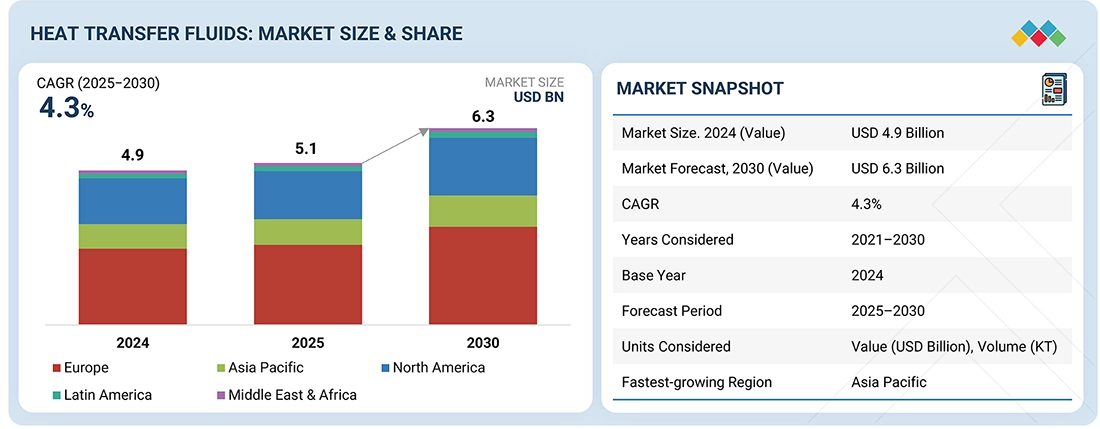
The global heat transfer fluids market size is projected to grow from USD 5.1 billion in 2025 to USD 6.3 billion by 2030, registering a CAGR of 4.3% from 2025 to 2030. This expansion is supported by the increasing importance of efficient thermal management across a broad spectrum of industries.
KEY TAKEAWAYS
-
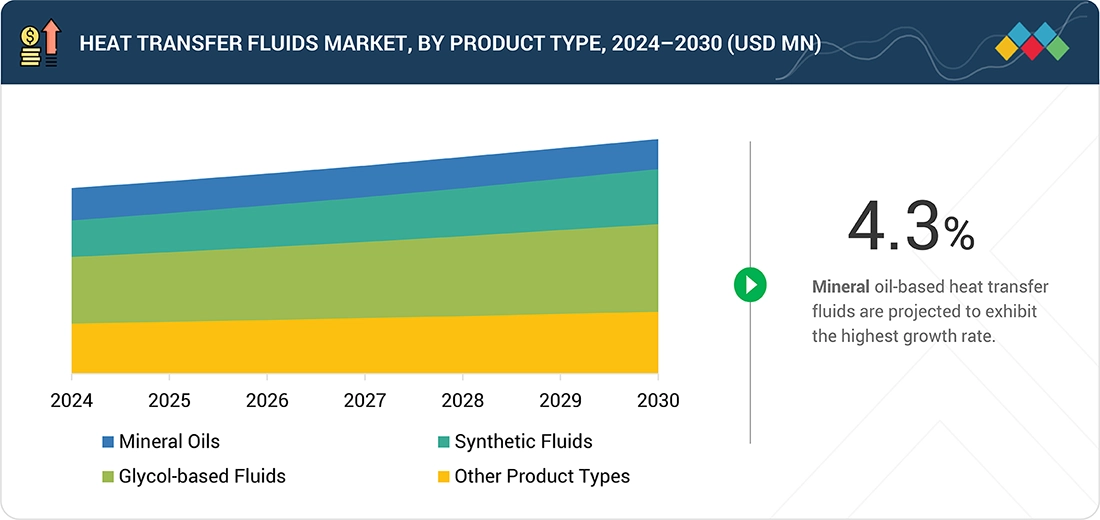
BY Product typeMineral oils are estimated to be the largest subsegment in the heat transfer fluids (HTF) market due to several key advantages that make them a preferred choice across various industries. Mineral oils are significantly cheaper compared to synthetic fluids and glycol-based fluids, making them an economical option for companies looking to optimize their operational budgets without compromising performance.
-
By temperatureThe growth of low-temperature heat transfer fluids (HTFs) is the highest in recent years, primarily due to the rapid expansion of industries that require reliable performance in sub-zero and cryogenic environments. The global cold chain sector, driven by rising demand for frozen food, pharmaceuticals, and vaccine storage, has significantly boosted the adoption of HTFs capable of operating efficiently at very low temperatures. Similarly, the surge in liquefied natural gas (LNG) projects, including regasification and liquefaction plants, has created strong demand for these fluids, as they are essential for handling extreme thermal conditions.
-
By End-use industryThe chemicals and petrochemicals industry is estimated to be the largest end-use segment for the heat transfer fluids (HTF) market due to its extensive and continuous demand for precise thermal management solutions. This sector encompasses a wide range of processes, such as distillation, polymerization, and chemical synthesis, which require accurate temperature control to maintain product quality and process efficiency. Heat transfer fluids are essential in these processes for maintaining optimal reaction conditions, ensuring process safety, and enhancing energy efficiency.
-
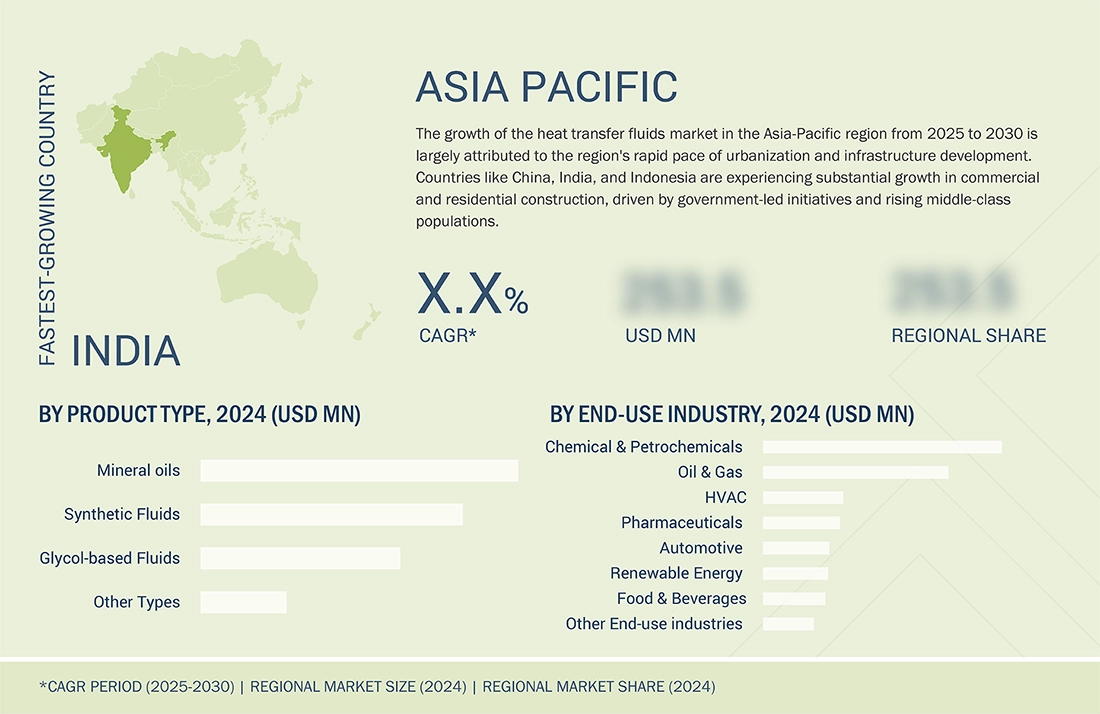
By regionAsia Pacific is estimated to be the largest market for heat transfer fluids (HTFs) due to a confluence of several key factors, including rapid industrialization, robust economic growth, and the presence of significant end-use industries. This region's dynamic economic landscape and ongoing industrial expansion have created substantial demand for efficient thermal management solutions across various sectors. Rapid industrialization in countries like China, India, and Japan has driven the demand for HTFs.
-
COMPETITIVE LANDSCAPEThe heat transfer fluids market is driven by product innovation, capacity expansions, and strategic collaborations among global leaders such as Dow (US), Eastman Chemical Company (US), ExxonMobil (US), Chevron Corporation (US), Huntsman Corporation (US), Shell plc (UK), Lanxess (Germany), Clariant (Switzerland), Wacker Chemie AG (Germany), Indian Oil Corporation Ltd. (India), and Schultz Canada Chemicals Ltd. (Canada). These companies are focusing on developing advanced fluids with improved acoustic, safety, and thermal properties to cater to the growing demand from petrochemical industries.
The heat transfer fluids market is growing steadily, driven by industrial processes becoming more advanced and energy-intensive. The need for reliable systems to regulate temperature has grown substantially. Traditional methods of cooling and heating are proving inadequate in many cases, creating strong demand for HTFs that provide greater efficiency, stability, and safety. These fluids are no longer viewed as auxiliary materials but as critical enablers of operational performance, energy savings, and compliance with modern industrial standards.
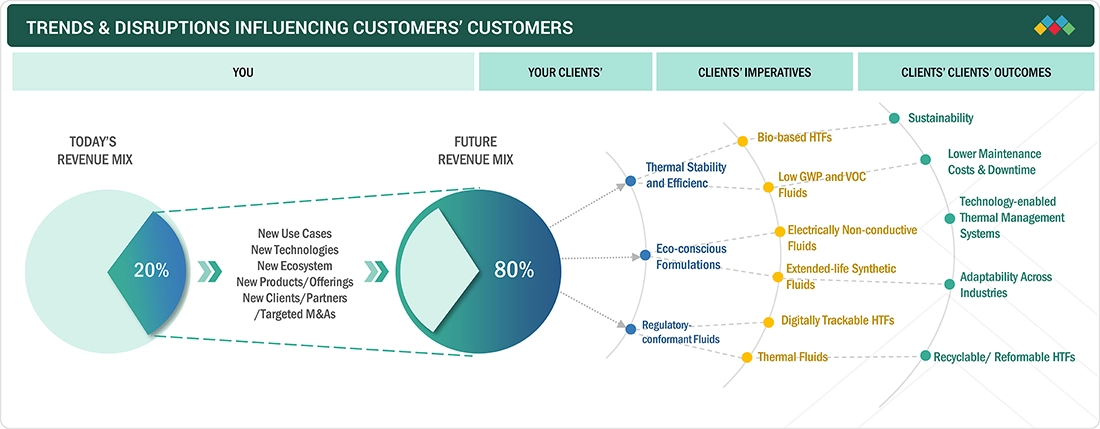
TRENDS & DISRUPTIONS IMPACTING CUSTOMERS' CUSTOMERS
The heat transfer fluid industry is undergoing a significant transformation, shifting from 80% revenue reliance on existing products to an expected 80% from new technologies within 4–5 years. Key sectors driving this change include data center cooling, electric vehicle thermal management, and chemical & pharmaceutical processing. These sectors prioritize sustainability, energy efficiency, and safety, aiming for outcomes like enhanced energy capture, lightweight vehicles with better fuel efficiency, and reduced environmental impact. This trend reflects the industry’s strategic focus on innovation and diversification, meeting evolving client needs with advanced solutions that optimize performance and environmental sustainability.
Source: Secondary Research, Interviews with Experts, MarketsandMarkets Analysis
HEAT TRANSFER FLUIDS MARKET DYNAMICS
Level
-
Increasing expansion in renewable and industrial heat applications

-
Rising adoption of immersion cooling in EVs and electronics

Level
-
Absence of standardized testing and performance criteria for EV cooling fluids

Level
-
250

-
Technological innovation in immersion and direct cooling

Level
-
68

Source: Secondary Research, Interviews with Experts, MarketsandMarkets Analysis
Driver: Increasing expansion in renewable and industrial heat applications
Expansion in renewable and industrial heat applications is one of the most important drivers for the growth of the heat transfer fluids (HTFs) industry. On the renewable side, the increasing global shift toward clean energy has amplified investments in technologies such as concentrated solar power (CSP), solar thermal systems, and other renewable energy projects that require reliable heat storage and transfer solutions. HTFs play a critical role in these systems by enabling efficient capture, storage, and distribution of thermal energy, which helps maximize output and improve overall energy conversion efficiency. The growing emphasis on reducing carbon emissions and meeting sustainability goals has further accelerated the adoption of advanced HTFs, particularly synthetic and molten salt-based fluids, capable of withstanding extreme temperatures in renewable energy applications.
Restraint: absence of standardized testing and performance criteria for EV cooling fluids
The absence of standardized testing and performance criteria for EV cooling fluids is emerging as a key restraint for the heat transfer fluids (HTFs) market. As electric vehicles (EVs) continue to expand rapidly, the demand for efficient thermal management systems has become critical to ensure battery safety, performance, and longevity. EV cooling fluids, a specialized class of HTFs, are designed to regulate battery pack temperatures, maintain optimal operating conditions, and prevent overheating or thermal runaway. However, unlike traditional automotive coolants or industrial HTFs, there is no universally accepted standard or benchmark to evaluate the performance, safety, or compatibility of these fluids across different vehicle platforms and chemistries. This lack of harmonization creates uncertainty for both manufacturers and end users, making it difficult to compare products, validate long-term reliability, and ensure consistent quality across the market.
Opportunity: Customized, application-specific formulations in the HTF industry
The trend of customized, application-specific formulations represents a significant opportunity for the heat transfer fluids (HTFs) market because it allows manufacturers to move beyond standard offerings and create value-added, high-margin products tailored to niche requirements. As industries diversify and technologies evolve, one-size-fits-all HTFs are increasingly insufficient to meet the unique performance, safety, and regulatory needs of different applications. This creates room for HTF producers to collaborate directly with end-users—such as solar plant developers, EV manufacturers, chemical processors, and data center operators—to develop fluids optimized for their exact operating conditions.
Challenge: Balancing performance with environmental compliance
Balancing performance with environmental compliance poses a major challenge in the heat transfer fluids (HTFs) industry because high thermal stability and efficiency often conflict with sustainability requirements. Traditional HTFs, such as mineral oils and synthetic aromatics, are widely used due to their excellent heat transfer efficiency, high temperature resistance, and cost-effectiveness. However, many of these fluids are toxic, non-biodegradable, or environmentally persistent, making them increasingly difficult to use under today’s strict regulations on emissions, waste management, and chemical safety.
Heat Transfer Fluids Market: COMMERCIAL USE CASES ACROSS INDUSTRIES
| COMPANY | USE CASE DESCRIPTION | BENEFITS |
|---|---|---|
 |
Use of HTFs in concentrated solar power (CSP) plants | Efficient thermal energy storage, improved solar plant output, contribution to renewable energy adoption, reduced carbon footprint |
 |
Application in oil & gas processing (refineries, LNG, petrochemicals) | Reliable high-temperature performance, enhanced process efficiency, safe handling of extreme conditions, reduced operational downtime |
 |
HTFs in chemical and industrial manufacturing (plastics, polymers, pharmaceuticals) | Precise temperature control, consistent product quality, reduced energy consumption, improved process safety |
 |
Use of HTFs in food & beverage processing (cold storage, refrigeration, beverage cooling) | Compliance with food safety standards, stable low-temperature performance, improved product shelf life, energy-efficient cooling |
 |
Adoption in data centers and electronics cooling | Advanced thermal management, prevention of overheating, extended equipment lifespan, improved energy efficiency and cost savings |
Logos and trademarks shown above are the property of their respective owners. Their use here is for informational and illustrative purposes only.
HEAT TRANSFER FLUIDS MARKET ECOSYSTEM
The heat transfer fluids ecosystem analysis involves identifying and analyzing interconnected relationships among various stakeholders, including raw material suppliers, manufacturers, distributors, and end users. The raw material suppliers provide synthetic fluids and mineral oil to manufacturers. The distributors and suppliers establish contact between the manufacturing companies and end users to streamline the supply chain, increasing operational efficiency and profitability.
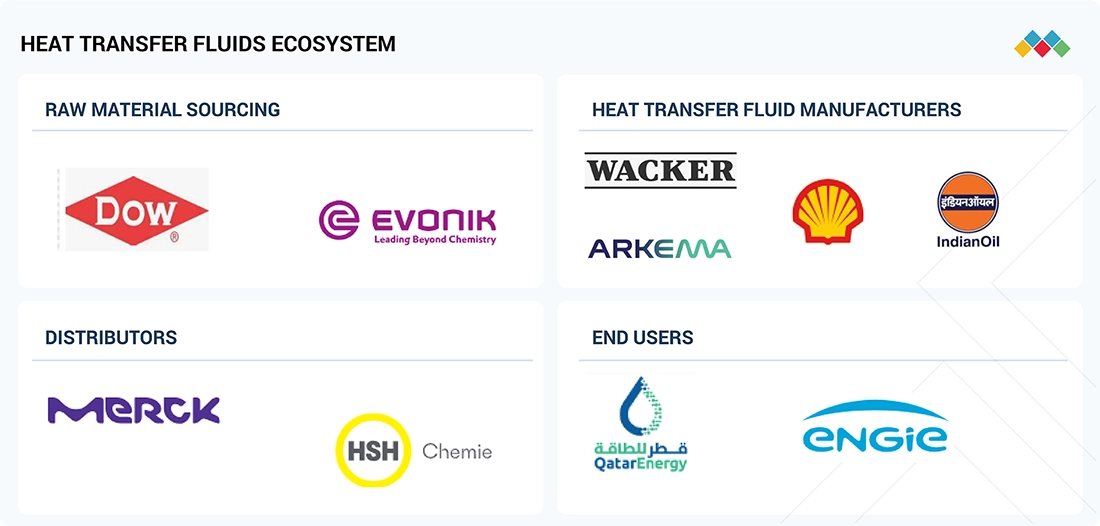
Logos and trademarks shown above are the property of their respective owners. Their use here is for informational and illustrative purposes only.
MARKET SEGMENTS
Source: Secondary Research, Interviews with Experts, MarketsandMarkets Analysis
Heat transfer fluids Market, By temperature Type
Low-temperature heat transfer fluids (HTFs) have emerged as the fastest-growing segment in recent years, largely driven by the increasing demand from industries that operate in sub-zero and cryogenic conditions. The rapid expansion of the global cold chain—fueled by the rising need for frozen food, pharmaceutical products, and vaccine storage—has significantly accelerated the adoption of HTFs designed for efficient low-temperature performance. At the same time, the growth of liquefied natural gas (LNG) infrastructure, particularly in regasification and liquefaction facilities, has boosted the need for these fluids to ensure safe and reliable operation under extreme thermal environments.
Polyvinyl butyral market, By End use industry
The chemical and petrochemical sector is the largest and fastest-growing segment in the heat transfer fluids (HTFs) market because it relies heavily on precise thermal management for a wide range of processes. In this industry, operations such as distillation, polymerization, condensation, refining, and cracking require stable, high-performance fluids that can withstand extreme temperatures while ensuring safety and efficiency. The rapid expansion of the global chemical industry, particularly in Asia-Pacific countries like China and India, has amplified demand for HTFs to support rising production capacities in plastics, fertilizers, and specialty chemicals.
REGION
Asia Pacific to be fastest-growing region in global heat transfer fluids market during forecast period
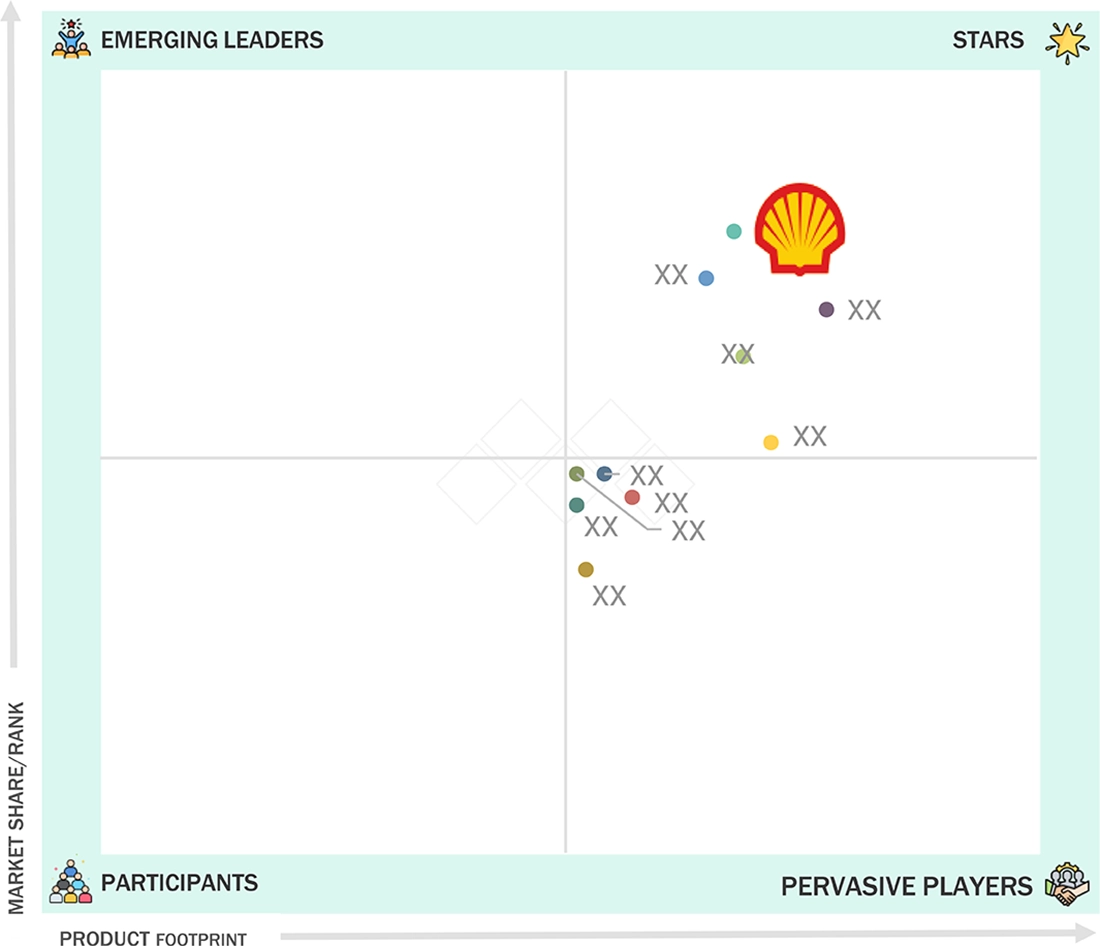
Heat Transfer Fluids Market: COMPANY EVALUATION MATRIX
In the heat transfer fluids (HTFs) market matrix, Shell plc (Star) leads with its strong global presence, diversified product portfolio, and well-established supply chain, catering to a wide spectrum of industrial applications including petrochemicals, oil & gas, and renewable energy. Eastman Chemical Company (Strong Performer) continues to expand its footprint through innovative HTF formulations designed for efficiency and environmental compliance, making it a preferred choice in chemical processing and solar energy systems. Meanwhile, Dow Inc. (Emerging Leader) is gaining visibility with advanced synthetic fluids that deliver superior thermal stability and energy efficiency, strengthening its position across high-growth segments such as electronics cooling and concentrated solar power. While Shell dominates with scale and global reach, Eastman and Dow showcase strong potential to move further up the leadership quadrant as demand for energy-efficient and sustainable thermal management solutions accelerates worldwide.
Source: Secondary Research, Interviews with Experts, MarketsandMarkets Analysis
KEY MARKET PLAYERS
MARKET SCOPE
| REPORT METRIC | DETAILS |
|---|---|
| Market Size, 2024 (Value) | USD 4.9 Billion |
| Market Forecast, 2030 (Value) | USD 6.3 Billion |
| Growth Rate | CAGR of 4.3% from 2025 to 2030 |
| Study Period | 2021–2030 |
| Base Year | 2024 |
| Forecast Period | 2025–2030 |
| Units Considered | Value (USD Billion), Volume (Kilotons) |
| Report Coverage | Revenue forecast, company ranking, competitive landscape, growth factors, and trends |
| Segments Covered |
|
| Regions Covered | North America, Asia Pacific, Europe, South America, Middle East & Africa |
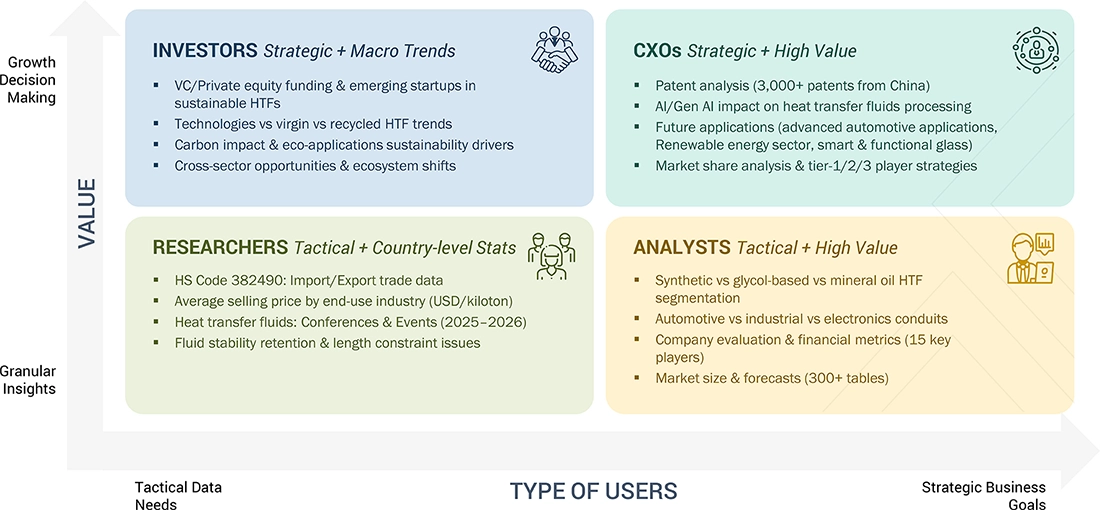
WHAT IS IN IT FOR YOU: Heat Transfer Fluids Market REPORT CONTENT GUIDE
DELIVERED CUSTOMIZATIONS
We have successfully delivered the following deep-dive customizations:
| CLIENT REQUEST | CUSTOMIZATION DELIVERED | VALUE ADDS |
|---|---|---|
| Country-Level Breakdown | • Instead of just regional coverage, the report can provide country-specific market data (e.g., China, India, the US, and Germany). This includes demand drivers, production capacities, import/export trends, and regulatory outlooks. | 250 |
| Application-Specific Deep Dive | • It can offer a customized focus on specific HTF applications such as solar thermal systems, data center cooling, or industrial heat exchangers, including end-user adoption rates, OEM partnerships, and future demand projections for each application. | • Supports clients targeting niche segments, enabling them to design product portfolios or allocate R&D spending more effectively |
| Fluid Type Customization | • Comparative analysis of synthetic, glycol-based, and mineral oil HTFs, as well as modified grades was offered. This covered performance benchmarks, technical advantages, pricing, and suitability for different industries. | • Enables manufacturers and buyers to optimize fluid selection, align pricing with performance, and explore premium-grade opportunities |
| Competitive Benchmarking | • It can offer extended profiling of regional and niche players alongside global leaders (e.g., Dow, Chevron, Therminol), including SWOT analysis, product differentiation, technology focuses, and market positioning. | • Provides a clear competitive landscape, helping clients identify potential partners, acquisition targets, or competitive threats |
RECENT DEVELOPMENTS
- December 2022 : Eastman Chemical Company (US) and Krahn Chemie GmbH (KRAHN), (Greece) revised their distribution agreement to extend the market reach for Eastman’s heat transfer fluids (HTF) in southeastern Europe. Under the revised agreement, KRAHN was authorized to distribute Eastman’s Therminol® and Marlotherm® product lines throughout Greece. These fluids were designed for the indirect transfer of process heat in a variety of single- or multiple-use heat systems. They are known for their outstanding thermal stability, precise temperature control, and minimal maintenance requirements.
- December 2022 : Chevron completed the acquisition of the Renewable Energy Group. This acquisition would help company leverage its strengths to deliver lower carbon energy.
- July 2022 : Eastman Chemical Company announced a planned expansion of its manufacturing capacity for Eastman Therminol® 66 heat transfer fluid in Anniston, Alabama. The expansion, slated for completion in 2024, boosted US-based capacity for this product by 50%.
Table of Contents
 Exclusive indicates content/data unique to MarketsandMarkets and not available with any competitors.
Methodology
The study involved four main activities to estimate the market size of the heat transfer fluids market. Extensive secondary research was conducted to gather information on the market, peer, and parent markets. The next step was to validate these findings, assumptions, and estimates with industry experts across the value chain through primary research. Both top-down and bottom-up approaches were used to determine the overall market size. Subsequently, market breakdown and data triangulation methods were applied to estimate the sizes of segments and subsegments.
Secondary Research
In the secondary research process, various sources were referenced to identify and gather information for this study. These sources include annual reports, press releases, investor presentations, white papers, verified publications, trade directories, articles from reputable authors, trusted websites, and databases. Secondary research was used to gather essential details about the industry’s value chain, the market’s monetary chain, the overall market for key heat transfer fluids, their classification, and segmentation based on industry trends down to the regional level. It also provided insights into major developments from a market-oriented perspective.
Primary Research
The heat transfer fluids market involves several stakeholders in the value chain, including raw material suppliers, manufacturers, and end users. Various primary sources from both the supply and demand sides of the heat transfer fluids market have been interviewed to gather both qualitative and quantitative information. Key opinion leaders in end-use sectors serve as primary demand-side interviewees. On the supply side, primary sources include manufacturers, associations, and institutions involved in the heat transfer fluids industry.
Primary interviews were conducted to gather insights such as market statistics, data on revenue generated from products and services, market breakdowns, market size estimates, market forecasting, and data triangulation. Primary research also helped in understanding various trends related to product type, temperature, end-use industry, application, and region. Stakeholders from the demand side, such as CIOs, CTOs, and CSOs, were interviewed to understand the buyer’s perspective on suppliers, products, component providers, and their current and future use of the heat transfer fluids market, which will influence the overall market.
The breakdown of profiles of the primary interviewees is illustrated in the figure below:

Note: Tier 1, Tier 2, and Tier 3 companies are classified based on their market revenue in 2024 available in the public domain, product portfolios, and geographical presence.
Other designations include sales representatives, production heads, and technicians.
To know about the assumptions considered for the study, download the pdf brochure
Market Size Estimation
The top-down approach was used to estimate and validate the size of various submarkets for the heat transfer fluids market. The research methodology used to estimate the market size included the following steps:
- The key players in the industry have been identified through extensive secondary research.
- The supply chain of the industry has been mapped through both primary and secondary research.
- All percentage shares, splits, and breakdowns based on product type, temperature, application, end-use industry, and region were determined using secondary sources and verified through primary sources.
- All potential parameters influencing the markets covered in this study were thoroughly examined, validated through primary research, and analyzed to obtain final quantitative and qualitative data. This data was compiled, enriched with detailed inputs and analysis, and presented in this report.

Data Triangulation
After estimating the total market size for heat transfer fluids, the overall market has been divided into several segments and sub-segments. Data triangulation and market breakdown methods have been used where applicable to complete the market analysis and obtain accurate data for all parts. The data was triangulated by examining various factors and trends from both demand and supply sides. Additionally, the market size was validated using both top-down and bottom-up approaches, along with primary interviews. For each data segment, three sources were used—top-down approach, bottom-up approach, and expert interviews. The data was considered accurate when the values from these three sources matched.
Market Definition
Heat transfer fluids (HTFs) are specialized liquids or gases designed to transfer thermal energy efficiently between systems, components, or processes. They ensure precise heating, cooling, or temperature regulation in applications where direct heat exchange is impractical or unsafe. Built to operate across a wide temperature range from cryogenic to extremely high temperatures, they maintain stability, safety, and efficiency. This makes them essential in industries such as chemicals, oil and gas, food and beverage, pharmaceuticals, automotive, HVAC, and renewable energy.
The heat transfer fluids market has a wide global reach, with Asia Pacific leading due to high automotive production and significant construction activity in countries like China, India, Japan, and South Korea. North America and Europe are the next largest markets, driven by technological advancements, infrastructure investments, and essential environmental and safety regulations. Additionally, some emerging markets in South America and the Middle East & Africa are experiencing moderate growth due to urbanization and increased industrial uses.
Stakeholders
- Heat transfer fluid manufacturers
- Heat transfer fluid traders, distributors, and suppliers
- Raw material suppliers
- Government and private research organizations
- Associations and industrial bodies
- R&D institutions
- Environmental support agencies
Report Objectives
- To define, describe, and forecast the size of the heat transfer fluids market, in terms of value and volume
- To provide detailed information regarding the major factors (drivers, opportunities, restraints, and challenges) influencing the growth of the market
- To estimate and forecast the market size based on product type, temperature, application, end-use industry, and region
- To forecast the size of the market with respect to major regions, namely, North America, Europe, the Middle East & Africa, and South America, along with their key countries
- To strategically analyze micromarkets with respect to individual growth trends, prospects, and their contribution to the overall market
- To analyze opportunities in the market for stakeholders and provide a competitive landscape of market leaders
- To track and analyze recent developments such as partnerships, agreements, joint ventures, collaborations, announcements, awards, and expansions in the market
- To strategically profile key market players and comprehensively analyze their core competencies
Key Questions Addressed by the Report
What is the expected growth rate of the heat transfer fluids market?
The market is expected to grow at a CAGR of 4.3% in terms of value during the forecast period.
Who are the key players in the heat transfer fluids market?
Leading players include Dow (US), Eastman Chemical Company (US), ExxonMobil (US), Chevron Corporation (US), Huntsman Corporation (US), Shell PLC (UK), Lanxess (Germany), Clariant (Switzerland), Wacker Chemie AG (Germany), Indian Oil Corporation Ltd. (India), and Schultz Canada Chemicals Ltd. (Canada).
What are the emerging trends in the heat transfer fluids market?
Key trends include the development of high-performance synthetic fluids, increased adoption of bio-based and environmentally friendly fluids, integration of advanced monitoring systems for real-time performance tracking, and growing use of HTFs in renewable energy applications such as solar and wind power.
What are the drivers and opportunities for the heat transfer fluids market?
The market is driven by global industrialization and urbanization, demand for energy-efficient solutions, and advancements in HTF technologies. Opportunities arise from the growing renewable energy sector and supportive government initiatives.
What are the restraining factors in the heat transfer fluids market?
Stringent regulatory requirements and volatility in raw material prices are key factors restraining market growth.
Need a Tailored Report?
Customize this report to your needs
Get 10% FREE Customization
Customize This ReportPersonalize This Research
- Triangulate with your Own Data
- Get Data as per your Format and Definition
- Gain a Deeper Dive on a Specific Application, Geography, Customer or Competitor
- Any level of Personalization
Let Us Help You
- What are the Known and Unknown Adjacencies Impacting the Heat Transfer Fluids Market
- What will your New Revenue Sources be?
- Who will be your Top Customer; what will make them switch?
- Defend your Market Share or Win Competitors
- Get a Scorecard for Target Partners

Custom Market Research Services
We Will Customise The Research For You, In Case The Report Listed Above Does Not Meet With Your Requirements
Get 10% Free CustomisationTESTIMONIALS

We at Nissan Chemicals Corporation have been clients of MarketsandMarkets for more than a year now. We recently consulted MarketsandMarkets for a study, the team at MarketsandMarkets was extremely professional and organized. The business insights were very detailed and aligned well with our expectations that really helped us formulate the Business Plans and device new strategies for development themes. MarketsandMarkets offers a unique combination of expertise and dedicated engagement model. Their research findings have helped us in designing our Pricing Strategy which will make it easier for us to predict the future sales and profits for the next ten years. We look forward to working with MarketsandMarkets in the future.
VP of Strategy & New Business Development
Leading Specialty Chemical Company
The MarketsandMarkets Engagement Model, composed of both the Knowledge Store and advisory custom research, has greatly helped us in understanding our markets and making strategic decisions. The Knowledge Store is a fast way to allow everyone in our organization to understand more about most any market they are interested in. The ability to then get custom research done and get answers to specific strategic questions and market insight has been spectacular. The Markets and Markets team feel more like colleagues than vendors and their services have helped us change our culture where statements of things like growth opportunities and competitive position are always backed by industry research.

Rich Gibson,
Director, Corporate Strategy
Milliken & Company,
Leading Industrial Manufacturer of specialty chemical, floor covering, performance and protective textile materials, and healthcaremilliken.com
MarketsandMarkets is a trusted resource that helps us to better understand markets that are near-adjacencies-whether its technology, value chain or geography. Their Knowledge Store platform provides a dashboard of markets and their characteristics which is easy to use and saves us time.
Adam Shaw,
Market Development and Strategy Manager
AdvanSix Inc. USA,
An American Leader in Chemicalswww.advansix.com
The Knowledge Store from MarketsandMarkets is a valuable tool which has helped my team acquire greater insight in to the end markets that our business serves. This has enabled us to help our company build stronger strategies throughout our planning process.
TOSHIO KINOSHITA
Senior Chif Consultion Research & Consulting Division
Mitsubishi Chemical Research Corporation,
Leading Manufacturer of Chemical Productswww.mitsubishichem-res.co.jp/en/

We recently engaged with MarketsandMarkets for a study, the team not only clearly understood our business objectives but was also extremely professional in the way they handled the entire project. The study was efficiently conducted in a phase-wise manner, and the engagement model furnished us with high-quality business insights that far exceeded our expectations at each phase. We were especially happy that MarketsandMarkets could provide us with both, an English as well as a Japanese version of the study. A special thanks to the Analyst Team and Client Services Team, whose fluency in Japanese enhanced our comfort level, as we could converse with them in our preferred language.
Independent entrepreneurs
Arrow Precision
We approached MarketsandMarkets for study on Proppants Market, and their work exceeded our expectations. The study conducted was comprehensive and enabled us to view the market through the various dimensions. In addition, the team was extraordinarily responsive throughout the process and resolved our queries on time. I strongly recommend MarketsandMarkets and will certainly consider them for additional market assessments we will need in the future.
Global engineering company, Japan
Deputy Manager,
Strategic Planning OfficeThe high-quality insights shared by the MarketsandMarkets team helped us understand the pharmaceutical plant designers in a specific geography. It also captured the risks that we may likely face in communicating with our potential partners. The study would enable us identify partners, which would impact our future growth.
Growth opportunities and latent adjacency in Heat Transfer Fluids Market


Caroline
Nov, 2017
Market overview and dynamics.
Seungyoon
Jun, 2019
General information on Heat Transfer Fluid and Synthetic market .
Caroline
Feb, 2016
General information on Heat Transfer Fluids Market.
Gabriella
Aug, 2019
General information on Heat Transfer Fluids.
Gabriella
Aug, 2019
Market growth trends and major company profiles along with the strategies adopted by key players present in the market.
Kevin
Dec, 2014
Heat transfer fluids by application segment, i.e. HVAC, Oil and Gas, Automotive, etc..
Roshan
Feb, 2019
General information on Heat Transfer Fluids in auomotive and power generation.
Levent
May, 2019
Detailed information of Heat Transfer Fluids Market.
Bruno
Apr, 2014
Glycol based thermal Fluids market.
Todd
Oct, 2014
General information on Heat Transfer Fluids in North America.
Miyuki
Jun, 2018
Interested in the report.
Ranjit
May, 2013
Interested in Heat (Cold) transfer fluids Market for low temp..