Tractor Implements Market by Phase (Tillage, Irrigation and Crop Protection, Sowing and Planting, Harvesting and Threshing), Drive (2-Wheel and 4-Wheel Drive), Power (Powered and Unpowered), and Region - Global Forecast to 2023


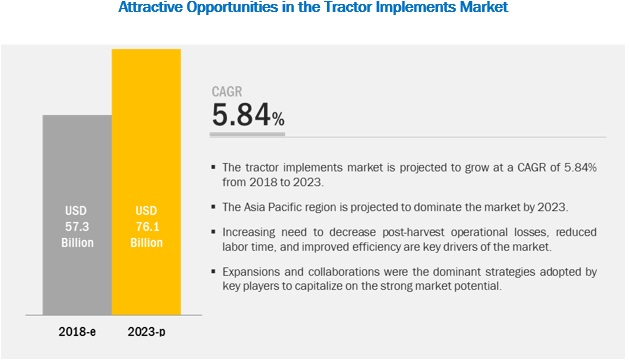
[153 Pages Report] The tractor implements market was estimated to account for USD 57.3 billion in 2018 and is expected to reach USD 76.1 billion by 2023, at a CAGR of 5.84% during the forecast period. The study includes four major activities to estimate the current market size for tractor implements. Exhaustive secondary research was done to collect information on the overall market, the peer market, and the parent market. The next step was to validate these findings, assumptions, and sizing with industry experts across value chain through primary research. Both top-down and bottom-up approaches were used to estimate the complete market size. Thereafter, market breakdown and data triangulation were used to estimate the market size of segments and subsegments.
Secondary Research
In the secondary research process, various secondary sources were referred to, to identify and collect information for this study. The secondary sources included annual reports, press releases and investor presentations of companies, white papers, certified publications, articles from recognized authors, gold & silver standard websites, regulatory bodies, trade directories, and databases.
Secondary research was mainly used to obtain key information about the industry’s supply chain, the market’s monetary chain, key players, and the market classification and segmentation according to the industry trends to the bottom-most level, and geographical markets. It has also been used to obtain information on key developments from a market-oriented perspective.
Primary Research
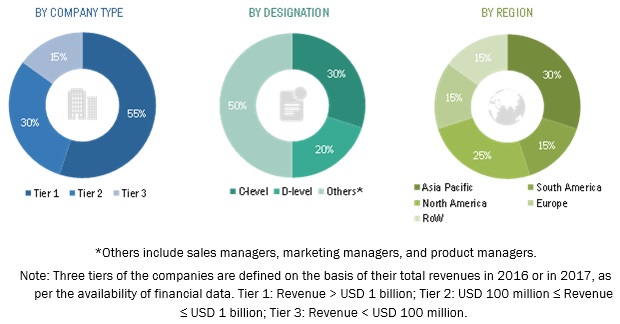
The market comprises several stakeholders in the supply chain, which include manufacturers and suppliers of tractor implements and parts. Primary sources from both, the supply and demand sides of the market were interviewed to obtain the qualitative and quantitative information. The primary interviewees from the demand side include research institutions involved in R&D, government agencies, and industry associations. The primary sources from the supply side include tractor implement manufacturers, raw material suppliers, and key opinion leaders.
To know about the assumptions considered for the study, download the pdf brochure
Market Size Estimation
Both top-down and bottom-up approaches were used to estimate and validate the total size of the market. These approaches were also used extensively to estimate the size of various dependent submarkets. The research methodology used to estimate the market size includes the following:
- The key players in the industry and markets were identified through extensive secondary research.
- All percentage shares, splits, and breakdowns were determined using secondary sources and verified through primary sources.
- All the possible parameters that affect the markets covered in this research study was conducted in extensive detail, verified through primary research, and analyzed to obtain the final quantitative and qualitative data.
- Research included the study of the reports, reviews, and newsletters of top market players along with extensive interviews for opinions from leaders such as CEOs, directors, and marketing executives.
Data Triangulation
After arriving at the overall market size from the estimation process explained above, the total market was split into several segments and subsegments. In order to arrive at the exact statistics for all segments and subsegments, the data triangulation and market breakdown procedures were employed wherever applicable. The data was triangulated by studying various factors and trends from both the demand and supply sides. Along with this, the market was validated using both top-down and bottom-up approaches.
Report Objectives
- Determining and projecting the size of the tractor implements market with respect to its phase, power, drive, and regional markets, over a five-year period ranging from 2018 to 2023
- Identifying attractive opportunities in the market by determining the largest and fastest-growing segments across regions
-
Analyzing the demand-side factors on the basis of the following:
- Impact of macro- and micro-economic factors on the market
- Shifts in the demand patterns across different subsegments and regions
-
Identifying and profiling key market players in the tractor implements market on the basis of the following:
- Product offering
- Business strategies
- Strengths, weaknesses, opportunities, and threats
- Key financials
- Understanding the competitive landscape for a comparative analysis of market leaders and identifying the key market shareholders across the industry.
- Analyzing regulatory frameworks across regions and their impact on prominent market players
- Providing insights on key investments in product innovations and technology
Scope of Report
|
Report metric |
Details |
|
Market sizes available for years |
2016-2023 |
|
Base year considered |
2017 |
|
Forecast period |
2018-2023 |
|
Forecast units |
Value (USD) |
|
Segments covered |
Phase, Power, Drive, and Region |
|
Geographies covered |
North America, Asia Pacific South America, Europe, and RoW |
|
Companies covered |
Deere & Company (US), Kubota Corporation (Japan), AGCO (US), Mahindra and Mahindra (India), SDF (Italy), Kuhn Group (France) |
This research report categorizes the tractor implements market based on phase, power, drive, and region.
On the basis of phase, the market has been segmented as follows:
- Tillage
- Irrigation and crop protection
- Sowing and planting
- Harvesting and threshing
- Others (Loading, packing, and on-field processing equipment)
On the basis of power, the market has been segmented as follows:
- Powered
- Unpowered
On the basis of drive, the market has been segmented as follows:
- 2-wheel drive
- 4-wheel drive
On the basis of region, the market has been segmented as follows:
- North America
- South America
- Europe
- Asia Pacific
- RoW (Africa and the Middle East)
Available Customizations
With the given market data, MarketsandMarkets offers customizations according to the company’s specific scientific needs.
The following customization options are available for the report:
Product Analysis:
- Product Matrix, which gives a detailed comparison of the product portfolio of each company
Geographic Analysis
- Further breakdown of the Rest of Europe tractor implements market into Poland and Ukraine
- Further breakdown of the Rest of Asia Pacific tractor implement market into Australia, South Korea, and Thailand
- Further breakdown of the Rest of South America tractor implements market into Colombia and Chile
Company Information
- Detailed analyses and profiling of additional market players (up to five)
High labor cost in the agriculture industry and the need to prevent post-harvest food losses are the major factors driving the tractor implements market.
On the basis of power, the powered segment is projected to witness the fastest growth during the forecast period.
The growing awareness about the benefits of powered equipment that are attached to tractors has encouraged farmers to use these implements in the fields. Powered tractor implements require mechanical and electrical power for its movement, which makes it more effective in performing various tasks during each farming phase as compared to using unpowered machineries.
On the basis of drive, the 4-wheel segment is projected to witness the fastest growth in the tractor implements market during the forecast period
There are mainly two types of tractors used by farmers in agricultural fields, which include 2-wheel-drive and 4-wheel-drive tractors. The demand for implements in 4-wheel-drive tractors is projected to remain high compared to 2-wheel-drive tractors due to the associated benefits. The 4-wheel-drive equipment has more power and efficiency compared to the other drive. Moreover, 4-wheel-drive tractors enable the end-users to attach multiple implements at the same time, due to which they remain more preferred by farmers. On the account of these factors, this segment is projected to witness the fastest growth during the forecast period.
On the basis of phase, the irrigation & crop protection segment is projected to grow at the fastest rate in the market
The irrigation & crop protection segment accounted for the second largest share and is projected to grow at the highest CAGR between 2018 and 2023. Increasing availability of exclusive machineries for harvesting, plowing, and sowing in the market, as well as sprayers and applicators as implements for tractors, are factors that are projected to reflect positively on the segment growth as compared to harvesting, tillage, and sowing segments. Hence, the demand for these implements continues to remain high compared to other tractor implements. The demand for advanced agricultural techniques for irrigation and pesticide application is also projected to fuel the growth of the irrigation & crop protection segment.
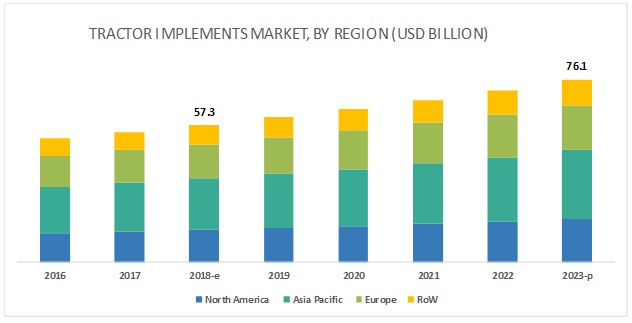
Asia Pacific is projected to dominate the tractor implements market during the forecast period
According to the FAO, the Asia Pacific region include developing countries such as India, Thailand, and Vietnam, where agriculture is growing at an exponential rate. Nearly 40% of the global arable land is present in this region. Asia Pacific region is experiencing a shift in agricultural practices from the use of traditional tools towards farm mechanization. Rising urbanization has led to limited agriculture labor in rural areas of the Asia Pacific region, which has led to an increasing need for mechanized farming techniques by investing in agricultural implements. These factors are collectively projected to drive the market for tractor implements in this region.
Key Market Players
The major players in the global market are CLAAS (Germany), Deere & Company (US), Kubota Corporation (Japan), Mahindra and Mahindra (India), Tractor and Farm Equipment Limited (India), JCB (UK), CNH Industrial (US), SDF Group (Italy), Actuant (US), Kuhn Group (France), and Alamo Group (US). These companies are focusing on introducing and manufacturing various tractor implements that are offered to farmers for speeding up their farming practices. Various strategies such as acquisitions, partnerships, and expansions were adopted by companies with regional competitors, research institutes, and academic institutions to enter this market.
Recent developments
- In October 2018, Kubota Corporation established a new distribution center in the US state of Kansas. This expansion would help the company to realign and enhance its distribution network in the US for business growth.
- In September 2018, Deere & Company acquired PLA SA, an Argentina-based company that deals with sprayer manufacturing. The acquisition would help the company in expanding its product portfolio and reaching the local farmers of Argentina with its products.
- In September 2018, Case IH, one of the major agriculture equipment brands of CNH Industrial has developed two new products, Patriot 250 Extreme, which is a self-propelled sprayer, and new Puma 185 ROPS tractor in Tech Expo Kenya. These products have new and improved features in terms of their usage and operation.
Key questions addressed by the report:
- Which market segments to focus on in the next two to five years for prioritizing efforts and investments?
- Which region has the highest share in the tractor implements market?
- Which type of tractor implements have high demand in each key country market?
- What are the trends and factors responsible in influencing the procurement of tractor implements in key emerging countries? What is the level of customization and price range preferred by the local consumers?
- Which are the key players in the market and how intense is the competition?
To speak to our analyst for a discussion on the above findings, click Speak to Analyst
 Exclusive indicates content/data unique to MarketsandMarkets and not available with any competitors.
Table of Contents
1 Introduction (Page No. - 16)
1.1 Objectives of the Study
1.2 Market Definition
1.3 Study Scope
1.4 Periodization Considered
1.5 Currency Considered
1.6 Stakeholders
2 Research Methodology (Page No. - 20)
2.1 Research Data
2.1.1 Secondary Data
2.1.2 Primary Data
2.1.2.1 Key Industry Insights
2.1.2.2 Breakdown of Primary Interviews
2.2 Market Size Estimation
2.3 Data Triangulation
2.4 Research Assumptions
2.5 Limitations
3 Executive Summary (Page No. - 28)
4 Premium Insights (Page No. - 32)
4.1 Attractive Opportunities in the Market
4.2 Market For Tractor Implements, By Phase
4.3 Asia Pacific: Market For Tractor Implements, By Key Phase & Country
4.4 Market For Tractor Implements, By Power & Region
4.5 Market For Tractor Implements, By Drive & Region
4.6 Tractor Implements Market Share, By Key Country
5 Market Overview (Page No. - 37)
5.1 Introduction
5.2 Macroindicators
5.2.1 Urbanization and Declining Agricultural Employment
5.3 Market Dynamics
5.3.1 Drivers
5.3.1.1 Effective Way to Reduce Post-Harvest On-Field Losses
5.3.1.2 High Labor Cost Due to Urbanization
5.3.1.3 High Requirement of Implements During the Land Development Phase
5.3.2 Restraints
5.3.2.1 High Equipment Cost Due to Technology Integration
5.3.2.1.1 Growth in the Market for Used Equipment
5.3.3 Opportunities
5.3.3.1 Increase in the Trend of Hiring Machineries
5.3.3.2 Integration of Technology and Smart Farming
5.3.3.3 Government Subsidiaries for Implements
5.3.4 Challenges
5.3.4.1 Small and Fragmented Fields in Developing Regions
5.4 Regulatory Framework
5.4.1 North America
5.4.1.1 Us
5.4.1.2 Canada
5.4.2 European Union
5.4.3 Uk
5.4.4 Asia Pacific
5.4.4.1 India
5.4.4.2 China
5.4.4.3 Japan
5.4.5 South America
5.4.5.1 Brazil
5.5 Patent Analysis
6 Tractor Implements Market, By Phase (Page No. - 54)
6.1 Introduction
6.2 Tillage Phase
6.2.1 Shift From Labor-Intensive and Animal-Driven Equipment to Increase the Adoption of Tractor-Mount Equipment for Tillage
6.3 Sowing and Planting Phase
6.3.1 Sowing Implements Would Help in Efficient Usage of Seed Inputs for Optimum Output Per HA
6.4 Irrigation and Crop Protection Phase
6.4.1 Large Industrial Crop Cultivation Area for Corn and Soybean Would Support the Demand for Agricultural Sprayers
6.5 Harvesting and Threshing Phase
6.5.1 Favorable Government Policies in Developing Countries to Increase the Demand for Various Types of Tractor Implements for This Phase
6.6 Others
7 Tractor Implements Market, By Power (Page No. - 62)
7.1 Introduction
7.2 Powered
7.2.1 Powered Equipment Reduces On-Field Human Efforts
7.3 Unpowered
7.3.1 Low Efficiency of Unpowered Equipment is Projected to Hinder the Market Growth
8 Tractor Implements Market, By Drive (Page No. - 66)
8.1 Introduction
8.2 2-Wheel Drive
8.2.1 Implements on 2-Wheel-Drive Tractors are Cheaper and Suitable for Small-Scale Farms in Developing Regions
8.3 4-Wheel Drive
8.3.1 High Functioning of Tractor Implements Suited for 4-Wheel-Drive Tractors is Projected to Witness Strong Growth
9 Tractor Implements Market, By Region (Page No. - 70)
9.1 Introduction
9.2 North America
9.2.1 Us
9.2.1.1 Availability of More Advanced Machinery With Customized Tractor Attachments in the Market
9.2.2 Canada
9.2.2.1 Increase in Harvested Crop Area Drives the Tractor Implements Market in Canada
9.2.3 Mexico
9.2.3.1 The Developing Phase of Agriculture Mechanization in Mexico Provides Huge Scope for the Tractor Implements Industry
9.3 Europe
9.3.1 Germany
9.3.1.1 Acceptance of Highly Advanced Technology Such as Combines and Harvesters Leads to Low Demand for Tractor-Based Implements
9.3.2 France
9.3.2.1 Adoption of Sustainable Agriculture and Precision Farming Could Favor the Development of Tractor Implements
9.3.3 UK
9.3.3.1 Increasing Area Under Industrial Crops Can Drive the Need for Higher Agricultural Operational Efficiency
9.3.4 Italy
9.3.4.1 Slower Decline in Cereal Crop Cultivation and Lower Export Demand for Agricultural Machinery are Expected to Create A Sluggish Market
9.3.5 Rest of Europe
9.4 Asia Pacific
9.4.1 India
9.4.1.1 High Implementation of Tractorization Rather Than Mechanization in India
9.4.2 China
9.4.2.1 High Investment By Key Players Drives the Chinese Tractor Implements Market
9.4.3 Japan
9.4.3.1 Decline in Agricultural Employment has Resulted in Farm Mechanization Growth in Japan
9.4.4 Rest of Asia Pacific
9.4.4.1 Low Government Contribution Results in Lack of Mechanization in Thailand’s Agricultural Sector
9.5 South America
9.5.1 Brazil
9.5.1.1 Government Subsidies to Boost the Global Market
9.5.2 Argentina
9.5.2.1 Reduction and Elimination of Export Taxes to Boost the Production in Argentina
9.5.3 Rest of South America
9.6 RoW
9.6.1 Africa
9.6.1.1 Low Agricultural Cash Income has Resulted in Low Demand for Tractor Implements in A Challenging Market Such as Africa
9.6.2 Middle East
9.6.2.1 Small Farms and Lack of Training Restrict Agricultural Mechanization in the Middle East
10 Competitive Landscape (Page No. - 108)
10.1 Overview
10.2 Company Share Analysis
10.3 Competitive Scenario
10.3.1 Mergers & Acquisitions
10.3.2 Expansions & Investments
10.3.3 Agreements, Partnerships, and Joint Ventures
11 Company Profiles (Page No. - 115)
(Business Overview, Products Offered, Recent Developments, SWOT Analysis, MnM View)*
11.1 Claas KGaA Mbh
11.2 Deere & Company
11.3 Kubota Corporation
11.4 CNH Industrial N.V.
11.5 Agco Corporation
11.6 Tractors and Farm Equipment Limited (TAFE)
11.7 SDF Group
11.8 Mahindra & Mahindra
11.9 J C Bamford Excavators Ltd. (JCB)
11.10 Actuant
11.11 Kuhn Group
11.12 Alamo Group
*Details on Business Overview, Products Offered, Recent Developments, SWOT Analysis, MnM View Might Not Be Captured in Case of Unlisted Companies.
12 Appendix (Page No. - 146)
12.1 Discussion Guide
12.2 Knowledge Store: Marketsandmarkets’ Subscription Portal
12.3 Available Customizations
12.4 Related Reports
12.5 Author Details
List of Tables (74 Tables)
Table 1 USD Exchange Rates, 2013–2017
Table 2 Average Size of Agricultural Landholding, 1995–2005
Table 3 Asabe Standards for Lighting and Marking Parameters
Table 4 List of Important Patents for Tractor-Mount Equipment, 2013–2018
Table 5 Tractor Implements Market Size, By Phase, 2016–2023 (USD Billion)
Table 6 Market Size for Tillage Phase, By Region, 2016–2023 (USD Billion)
Table 7 Market Size for Sowing and Planting Phase, By Region, 2016–2023 (USD Billion)
Table 8 Market Size for Irrigation and Crop Protection Phase, By Region, 2016–2023 (USD Billion)
Table 9 Market Size for Harvesting and Threshing Phase, By Region, 2016–2023 (USD Billion)
Table 10 Global Market Size for Others, By Region, 2016–2023 (USD Billion)
Table 11 Global Market, By Power, 2016–2023 (USD Billion)
Table 12 Powered Tractor Implements Market, By Region, 2016–2023 (USD Billion)
Table 13 Unpowered Tractor Implement Market, By Region, 2016–2023 (USD Billion)
Table 14 Market Size For Tractor Implements, By Drive, 2016–2023 (USD Billion)
Table 15 2-Wheel Drive: Tractor Implements Market Size, By Region, 2016–2023 (USD Billion)
Table 16 4-Wheel Drive: Market Size, By Region, 2016–2023 (USD Billion)
Table 17 Market Size For Tractor Implements, By Region, 2016–2023 (USD Billion)
Table 18 North America: Tractor Implements Market Size, By Country, 2016–2023 (USD Billion)
Table 19 North America: Market Size, By Phase, 2016–2023 (USD Billion)
Table 20 North America: Market Size, By Power, 2016–2023 (USD Billion)
Table 21 North America: Market Size, By Drive, 2016–2023 (USD Billion)
Table 22 US: Market Size For Tractor Implements, By Phase, 2016–2023 (USD Billion)
Table 23 US: Market Size, By Power, 2016–2023 (USD Billion)
Table 24 Canada: Tractor Implements Market Size, By Phase, 2016–2023 (USD Million)
Table 25 Canada: Market Size, By Power, 2016–2023 (USD Billion)
Table 26 Mexico: Market Size For Tractor Implements, By Phase, 2016–2023 (USD Million)
Table 27 Mexico: Market Size, By Power, 2016–2023 (USD Billion)
Table 28 Europe: Market Size For Tractor Implements, By Country, 2016–2023 (USD Billion)
Table 29 Europe: Market Size, By Phase, 2016–2023 (USD Billion)
Table 30 Europe: Market Size, By Power, 2016–2023 (USD Billion)
Table 31 Europe: Market Size, By Drive, 2016–2023 (USD Billion)
Table 32 Germany: Tractor Implements Market Size, By Phase, 2016–2023 (USD Billion)
Table 33 Germany: Market Size, By Power, 2016–2023 (USD Billion)
Table 34 France: Market Size For Tractor Implements, By Phase, 2016–2023 (USD Billion)
Table 35 France: Market Size, By Power, 2016–2023 (USD Billion)
Table 36 UK: Market Size For Tractor Implements, By Phase, 2016–2023 (USD Billion)
Table 37 UK: Market Size, By Power, 2016–2023 (USD Billion)
Table 38 Italy: Tractor Implements Market Size, By Phase, 2016–2023 (USD Billion)
Table 39 Italy: Market Size, By Power, 2016–2023 (USD Billion)
Table 40 Rest of Europe: Market Size For Tractor Implements, By Phase, 2016–2023 (USD Billion)
Table 41 Rest of Europe: Market Size, By Power, 2016–2023 (USD Billion)
Table 42 Asia Pacific: Tractor Implements Market Size, By Country, 2016–2023 (USD Billion)
Table 43 Asia Pacific: Market Size For Tractor Implements, By Phase, 2016–2023 (USD Billion)
Table 44 Asia Pacific: Market Size, By Power, 2016–2023 (USD Billion)
Table 45 Asia Pacific: Market Size For Tractor Implements, By Drive, 2016–2023 (USD Billion)
Table 46 India: Market Size For Tractor Implements, By Power, 2016–2023 (USD Billion)
Table 47 India: Market Size, By Phase, 2016–2023 (USD Billion)
Table 48 China: Market Size For Tractor Implements, By Power, 2016–2023 (USD Billion)
Table 49 China: Market Size, By Phase, 2016–2023 (USD Billion)
Table 50 Japan: Market Size For Tractor Implements, By Power, 2016–2023 (USD Billion)
Table 51 Japan: Market Size, By Phase, 2016–2023 (USD Billion)
Table 52 Rest of Asia Pacific: Tractor Implements Market Size, By Power, 2016–2023 (USD Billion)
Table 53 Rest of Asia Pacific: Market Size, By Phase, 2016–2023 (USD Billion)
Table 54 South America: Market Size For Tractor Implements, By Country, 2016–2023 (USD Million)
Table 55 South America: Market Size, By Phase, 2016–2023 (USD Million)
Table 56 South America: Tractor Implements Market Size, By Power, 2016–2023 (USD Million)
Table 57 South America: Market Size, By Drive, 2016–2023 (USD Million)
Table 58 Brazil: Market Size For Tractor Implements, By Power, 2016–2023 (USD Million)
Table 59 Brazil: Market Size, By Phase, 2016–2023 (USD Million)
Table 60 Argentina: Tractor Implements Market Size, By Power, 2016–2023 (USD Million)
Table 61 Argentina: Market Size, By Phase, 2016–2023 (USD Million)
Table 62 Rest of South America: Tractor Implements Market Size, By Power, 2016–2023 (USD Million)
Table 63 Rest of South America: Market Size, By Phase, 2016–2023 (USD Million)
Table 64 RoW: Market Size For Tractor Implements, By Region, 2016–2023 (USD Million)
Table 65 RoW: Market Size, By Phase, 2016–2023 (USD Million)
Table 66 RoW: Tractor Implements Market Size, By Power, 2016–2023 (USD Million)
Table 67 RoW: Market Size, By Drive, 2016–2023 (USD Million)
Table 68 Africa: Tractor Implements Market Size, By Phase, 2016–2023 (USD Million)
Table 69 Africa: Market Size, By Power, 2016–2023 (USD Million)
Table 70 Middle East: Market Size For Tractor Implements, By Phase, 2016–2023 (USD Million)
Table 71 Middle East: Market Size, By Power, 2016–2023 (USD Million)
Table 72 Mergers & Acquisitions, 2014–2018
Table 73 Expansions & Investments, 2016–2018
Table 74 Agreements, Partnerships, and Joint Ventures, 2016–2018
List of Figures (46 Figures)
Figure 1 Tractor Implements: Market Segmentation
Figure 2 Regional Segmentation
Figure 3 Tractor Implements Market: Research Design
Figure 4 Breakdown of Primary Interviews: By Company Type, Designation, and Region
Figure 5 Market Size Estimation Methodology: Bottom-Up Approach
Figure 6 Market Size Estimation Methodology: Top-Down Approach
Figure 7 Data Triangulation Methodology
Figure 8 Market For Tractor Implements, By Phase, 2018 vs 2023
Figure 9 Tractor Implements Market, By Drive, 2018 vs 2023
Figure 10 Market For Tractor Implements, By Power, 2018 vs 2023
Figure 11 Market For Tractor Implements: Regional Snapshot
Figure 12 Tractor Implements Market is Driven By High Agricultural Operational Efficiency
Figure 13 Tractor Implements for Tillage is Projected to Dominate the Market Through 2023
Figure 14 India and China Accounted for the Largest Market Share in Asia Pacific in 2017
Figure 15 Unpowered Segment Dominated the Developing Markets in 2017
Figure 16 Asia Pacific Dominated Both the Wheel Drive Segments in 2017
Figure 17 The Us, India, and China are Larger Markets for Tractor Implements, 2017
Figure 18 Global Agricultural Employment Trend, 2010–2017
Figure 19 Market For Tractor Implements: Drivers, Restraints, Opportunities, and Challenges
Figure 20 Post-Harvest Food Loss During Different Phases
Figure 21 Hourly Wages for Hired Farmworkers in the US (2011-2017)
Figure 22 Number of Approved Patents Related to Tractor-Mount Equipment, By Key Holder, 2013–2018
Figure 23 Patent Approval for Tractor-Mount Equipment, By Country, 2013–2018
Figure 24 Tractor Implements Market, By Phase, 2018 vs 2023
Figure 25 Market For Tractor Implements, By Power, 2018 vs 2023
Figure 26 Market For Tractor Implements, By Drive, 2018 vs 2023
Figure 27 South America and Asia Pacific Regions to Witness Significant Market Growth From 2018 to 2023
Figure 28 Europe: Market Snapshot
Figure 29 Asia Pacific: Market Snapshot
Figure 30 Key Developments of Leading Players in the Market, 2014–2018
Figure 31 Company Share Analysis: Tractor Implements Market, 2017
Figure 32 Claas: Company Snapshot
Figure 33 Claas: SWOT Analysis
Figure 34 Deere & Company: Company Snapshot
Figure 35 Deere & Company: SWOT Analysis
Figure 36 Kubota: Company Snapshot
Figure 37 Kubota: SWOT Analysis
Figure 38 CNH Industrial: Company Snapshot
Figure 39 CNH Industrial: SWOT Analysis
Figure 40 Agco: Company Snapshot
Figure 41 Agco: SWOT Analysis
Figure 42 SDF Group: Company Snapshot
Figure 43 Mahindra & Mahindra: Company Snapshot
Figure 44 Actuant: Company Snapshot
Figure 45 Kuhn Group: Company Snapshot
Figure 46 Alamo Group: Company Snapshot
Figure 44 Actuant: Company Snapshot
Figure 45 Kuhn Group: Company Snapshot
Figure 46 Alamo Group: Company Snapshot


Growth opportunities and latent adjacency in Tractor Implements Market