Industrial Starch Market by Type (Native, Starch Derivatives & Sweeteners), Source (Corn, Wheat, Cassava, Potato), Application (Food, Feed, Paper Making & Corrugation, Pharmaceutical), Form (Dry, Liquid), and Region - Global Forecast to 2022


[188 Pages Report] The global industrial starch market is projected to grow from USD 72.51 billion in 2016 to USD 106.64 billion by 2022, at a CAGR of 6.64% during the forecast period. Starch is a homopolysaccharide formed by glucose units and stored in the form of carbohydrates in plants. It is synthesized by parts of vegetable cells and is stored in seeds, tubers, and roots. Starch derived from sources in its original form is known as native starch; whereas, starch produced by physically, chemically, or enzymatically, treating native starch to change its properties and enhance its performance according to various applications is known as modified starch. Modified starch can be termed as an additive prepared by treating native starch or starch granules with chemicals and enzymes to partially degrade the starch. Derivatives are products obtained by reacting starch with a chemical compound, resulting in unique physical and functional properties. The scope of the global market for this report includes native starch and starch derivatives & sweeteners. The base year considered for the study is 2015, and the forecast has been provided for the period between 2016 and 2022.
Market Dynamics
Drivers
- Growth in demand for convenience food
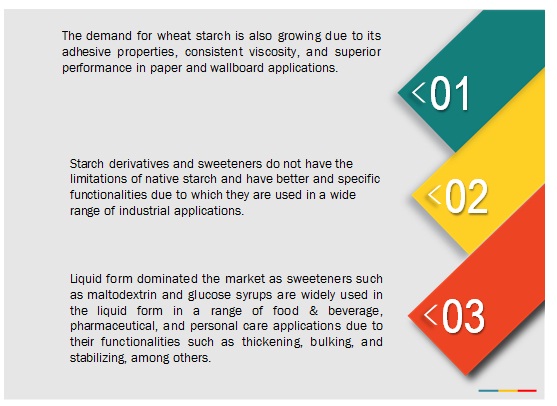
- Multiple functionalities of starch, starch derivatives, and sweeteners across end-user industries
Restraints
- High R&D costs
- Growth of the gum arabic market
Opportunities
- Rise in the potential of alternate sources of starch such as cassava
Challenges
- Requirement of consistency in raw material production
Multiple functionalities of starch, starch derivatives, and sweeteners in a diverse range of end-use industries to drive the global industrial starch market
Starch and starch derivatives have various functional characteristics including thickeners, stabilizers, sizing, fat replacers, and binding in various food and non-food applications. In addition, starch derivatives are used as an effective fermentation base for the bulk production of various biotechnological products such as organic acids, antibiotics, vitamins, and hormones. Although the food industry is projected to be the largest end user of starch and its derivatives, it is also increasingly used in various other end-use applications, such as paper, building materials, cosmetics, and pharmaceuticals. In addition, native starch is useful in a wide range of applications. However, it is restricted in some applications such as paper, building materials, cosmetics, and pharmaceuticals due to its structure. Modified starches, owing to their water absorbing and bulking agent features, improve the customer experience and offers enhanced mouthfeel in various food products. Due to these factors, it remains a preferred alternative for fats among manufacturers. In addition, various functional properties of starch and starch derivatives used in a range of end-use industries are driving the demand for industrial starch.
The following are the major objectives of the study.
- To define, segment, and forecast the size of the industrial starch market on the basis of source, form, application, type, function, and region.
- To project the market size, in terms of value (USD million) and volume (KT) for each of the segments, namely, source, form, type, and application.
- To forecast the size of the global market and its various submarkets with respect to four main regions, namely, North America, Asia-Pacific, Europe, and the Rest of the World (RoW).
- To provide detailed information about crucial factors that are influencing the growth of the market (drivers, restraints, opportunities, industry-specific challenges).
- To strategically analyze micromarkets with respect to individual growth trends, future prospects, and their contribution to the total market.
- To analyze opportunities in the market for stakeholders and provide details of the competitive landscape for market leaders.
- To strategically profile key players and comprehensively analyze their market share and core competencies.
- To analyze competitive developments such as expansions, mergers & acquisitions, new product launches, and joint ventures & agreements in the industrial starch market.
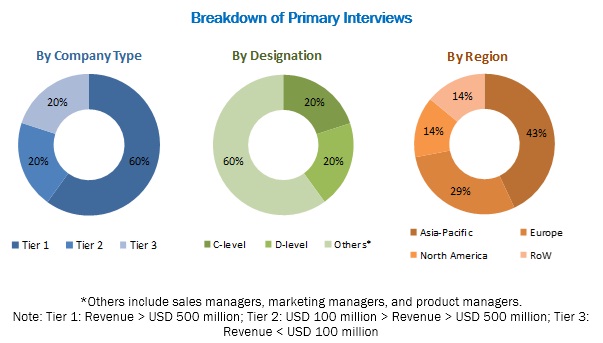
During this research study, major players operating in the industrial starch market in various regions were identified, and their offerings, regional presence, and distribution channels were analyzed through in-depth discussions. Top-down and bottom-up approaches were used to determine the overall market size. Sizes of the other individual markets were estimated using percentage splits obtained through secondary sources, such as Hoovers, Bloomberg BusinessWeek, and Factiva, along with primary respondents. The entire procedure includes the study of the annual and financial reports of the top market players and extensive interviews with industry experts such as CEOs, VPs, directors, and marketing executives for key insights (both qualitative and quantitative) pertaining to the market. The figure below shows the breakdown of the primaries on the basis of the company type, designation, and region considered during the research study.
To know about the assumptions considered for the study, download the pdf brochure
The contributors involved in the value chain of industrial starch include industrial starch manufacturers such as Cargill (US), Archer Daniels Midland Company (US), Ingredion Incorporated (US), and Tate & Lyle PLC (UK); government bodies & regulatory associations such as the USDA (United States Department of Agriculture), the FDA (Food and Drug Administration), and the EFSA (European Food Safety Authority); and end uses such as food, feed, pharmaceutical, cosmetics, and corrugation & paper making.
Major Market Developments
- In August 2016, Ingredion, Incorporated (US) acquired the rice starch and rice flour business of Sun Flour Industry Co, Ltd. (Thailand) to support the company’s global strategy of increasing its high-value specialty ingredients business.
- In July 2016, Archer Daniels Midland Company (US) expanded its portfolio of starches by introducing a new line of starch–DM Confectionery Molding Starch. This is projected to help the company in expanding its customer base in the confectionery industry.
- In January 2016, Cargill, Incorporated (US) set up a new corn milling plant in Davangere, Karnataka (India), which cost the company nearly USD 100 million. This helped the company in meeting with the growing demands for modified starch and its derivatives in the food and pharmaceutical industries.
Target Audience
- Raw material suppliers
- Traders, distributors, and manufacturers & suppliers of industrial starch
- Food processors & food manufacturers
- Government and research organizations
- Trade associations and industry bodies
- Regulatory bodies such as the Food and Drugs Organization (FDA), the European Commission, the European Food Safety Authority (EFSA), and Food Standards Australia New Zealand
Report Scope
By Type
- Native starch
- Starch derivatives & sweeteners
By Source
- Corn
- Wheat
- Cassava
- Potato
- Other sources
By Application:
- Food & beverage
- Feed
- Other applications
By Form:
- Dry
- Liquid
By Geography
- North America
- Europe
- Asia-Pacific
- Rest of the World (RoW)
Critical questions answered by the report
- What are the new application areas, which the industrial starch companies are exploring?
- Which are the key players in the market and how intense is the competition?
Available Customizations
With the given market data, MarketsandMarkets offers customizations according to client-specific scientific needs.
The following customization options are available for the report:
Segmental Analysis
Segmental analysis, which provides further breakdown of the ‘Others’ category in the application segment into mining & drilling, construction & building, adhesive, and chemical industries
Segmental analysis, which provides further breakdown of the ‘Others’ category in the type segment into maltodextrin, cyclodextrin, glucose syrup, hydrolysate and others
Regulatory Framework
- Regulations pertaining to each of the starch or starch derivatives across regions/countries.
Geographic Analysis
- Further breakdown of the Rest of Asia-Pacific industrial starch market, by country
- Further breakdown of Rest of Europe industrial starch market, by key country
Company Information
- Detailed analysis and profiling of additional market players (Up to 5)
The global industrial starch market is projected to grow from USD 72.51 billion in 2016 to USD 106.64 billion by 2022, at a CAGR of 6.64% during the forecast period. The increasing demand for convenience food and multiple functionalities of starch, starch derivatives, and sweeteners in a diverse range of end-use industries are the key factors driving the growth of this market.
Starch is a carbohydrate that is extracted from agricultural raw materials, such as corn, wheat, potato, and cassava and is used in numerous food and non-food applications. It is used as a major ingredient in food & beverage, feed, and other end-user industries such as corrugating & paper making, textile, pharmaceutical, personal care, and construction & building materials due to various functionalities such as thickening, binding, sizing, film forming, coating, and stabilizing. Starch is divided into three types, namely, native starch and starch derivatives & sweeteners.
The industrial starch market is segmented on the basis of type, into native starch and starch derivatives & sweeteners. The market for starch derivatives & sweeteners is projected to grow at the highest CAGR between 2016 and 2022. Unlike native starch, starch derivatives and sweeteners have better and application specific functionalities, due to which they are used in a wide range of industrial applications.
The global market in Asia-Pacific is projected to be the largest market during the forecast period. The market in Asia-Pacific is driven by the use of starch in various applications in emerging Asian markets such as China and India. For instance, the consumption of starch in China is nearly half of the global starch consumption.
Industrial starch applications in food & beverage, feed, and other applications to drive the growth of the industrial starch market
Food & beverage
Starch and its derivatives find application in various food applications such as confectionery, processed food, beverages, and others. Native starches are generally used for providing food products the required consistency, texture, and stability. However, these starches are chemically treated to create modified starches for application in a range of food products. Modified starches find increasing applications in food systems, where native starches have not been able to deliver the desired performance.
Feed
In comparison to the food and non-food markets for starch, the feed market for starch is relatively small. While modified and native starches are used as thickeners and binders in feed, other starch derivatives act as a source of fiber and for coloring and sweetening applications in pet food. Pregelatinized and high-amylose starch has useful binding properties and is used in pelletizing and extrusion processes. The use of starch derivatives remains high as it provides features such as enhanced digestibility of feed and protecting the liver functions of livestock.
Other Applications
Besides food and feed industries, the starch, its derivatives, and sweeteners find application in various other industries such as corrugation & paper making, pharmaceutical, textile, cosmetics, mining & drilling, construction & building materials, and chemical. The use of starch in these industrial applications is based on the need for specific functionality and properties among final products.
Critical questions the report answers:
- Where will all these developments take the industry in the mid to long term?
- What are the upcoming industry applications for industrial starch?
High R&D costs associated with the extraction and manufacture of starch derivatives are restraining the market growth. The extraction of starch derivatives from new natural sources for physical and chemical applications in various industries, such as food & beverage, paper, and pharmaceutical has become a challenge for manufacturers. Further, advancements in research have resulted in clinical recommendations with regards to the safe use of starch derivatives in various industrial applications. The use of starch in processed and convenience foods can contribute positively to the health and wellness of the general population in terms of fat substitution and replacing synthetic additives such as emulsifiers. Starch derivatives and their benefits have gained recognition in Europe and North America; hence, manufacturers and marketers are producing and distributing a wide range of starch derivatives & sweeteners for food and non-food applications, with an increased emphasis on the R&D activities. However, more investments are required to support the R&D activities, restraining the growth of this market.
The key players in this market are Cargill, Incorporated (US), Archer Daniels Midland Company (US), Ingredion Incorporated (US), Tate & Lyle PLC (UK), Agrana Beteiligungs-AG (Austria), Grain Processing Corporation (US), Roquette Frères (France), Tereos Group (France), Royal Cosun (Netherlands), and Altia Industrial Services (Finland). These companies have predominantly adopted new product launches as a growth strategy. In addition, other strategies adopted by these companies include expansions & investments, mergers & acquisitions, and joint ventures & agreements to increase their market share.
To speak to our analyst for a discussion on the above findings, click Speak to Analyst
 Exclusive indicates content/data unique to MarketsandMarkets and not available with any competitors.
Table of Contents
1 Introduction (Page No. - 17)
1.1 Objectives of the Study
1.2 Market Definition
1.3 Markets Covered
1.4 Periodization Considered for the Study
1.5 Currency
1.6 Stakeholders
1.7 Scope Limitations
2 Research Methodology (Page No. - 21)
2.1 Research Data
2.1.1 Secondary Data
2.1.1.1 Key Data From Secondary Sources
2.1.2 Primary Data
2.1.2.1 Key Data From Primary Sources
2.1.2.2 Key Industry Insights
2.1.2.3 Breakdown of Primaries
2.2 Market Size Estimation
2.3 Market Breakdown & Data Triangulation
2.4 Research Assumptions & Limitations
3 Executive Summary (Page No. - 30)
4 Premium Insights (Page No. - 34)
4.1 Opportunities in this Market
4.2 Key Industrial Starch Markets
4.3 Asia-Pacific Industrial Starch Market, By Source and Country
4.4 Dry vs Liquid Form, 2016 vs 2022
4.5 Market, By Application & Region
4.6 Life Cycle Analysis: Market, By Region
5 Market Overview (Page No. - 39)
5.1 Introduction
5.2 Market Segmentation
5.2.1 Source
5.2.2 Application
5.2.3 Form
5.2.4 Type
5.2.5 By Region
5.3 Market Dynamics
5.3.1 Drivers
5.3.1.1 Growth in Demand for Convenience Food
5.3.1.2 Multiple Functionalities of Starch, Starch Derivatives & Sweeteners in Diverse Range of End-Use Industries
5.3.2 Restraints
5.3.2.1 High R&D Costs
5.3.2.2 Growth in the Gum Arabic Market
5.3.3 Opportunities
5.3.3.1 Rise in Potential of Alternate Sources of Starch Such as Cassava and Others
5.3.4 Challenges
5.3.4.1 Required Level of Consistency in Raw Material Production
6 Industry Outlook (Page No. - 47)
6.1 Supply Chain
6.2 Raw Material Analysis
6.3 Trade Statistics By Key Countries
6.3.1 U.S.
6.3.2 Canada
6.3.3 Mexico
6.3.4 Germany
6.3.5 France
6.3.6 Italy
6.3.7 U.K.
6.3.8 Spain
6.3.9 China
6.3.10 Japan
6.3.11 India
6.3.12 Australia
6.3.13 Thailand
6.3.14 Indonesia
6.3.15 Brazil
6.3.16 South Africa
7 Industrial Starch Market, By Type (Page No. - 65)
7.1 Introduction
7.2 Native Starch
7.3 Starch Derivatives & Sweeteners
7.3.1 Modified Starch
7.3.2 Other Derivatives & Sweeteners
7.3.2.1 Maltodextrin
7.3.2.2 Cyclodextrin
7.3.2.3 Glucose Syrups
7.3.2.4 Hydrolysates
8 Industrial Starch Market, By Source (Page No. - 77)
8.1 Introduction
8.2 Corn
8.3 Wheat
8.4 Cassava
8.5 Potato
8.6 Other Sources
9 Industrial Starch Market, By Application (Page No. - 84)
9.1 Introduction
9.2 Food & Beverage
9.2.1 Confectionery
9.2.2 Processed Foods
9.2.3 Beverages
9.2.4 Others
9.3 Feed
9.4 Other Applications
9.4.1 Corrugation & Paper Making
9.4.2 Pharmaceutical
9.4.3 Textile
9.4.4 Cosmetics
9.4.5 Others
9.4.5.1 Mining & Drilling
9.4.5.2 Construction & Building
9.4.5.3 Adhesive
9.4.5.4 Chemical
10 Industrial Starch Market, By Form (Page No. - 93)
10.1 Introduction
10.2 Dry Form
10.3 Liquid
11 Industrial Starch Market, By Function (Page No. - 96)
11.1 Introduction
11.2 Stabilizing
11.3 Thickening
11.4 Film Forming Agents
11.5 Gelling Agent
11.6 Texturizing
11.7 Binding
11.8 Emulsifying
11.9 Sizing
11.10 Mositure Retention
11.11 Coating
12 Industrial Starch Market, By Region (Page No. - 99)
12.1 Introduction
12.2 North America
12.2.1 U.S.
12.2.2 Canada
12.2.3 Mexico
12.3 Europe
12.3.1 Germany
12.3.2 France
12.3.3 U.K.
12.3.4 Italy
12.3.5 Spain
12.3.6 Rest of Europe
12.4 Asia-Pacific
12.4.1 China
12.4.2 Japan
12.4.3 India
12.4.4 Australia
12.4.5 Rest of Asia-Pacific
12.5 Rest of the World
12.5.1 Latin America
12.5.2 Africa
12.5.3 Middle East
13 Brand Overview (Page No. - 136)
13.1 Introduction
13.2 Cargill, Incorporated
13.3 Archer Daniels Midland Company
13.4 Ingredion, Incorporated
13.5 Tate & Lyle PLC
13.6 Agrana Beteiligungs-AG
14 Competitive Landscape (Page No. - 140)
14.1 Overview
14.2 Market Share Analysis
14.3 Competitive Situations & Trends
14.4 New Product Launches
14.5 Expansions & Investments
14.6 Mergers & Acquisitions
14.7 Joint Ventures & Agreements
15 Company Profiles (Page No. - 145)
(Company at A Glance, Business Overview, Products Offered, Key Strategy, Recent Developments, SWOT Analysis & MnM View)*
15.1 Introduction
15.2 Cargill, Incorporated
15.3 Archer Daniels Midland Company
15.4 Ingredion Incorporated
15.5 Tate & Lyle PLC
15.6 Agrana Beteiligungs-AG
15.7 Grain Processing Corporation
15.8 Roquette Frères
15.9 The Tereos Group
15.10 Royal Cosun
15.11 Altia Industrial Services
*Details on Company at A Glance, Recent Financials, Products Offered, Strategies & Insights, & Recent Developments Might Not Be Captured in Case of Unlisted Companies.
16 Appendix (Page No. - 175)
16.1 Industry Insights
16.2 Discussion Guide
16.3 More Company Developments
16.3.1 New Product Launches
16.3.2 Expansions & Investments
16.3.3 Mergers & Acquisitions
16.3.4 Joint Ventures & Agreements
16.4 Knowledge Store: Marketsandmarkets’ Subscription Portal
16.5 Introducing RT: Real-Time Market Intelligence
16.6 Available Customizations
16.7 Related Reports
16.8 Author Details
List of Tables (128 Tables)
Table 1 Global Industrial Starch Market Snapshot, By Value
Table 2 Canada: Starch Import-Export, By Source, 2011-2015 (Kg)
Table 3 Spain: Starch Import-Export, By Source, 2011-2015 (Kg)
Table 4 Japan: Starch Import-Export, By Source, 2011-2015 (Kg)
Table 5 India: Starch Import-Export, By Source, 2011-2015 (Kg)
Table 6 Australia: Starch Import-Export, By Source, 2011-2015 (Kg)
Table 7 Thailand: Starch Import-Export, By Source, 2011-2015 (Kg)
Table 8 Brazil: Starch Import-Export, By Source, 2011-2015 (Kg)
Table 9 South Africa: Starch Import-Export, By Source, 2011-2015 (Kg)
Table 10 Industrial Starch Market Size, By Type, 2014–2022 (KT)
Table 11 Market Size, By Type, 2014–2022 (USD Billion)
Table 12 Native Starch Market Size, By Region, 2014–2022 (USD Billion)
Table 13 North America: Native Starch Market Size, By Country, 2014–2022 (USD Billion)
Table 14 Europe: Native Starch Market Size, By Country, 2014–2022 (USD Billion)
Table 15 Asia-Pacific: Native Starch Market Size, By Country, 2014–2022 (USD Billion)
Table 16 RoW: Native Starch Market Size, By Region, 2014–2022 (USD Billion)
Table 17 Starch Derivatives & Sweeteners Market Size, By Type, 2014–2022 (KT)
Table 18 Starch Derivatives & Sweeteners Market Size, By Type, 2014–2022 (USD Billion)
Table 19 Starch Derivatives & Sweeteners Market Size, By Region, 2014–2022 (USD Billion)
Table 20 North America: Starch Derivatives & Sweeteners Market Size, By Country, 2014–2022 (USD Billion)
Table 21 Europe: Starch Derivatives & Sweeteners Market Size, By Country, 2014–2022 (USD Billion)
Table 22 Asia-Pacific: Starch Derivatives & Sweeteners Market Size, By Country, 2014–2022 (USD Billion)
Table 23 RoW: Starch Derivatives & Sweeteners Market Size, By Region, 2014–2022 (USD Billion)
Table 24 Modified Starch Market Size, By Region, 2014–2022 (USD Billion)
Table 25 Other Derivatives & Sweeteners Market Size, By Region, 2014–2022 (USD Billion)
Table 26 Industrial Starch Market Size, By Source, 2014–2022 (KT)
Table 27 Market Size, By Source, 2014–2022 (USD Billion)
Table 28 Corn: Market Size for Industrial Starch, By Region, 2014–2022 (USD Billion)
Table 29 Wheat: Market Size, By Region, 2014–2022 (USD Billion)
Table 30 Cassava: Industrial Starch Market Size, By Region, 2014–2022 (USD Billion)
Table 31 Potato:Market Size, By Region, 2014–2022 (USD Billion)
Table 32 Other Sources: Market Size, By Region, 2014–2022 (USD Billion)
Table 33 Market Size for Industrial Starch, By Application, 2014–2022 (KT)
Table 34 Market Size, By Application, 2014–2022 (USD Billion)
Table 35 Industrial Starch Market Size for Food & Beverage, By Application, 2014–2022 (KT)
Table 36 Market Size for Food & Beverage, By Application, 2014–2022 (USD Billion)
Table 37 Industrial Starch Market Size for Food & Beverage, By Region, 2014–2022 (USD Billion)
Table 38 Market Size for Feed, By Region, 2014–2022 (USD Billion)
Table 39 Industrial Starch Market Size for Other Applications , By Type, 2014–2022 (KT)
Table 40 Market Size for Other Applications , By Type, 2014–2022 (USD Billion)
Table 41 Industrial Starch Market Size for Other Applications, By Region, 2014–2022 (USD Billion)
Table 42 Market Size, By Form, 2014–2022 (KT)
Table 43 Market Size, By Form, 2014–2022 (USD Billion)
Table 44 Dry Industrial Starch Market Size, By Region, 2014–2022 (USD Billion)
Table 45 Liquid Industrial Starch Market Size, By Region, 2014–2022 (USD Billion)
Table 46 Functions of Industrial Starch, By Type
Table 47 Industrial Starch Market Size, By Region, 2014–2022 (KT)
Table 48 Market Size, By Region, 2014–2022 (USD Billion)
Table 49 North America: Industrial Starch Market Size, By Country, 2014–2022 (USD Billion)
Table 50 North America: Market Size, By Type, 2014–2022 (USD Billion)
Table 51 North America: Starch Derivatives & Sweeteners Market Size, By Type, 2014–2022 (USD Billion)
Table 52 North America: Market Size, By Source, 2014–2022 (USD Billion)
Table 53 North America: Market Size, By Application, 2014–2022 (USD Billion)
Table 54 North America: Market Size, By Form, 2014–2022 (USD Billion)
Table 55 U.S.: Market Size for Industrial Starch, By Type, 2014–2022 (USD Billion)
Table 56 U.S.: Starch Derivatives & Sweeteners Market Size, By Type, 2014–2022 (USD Billion)
Table 57 Canada: Industrial Starch Market Size, By Type, 2014–2022 (USD Billion)
Table 58 Canada: Starch Derivatives & Sweeteners Market Size, By Type, 2014–2022 (USD Billion)
Table 59 Mexico: Market Size for Industrial Starch, By Type, 2014–2022 (USD Billion)
Table 60 Mexico: Starch Derivatives & Sweeteners Market Size, By Type, 2014–2022 (USD Billion)
Table 61 Europe: Industrial Starch Market Size, By Country, 2014–2022 (USD Billion)
Table 62 Europe: Market Size, By Type, 2014–2022 (USD Billion)
Table 63 Europe: Industrial Starch Derivatives & Sweeteners Market Size, By Type, 2014–2022 (USD Billion)
Table 64 Europe: Market Size, By Source, 2014–2022 (USD Billion)
Table 65 Europe: Market Size, By Application, 2014–2022 (USD Billion)
Table 66 Europe: Market Size, By Form, 2014–2022 (USD Billion)
Table 67 Germany: Industrial Starch Market Size, By Type, 2014–2022 (USD Billion)
Table 68 Germany: Industrial Starch Derivatives & Sweeteners Market Size, By Type, 2014–2022 (USD Billion)
Table 69 France: Market Size for Industrial Starch, By Type, 2014–2022 (USD Billion)
Table 70 France: Industrial Starch Derivatives & Sweeteners Market Size, By Type, 2014–2022 (USD Billion)
Table 71 U.K.: Industrial Starch Market Size, By Type, 2014–2022 (USD Billion)
Table 72 U.K.: Industrial Starch Derivatives & Sweeteners Market Size, By Type, 2014–2022 (USD Billion)
Table 73 Italy: Market Size for Industrial Starch, By Type, 2014–2022 (USD Billion)
Table 74 Italy: Industrial Starch Derivatives & Sweeteners Market Size, By Type, 2014–2022 (USD Billion)
Table 75 Spain: Market Size for Industrial Starch, By Type, 2014–2022 (USD Billion)
Table 76 Spain: Industrial Starch Derivatives & Sweeteners Market Size, By Type, 2014–2022 (USD Billion)
Table 77 Rest of Europe: Industrial Starch Market Size, By Type, 2014–2022 (USD Billion)
Table 78 Rest of Europe: Industrial Starch Derivatives & Sweeteners Market Size, By Type, 2014–2022 (USD Billion)
Table 79 Asia-Pacific: Market Size for Industrial Starch, By Country, 2014–2022 (USD Billion)
Table 80 Asia-Pacific: Market Size, By Type, 2014–2022 (USD Billion)
Table 81 Asia-Pacific: Starch Derivatives & Sweeteners Market Size, By Type, 2014–2022 (USD Billion)
Table 82 Asia-Pacific: Industrial Starch Market Size, By Source, 2014–2022 (USD Billion)
Table 83 Asia-Pacific: Market Size, By Application, 2014–2022 (USD Billion)
Table 84 Asia-Pacific: Market Size, By Form, 2014–2022 (USD Billion)
Table 85 China: Market Size for Industrial Starch, By Type, 2014–2022 (USD Billion)
Table 86 China: Starch Derivatives & Sweeteners Market Size, By Type, 2014–2022 (USD Billion)
Table 87 Japan: Industrial Starch Market Size, By Type, 2014–2022 (USD Billion)
Table 88 Japan: Starch Derivatives & Sweeteners Market Size, By Type, 2014–2022 (USD Billion)
Table 89 India: Market Size for Industrial Starch, By Type, 2014–2022 (USD Billion)
Table 90 India: Starch Derivatives & Sweeteners Market Size, By Type, 2014–2022 (USD Billion)
Table 91 Australia: Industrial Starch Market Size, By Type, 2014–2022 (USD Billion)
Table 92 Australia: Starch Derivatives & Sweeteners Market Size, By Type, 2014–2022 (USD Billion)
Table 93 Rest of Asia-Pacific: Market Size for Industrial Starch, By Type, 2014–2022 (USD Billion)
Table 94 Rest of Asia-Pacific: Starch Derivatives & Sweeteners Market Size, By Type, 2014–2022 (USD Billion)
Table 95 RoW: Industrial Starch Market Size, By Region, 2014–2022 (USD Billion)
Table 96 RoW: Market Size, By Type, 2014–2022 (USD Billion)
Table 97 RoW: Industrial Starch Derivatives & Sweeteners Market Size, By Type, 2014–2022 (USD Billion)
Table 98 RoW: Market Size for Industrial Starch, By Source, 2014–2022 (USD Billion)
Table 99 RoW: Market Size, By Application, 2014–2022 (USD Billion)
Table 100 RoW: Market Size, By Form, 2014–2022 (USD Billion)
Table 101 Latin America: Industrial Starch Market Size, By Type, 2014–2022 (USD Billion)
Table 102 Latin America: Industrial Starch Derivatives & Sweeteners Market Size, By Type, 2014–2022 (USD Billion)
Table 103 Africa: Market Size for Industrial Starch, By Type, 2014–2022 (USD Billion)
Table 104 Africa: Industrial Starch Derivatives & Sweeteners Starch Market Size, By Type, 2014–2022 (USD Billion)
Table 105 Middle East: Industrial Starch Market Size, By Type, 2014–2022 (USD Billion)
Table 106 Middle East: Industrial Starch Derivatives & Sweeteners Starch Market Size, By Type, 2014–2022 (USD Billion)
Table 107 Cargill, Incorporated: List of Brands, By Application
Table 108 Archer Daniels Midland Company: List of Brands, By Application
Table 109 Tate & Lyle: List of Brands of feed, By Application
Table 110 Agrana Beteiligungs-AG: List of Brands, By Application
Table 111 New Product Launches, 2011–2016
Table 112 Expansions & Investments, 2011–2016
Table 113 Acquisitions, 2011–2016
Table 114 Joint Ventures & Agreements, 2011–2016
Table 115 Cargill, Incorporatd: Products Offered
Table 116 Archer Daniels Midland Company: Products Offered
Table 117 Ingredion Incorporated: Products Offered
Table 118 Tate & Lyle PLC: Products Offered
Table 119 Agrana Beteiligungs-AG: Products Offered
Table 120 Grain Processing Corporation: Products Offered
Table 121 Roquette Frères: Products Offered
Table 122 The Tereos Group: Products Offered
Table 123 Royal Cosun: Products Offered
Table 124 Altia Industrial Services: Products Offered
Table 125 New Product Launches, 2011–2016
Table 126 Expansions & Investments, 2011–2016
Table 127 Mergers & Acquisitions, 2011–2016
Table 128 Joint Ventures, 2011–2016
List of Figures (85 Figures)
Figure 1 Market Segmentation
Figure 2 Geographic Scope
Figure 3 Industrial Starch Market: Research Design
Figure 4 Market Size Estimation Methodology: Bottom-Up Approach
Figure 5 Market Size Estimation Methodology: Top-Down Approach
Figure 6 Data Triangulation
Figure 7 Market Size for Industrial Starch, By Application, 2016 vs 2022 (USD Billion)
Figure 8 Market Snapshot, By Source, 2016 vs 2022 (KT)
Figure 9 Market Size, By Form, 2016 vs 2022 (KT)
Figure 10 Market Size, By Type, 2016 vs 2022 (USD Billion)
Figure 11 Industrial Starch Market Share (Volume), By Region, 2016
Figure 12 Growing Demand for Convenience Foods Drives the Demand for Industrial Starch
Figure 13 Geographic Snapshot: New Hotspots Emerging in Asia-Pacific, 2016–2022
Figure 14 Corn Held the Largest Share in 2015
Figure 15 Liquid Form Dominated the Global Market
Figure 16 Food & Beverage Segment Accounted for the Largest Share and is Projected to Be the Fastest-Growing During the Forecast Period
Figure 17 Asia-Pacific Region Poised for Robust Growth, 2016–2022
Figure 18 Industrial Starch Market, By Source
Figure 19 Market, By Application
Figure 20 Market, By Form
Figure 21 Market, By Type
Figure 22 Market, By Region
Figure 23 Market Dynamics: Industrial Starch
Figure 24 Food Consumption Data, By Type, 2016
Figure 25 Supply Chain: Industrial Starch Market
Figure 26 Source By Key Starch Producing Regions (Million Tones)
Figure 27 Starch Production, By Region
Figure 28 U.S.: Starch Import-Export, By Source, 2011-2015 (KT)
Figure 29 U.S.: Dextrins & Other Modified Starch, Import-Export, 2011-2015 (KT)
Figure 30 Canada: Starch Import-Export, By Source, 2011-2015 (KT)
Figure 31 Canada: Dextrins & Other Modified Starch, Import-Export, 2011-2015 (KT)
Figure 32 Mexico: Dextrins & Other Modified Starch, Import-Export, 2011-2015 (KT)
Figure 33 Germany: Starch Import-Export, By Source, 2011-2015 (KT)
Figure 34 Germany: Dextrins & Other Modified Starch, Import-Export, 2011-2015 (KT)
Figure 35 France: Starch Import-Export, By Source, 2011-2015 (KT)
Figure 36 France: Dextrins & Other Modified Starch, Import-Export, 2011-2015 (KT)
Figure 37 Italy: Starch Import-Export, By Source, 2011-2015 (KT)
Figure 38 Italy: Dextrins & Other Modified Starch, Import-Export, 2011-2015 (KT)
Figure 39 U.K.: Starch Import-Export, By Source, 2011-2015 (KT)
Figure 40 U.K.: Dextrins & Other Modified Starch, Import-Export, 2011-2015 (KT)
Figure 41 Spain: Starch Import-Export, By Source, 2011-2015 (KT)
Figure 42 Spain: Dextrins & Other Modified Starch, Import-Export, 2011-2015 (KT)
Figure 43 China: Starch Import-Export, By Source, 2011-2015 (KT)
Figure 44 China: Dextrins & Other Modified Starch, Import-Export, 2011-2015 (KT)
Figure 45 Japan: Starch Import-Export, By Source, 2011-2015 (KT)
Figure 46 Japan: Dextrins & Other Modified Starch, Import-Export, 2011-2015 (KT)
Figure 47 India: Starch Import-Export, By Source, 2011-2015 (KT)
Figure 48 India: Dextrins & Other Modified Starch, Import-Export, 2011-2015 (KT)
Figure 49 Australia: Starch Import-Export, By Source, 2011-2015 (KT)
Figure 50 Australia: Dextrins & Other Modified Starch, Import-Export, 2011-2015 (KT)
Figure 51 Thailand: Starch Import-Export, By Source, 2011-2015 (KT)
Figure 52 Thailand: Dextrins & Other Modified Starch, Import-Export, 2011-2015 (KT)
Figure 53 Indonesia: Starch Import-Export, By Source, 2011-2015 (KT)
Figure 54 Indonesia: Dextrins & Other Modified Starch, Import-Export, 2011-2015 (KT)
Figure 55 Brazil: Starch Import-Export, By Source, 2011-2015 (KT)
Figure 56 Brazil: Dextrins & Other Modified Starch, Import-Export, 2011-2015 (KT)
Figure 57 South Africa: Starch Import-Export, By Source, 2011-2015 (KT)
Figure 58 South Africa: Dextrins & Other Modified Starch, Import-Export, 2011-2015 (KT)
Figure 59 Industrial Starch Market Share, By Type, 2015 (KT)
Figure 60 Industrial Market Share (Value), By Source, 2016–2022
Figure 61 Industrial Starch Market Share (Volume), By Application, 2016–2022
Figure 62 Industrial Market Share (Volume), By Form, 2015 (KT)
Figure 63 Starch Production, By Region, 2010
Figure 64 Starch & Sweeteners Consumption, Per Capita vs GDP Per Capita
Figure 65 China Accounted for the Largest Share in this Market in 2015
Figure 66 U.S. Exports of Products From Corn, 2010-2014
Figure 67 North American Industrial Starch Market: U.S. is Estimated to Lead the Market in 2016
Figure 68 Starch Production in EU, 2004–2015
Figure 69 Asia-Pacific Industrial Starch Market: China is Estimated to Lead the Market in North America in 2016
Figure 70 New Product Launches and Expansions & Investments: Leading Approaches of Key Companies, 2011–2016
Figure 71 Expanding Revenue Base Through New Product Launches, 2014–2016
Figure 72 New Product Launches: the Key Strategy, 2011–2016
Figure 73 Geographic Revenue Mix of Top Market Players
Figure 74 Cargill, Incorporated: Company Snapshot
Figure 75 Cargill, Incorporated: SWOT Analysis
Figure 76 Archer Daniels Midland Company: Company Snapshot
Figure 77 Archer Daniels Midland Company: SWOT Analysis
Figure 78 Ingredion Incorporated: Company Snapshot
Figure 79 Ingredion Incorporated: SWOT Analysis
Figure 80 Tate & Lyle PLC: Company Snapshot
Figure 81 Tate& Lyle PLC: SWOT Analysis
Figure 82 Agrana Beteiligungs-AG: Company Snapshot
Figure 83 Agrana Beteiligungs-AG: SWOT Analysis
Figure 84 The Tereos Group: Company Snapshot
Figure 85 Royal Cosun: Company Snapshot


Growth opportunities and latent adjacency in Industrial Starch Market