CNC Controller Market Size, Share & Industry Growth Analysis Report by Offering (Hardware and Software & Services), Machine Type, Axis Type (2-Axis, 3-Axis, 4-Axis, 5-Axis, and Multi-axis), Sales Channel, Industry, and Region - Global Growth Driver and Industry Forecast to 2030
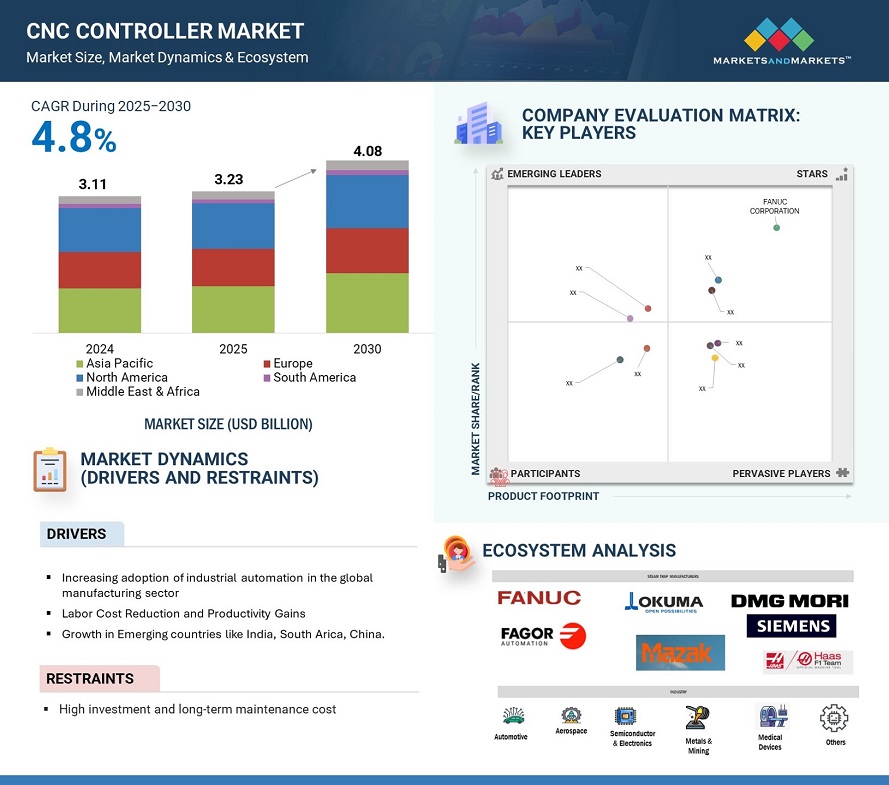
The global CNC controller market is expected to be USD 3.23 billion in 2025 and is projected to grow at a CAGR of 4.8% from 2025-2030 to reach USD 4.08 billion by 2030. The CNC controller market is driven by the increasing demand for automation of manufacturing processes that increase precision and efficiency. The advancement in the industry 4.0 technologies, including the Internet of Things and AI, helps accelerate the usage of smart CNC systems. The economic and time-efficient production requirement and the growing automobile and aerospace industries fuel further market growth. More importantly, the rising prevalence of custom machinery and the trend toward miniaturization in electronic devices stand out among catalysts.
To know about the assumptions considered for the study, Request for Free Sample Report
Impact of AI on the CNC controller Market:
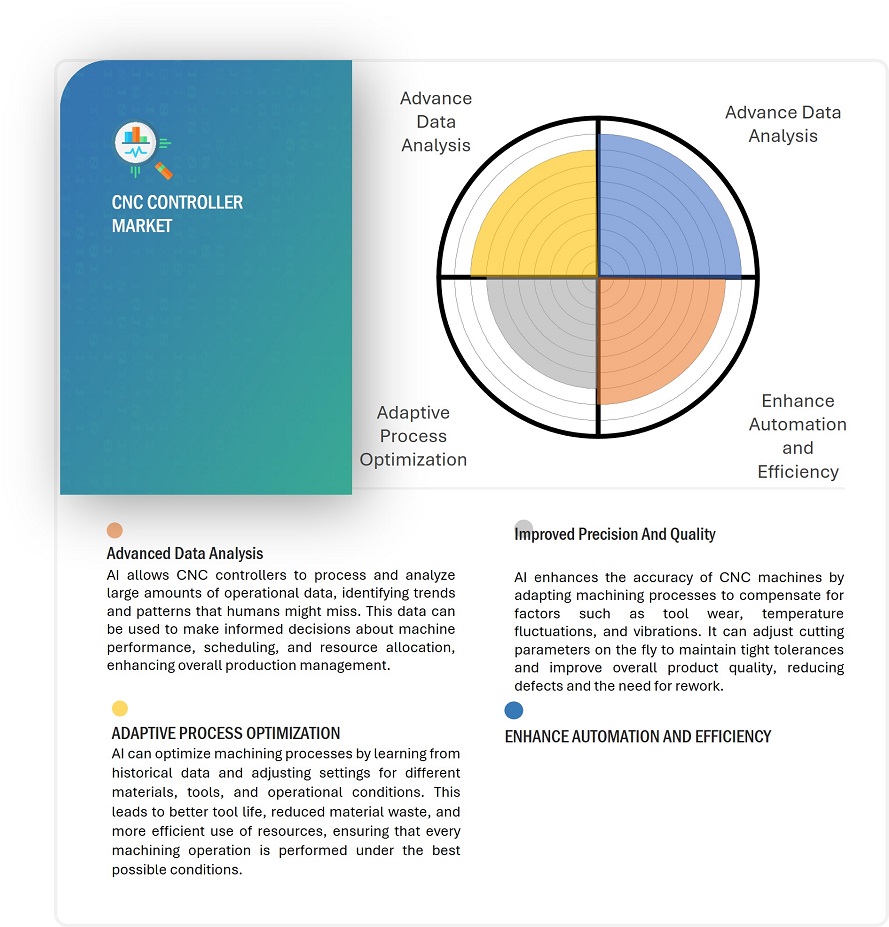
AI allows CNC machine controllers to adjust machining conditions like cutting speed, feeds, and tool paths instantaneously without human intervention, ensuring optimal efficiency throughout the production process while minimizing the human factor. This largely increases productivity. Another result of using such controllers is predictive maintenance, or the constant monitoring of the machine's overall health, and the ability to identify signs before they lead to wearouts or failures, thus setting up times for repairs and reductions in downtime.
It also adapts to tool wear, temperature changes, and vibrations, thus ensuring that tolerances are tighter and quality is higher. Its optimal machining is based on the historical data learned for adjusting for various materials, reducing waste, and extending tool life. AI also analyzes operational data to improve performance, scheduling, and resource allocation. Autonomous decision-making during machining reduces human errors and streamlines production. In line with Industry 4.0, AI-enabled CNC controllers are concerted systems that conduct manufacturing operations in smarter, better coordinated, and much more efficient manners.
CNC Controller Market Dynamics
Driver: Increasing adoption of industrial automation in the global manufacturing sector
The primary reason for the need for industrial automation in the global manufacturing industry is due to the need for real-time data monitoring and predictive maintenance. The benefits that accrue from automation are many, including higher precision, better quality products, accuracy, safety, and consistency in the production processes. It also increases productivity and reduces operation costs, a huge advantage for automotive, aerospace, and medical equipment manufacturing industries. Probably because companies are trying to increase automation and improve their production processes, there is an expected increase in the use of advanced technologies, like CNC machines.
Restraint: High investment and long-term maintenance cost
Introducing CNC controllers is an enormous economic burden both due to the very high initial cost and the high maintenance cost. The above costs are especially challenging to SMEs characterized by limited capital. The cost of the machinery, aside from that, required infrastructure upgrades, including power supply enhancements, a dedicated workspace, and environmental controls to ensure optimal performance of CNC systems.
Once it becomes operational, the monetary obligations will only continue with maintenance and operational expenses. CNC controllers need servicing, too, to get precise and efficient commands and would therefore consider necessary periodic checks, adjustments, and replacement of key parts, including drive motors, spindles, and sensors. Software updates are necessary to improve performance, minimize cyber risks, and bring them up to current industry standards, but this usually comes at a charge in licensing or subscription fees.
Opportunity: Integration of 3D printing technology with CNC machining.
Integrating CNC controllers with 3D printing creates a significant opportunity for augmenting precision through hybrid manufacturing that combines additive and subtractive techniques. This approach would make complex parts possible, minimizing the post-processing needed, enhancing accuracy, and reducing lead times. Mass customization, reduction of material waste, and consistency with sustainability goals are also promoted. It will integrate CNC-3D printing, thus becoming the future of smart, efficient, and flexible manufacturing through real-time adaptation and seamlessness in switching between processes.
Challenge: Integration of Modern CNC Controllers with Legacy Systems
Integrating modern CNC controllers with legacy systems will raise significant challenges to manufacturers working on older machinery. The primary problems are that legacy hardware, software, and communication protocols are not compatible with newer advanced CNC controllers that use digital communication, IoT connectivity, and real-time data exchange. This often requires costly custom interfaces and retrofitting the older machines with newer motors, drives, and sensors for compatibility.
The other integration complication is due to the limitations of the software, which in the older systems does not include real-time monitoring and predictive maintenance. It means expensive upgrades or replacements are needed. It can also be complicated to migrate historical data. A critical barrier is the shortage of skilled labor capable of managing legacy and modern systems, requiring extensive training and increasing costs.
CNC controller Market Ecosystem
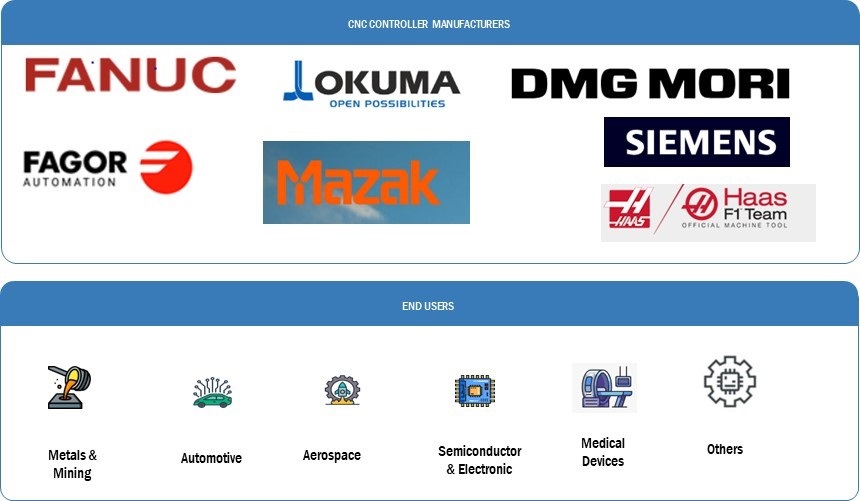
Leading players operating in the CNC controller market are FANUC (Japan), DMG MORI (Germany), Haas Automation Inc. (US), Siemens (Germany) and many more. The ecosystem has been portrayed by clubbing together component suppliers, robot manufacturers, technology providers, and end users.
5-axis CNC controllers by operation mode are expected to exhibit the highest CAGR in the CNC controller market during the forecast period.
The 5-axis CNC controller market is likely to grow at the maximum CAGR in the forthcoming years. The rapid growth of 5-axis CNC controllers is driven by the increasing demand for precision and the ability to machine complex geometries across industries such as aerospace, automotive, and medical devices. These controllers enable intricate machining in a single setup, reducing errors and production time and making them indispensable in sectors like aerospace, where components such as turbine blades and structural parts require tight tolerances. The ongoing adoption of Industry 4.0 technologies, including IoT, AI, and real-time monitoring, enhances the efficiency and intelligence of 5-axis CNC controllers, boosting productivity and minimizing downtime.
Additionally, the rise in demand for customization and rapid prototyping, particularly in the automotive and consumer electronics industries, has amplified the need for flexible machining solutions provided by 5-axis controllers. These controllers are critical for producing patient-specific implants and prosthetics with precise contours in the medical and dental sectors. Continuous advancements in CNC technology, such as integration with CAD/CAM software and AI-driven optimization, have also made 5-axis systems more user-friendly and efficient. Finally, the focus on high-efficiency machining, driven by the need to reduce costs, lead times, and material waste, further propels the adoption of 5-axis CNC controllers.
Automotive by end-user industry is projected to have a high market share during the forecast period
Given several critical factors, The automobile industry will likely lead the CNC controller market. The increasing need for high-precision machining of complex components such as engine parts, transmission systems, and chassis drives the rapid growth of the CNC controller market in the automotive industry. This demand has increased with the surge in the production of electric vehicles (EVs). According to the Global EV outlook brought out by the International Energy Agency (IEA), in 2023 alone, nearly 14 million new electric cars were registered globally, bringing the total on the roads to 40 million—a 35% year-on-year increase and more than six times the number registered in 2018. With over 250,000 new EV registrations occurring weekly in 2023, surpassing the demand for CNC controllers to produce specialized EV components like battery housings and electric motors has intensified.
The growing demand for customized vehicles and rapid prototyping has accelerated the adoption of flexible CNC machining solutions. Integrating automation and Industry 4.0 technologies, such as real-time data monitoring and AI-based predictive maintenance, enhances CNC controllers' efficiency, leading to increased productivity and reduced downtime. As manufacturers expand globally and outsource component production, CNC controllers play a key role in maintaining consistent quality across various site.
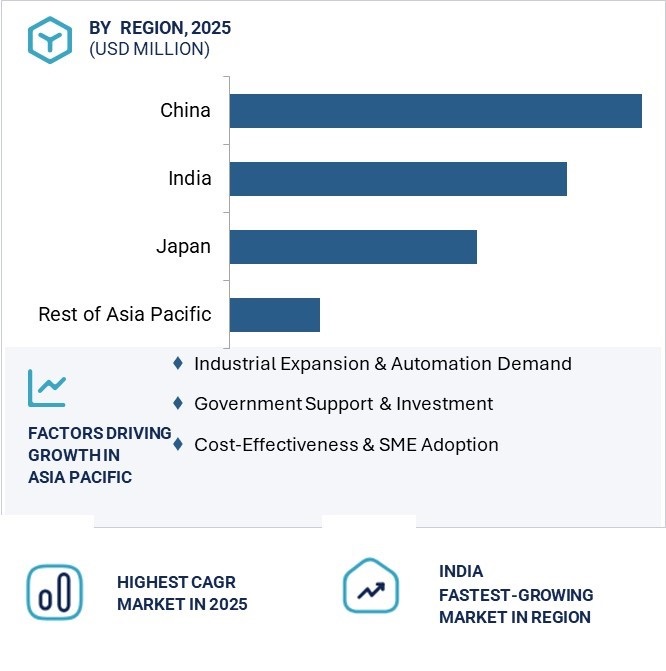
Asia Pacific is expected to have the highest CAGR during the forecast period.
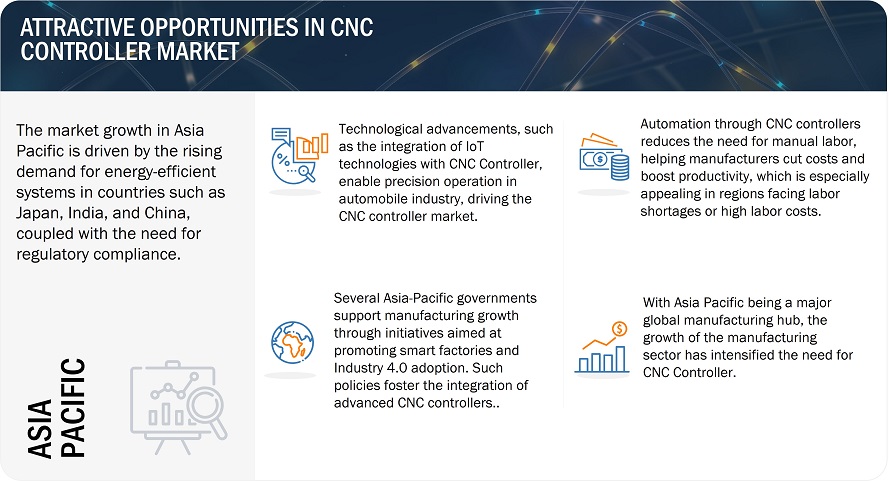
The Asia-Pacific region, especially India, is experiencing rapid growth in the automotive sector, driving demand for CNC controllers. According to the India Brand Equity Foundation, India’s passenger car market, valued at USD 32.70 billion in 2021, is projected to reach USD 54.84 billion by 2027, with a CAGR of over 9%. In FY24, India’s total vehicle production exceeded 28.4 million units, fuelling the need for precise CNC machining of critical components. The growth of the electric vehicle (EV) market is also significant, with Asia-Pacific, led by China and India, driving expansion. The global EV market, valued at USD 250 billion in 2021, is expected to reach USD 1,318 billion by 2028. It will increase demand for CNC controllers for components like battery housings and electric motors, as automation is key to success in a competitive market. Adopting Industry 4.0 technologies, including IoT and AI analytics, further enhances manufacturing efficiency, productivity, and quality.
CNC controller Market by Region
To know about the assumptions considered for the study, download the pdf brochure
Key Market Players
Leading players operating in the CNC controller Market are as follows:
- FANUC COPRORATION (Japan)
- DMG MORI (Germany)
- Siemens (Germany)
- Haas Automation Inc. (US)
- Hurco Companies, Inc. (US)
- OKUMA CORPORATION (Japan)
- Fagor Automation (Spain)
- Yamazaki Mazak Corporation (Japan)
- MITSUBISHI ELECTRIC (Japan)
- Bosch Rexroth AG (Germany)
Recent Developments
- In August 2024, FANUC CORPORATION launched its new innovative FANUC Series 500i-A CNC. This advanced control series brings about a new level of machinery performance by offering integrated 5-axis technology to meet the evolving needs of machine tool manufacturers and CNC operators. It brings about new levels of operational simplicity, increased security, and optimized efficiency to set a new benchmark in CNC technology.
- In May 2024, Siemens launches Sinumerik One-the control platform for CNC. The CNC control platform integrates hardware and software to create a digital twin of the machine, enabling hassle-free interaction between virtual and real environments, thus increasing productivity and performance. The Sinumerik One platform has been prepared to support the Digital Transformation of the machine tool industry and, therefore, is future-proof.
- In October 2023, DMG MORI acquired KURAKI Co., Ltd., which designs and manufactures CNC horizontal boring and milling machines. This is to fit its overall strategy to enrich products, especially within the aerospace and renewable energy industries. This acquisition by DMG MORI, combining advanced technology and the engineering expertise of KURAKI, fits within the company's thrust into digital transformation and automation.
- In July 2023, FANUC CORPORATION launched CNC Reflection Studio, a software tool that checks machine motions on PC. The software includes collision checks, workpiece material removal checks, and a machining program editor. Integrated with CNC GUIDE 2, it ensures accurate G-code execution, precise tool path checks with acceleration/deceleration, and reliable CNC parameter validation
- In July 2023, Okuma America Corporation launched its Next-Generation CNC Machine Control OSP-P500. The new Okuma Corporation CNC system boasts advanced processing power that enables a reduction of up to 15% in cycle times. It also sports a Digital Twin for precise simulation of machining processes, therefore allowing shorter setup times and increased production rates, all without energy inefficiency and cyber insecurity.
Frequently Asked Questions (FAQ):
What are the CNC controller market's major driving factors and opportunities?
The CNC controller market is driven by the growing demand for automation, especially with Industry 4.0 initiatives, which focus on smart manufacturing and IoT integration. Precision and efficiency needs across industries like aerospace, automotive, and medical devices further propel this demand, as do the benefits of reduced labor costs through automation. Opportunities include the rapid industrialization of emerging markets, integration with additive manufacturing, and advancements in AI and machine learning to enhance system adaptability and reduce downtime.
Which region is expected to hold the highest market share?
Asia Pacific commands a larger share of the CNC controller market. The expanding industrial sector is driving the demand for cleaning solutions, which are driving the market in the Asia Pacific.
Who are the leading players in the global the CNC controller market?
Leading players operating in the CNC controller market are FANUC CORPORATION (Japan), DMG MORI (Germany), Siemens (Germany), Haas Automation Inc. (US), and OKUMA CORPORATION (Japan). Etc.
What is the size of the global CNC controller market?
The global CNC controller market is expected to be valued at USD 3238.2 billion in 2025 and is projected to reach USD 4089.8 billion by 2030, at a CAGR of 4.8% from 2025–2030.
To speak to our analyst for a discussion on the above findings, click Speak to Analyst

Table of Contents
-
Introduction
- Study Objectives
- Market Definition
-
Study Scope
- Inclusions and Exclusions
- Markets Covered
- Geographic Segmentation
- Years Considered for the study
- Currency
- Limitations
- Stakeholders
- Summary of Changes
-
Research Methodology
-
Research Data
-
Secondary Data
- Major Secondary Sources
- Key Data from Secondary Sources
-
Primary Data
- Primary Interviews with Experts
- Key Data from Primary Sources
- Key Industry Insights
- Breakdown of Primaries
-
Market Size Estimation
-
Bottom-Up Approach
- Approach for Capturing Market Share by Bottom-Up Analysis (Demand Side)
-
Top-Down Approach
- Approach for Capturing Market Share by Top-Down Analysis (Supply Side)
- Market Breakdown and Data Triangulation
- Research Assumptions
- Risk Assessment
- Limitations of Research
-
Bottom-Up Approach
-
Secondary Data
-
Research Data
- Executive Summary
- Premium Insights
-
Market Overview
- Introduction
- Market Dynamics
- Trends/Disruptions Impacting Customer’s Business
-
Pricing Analysis
- Average Selling Price Trend of Key Players, By Type
- Average Selling Price Trend, By Region
- Value Chain Analysis
- Ecosystem Analysis
- Investment and Funding Scenario
-
Technology Analysis
- Key Technologies
- Complementary Technologies
- Adjacent Technology
- Patent Analysis
- Trade Analysis
- Key Conferences and Events (2024-2025)
- Case Study Analysis
-
Regulatory Landscape
- Regulatory Bodies, Government Agencies, and Other Organizations
-
Porters Five Force Analysis
- Threat from New Entrants
- Threat of Substitutes
- Bargaining Power of Suppliers
- Bargaining Power of Buyers
- Intensity of Competitive Rivalry
-
Key Stakeholders and Buying Criteria
- Key Stakeholders in Buying Process
- Buying Criteria
- Impact of AI/GenAI on CNC Controller Market
-
TYPES OF CNC CONTROLLERS
- Introduction
-
Types based on Installation
- New CNC Controller
- Retrofitted CNC Controllers
-
TYPES BASED ON DESIGN
- Open-Loop CNC Controller
- Closed-Loop CNC Controller
-
TYPES BASED ON CONSTRUCTION
- Micro-Controller-Based
- Motion Control Chip-Based
- DSP-Based
-
CNC CONTROLLER MARKET, BY OFFERINGS
- Introduction
- HARDWARE
- Software & Services
-
CNC CONTROLLER MARKET, BY MACHINE TYPE
- Introduction
- CNC MACHINING CENTER
- CNC TURNING CENTER
-
CNC CONTROLLER MARKET, BY AXIS TYPE
- INTRODUCTION
- 2-AXIS
- 3-AXIS
- 4-AXIS
- 5-AXIS
- MULTI-AXIS
- CNC CONTROLLER MARKET, BY SALES CHANNEL
10.1 INTRODUCTION
10.2 DIRECT
10.3 INDIRECT
-
CNC CONTROLLER MARKET, BY INDUSTRY
- INTRODUCTION
- AEROSPACE
- AUTOMOTIVE
- MEDICAL DEVICES
- METALS & MINING
- SEMICONDUCTOR & ELECTRONICS
11.7 OTHERS
-
CNC Controller Market, By Region
- Introduction
-
North America
- Macro-Economic Outlook for North America
- US
- Canada
- Mexico
-
Europe
- Macro-Economic Outlook of Europe
- UK
- Germany
- France
- Rest of Europe
-
Asia Pacific
- Macro-Economic Outlook of Asia Pacific
- China
- Japan
- India
- South Korea
- Rest of Asia Pacific
-
RoW
- Macro-Economic Outlook
-
Middle East
- GCC Countries
- Rest of Middle East
- Africa
- South America
-
CNC Controller Market, Competitive Landscape
- Key Player Strategies/Right to Win
- Revenue Analysis
- Market Share Analysis
- Company Valuation and Financial Metrics
- Product/Brand Comparison
-
Company Evaluation Matrix: Key Players, 2023
- Stars
- Emerging Leaders
- Pervasive Players
- Participants
-
Company Footprint: Key Players, 2023
- Company Footprint
- Region Footprint
- Type Footprint
- Industry Footprint
- Offering Footprint
-
Company Evaluation Matrix: Startups/SMEs, 2023
- Progressive Companies
- Responsive Companies
- Dynamic Companies
- Starting Blocks
-
Competitive Benchmarking: Startups/SMEs, 2023
- Detailed List of Key Startups/SMEs
- Competitive Benchmarking of Key Startups/SMEs
-
Competitive Situation and Trends
- Product launches
- Acquisitions
- Partnerships, Collaborations, Alliances, and Joint Ventures
-
CNC Controller Market, Company Profiles
-
Key Players
- FANUC CORPORATION
- SIEMENS
- MITSUBISHI ELECTRIC
- DMG MORI
- HAAS AUTOMATION
- HURCO COMPANIES
- OKUMA
- BOSCH REXROTH
- FAGOR AUTOMATION
- YAMAZAKI MAZAK
-
Other Players
- MACHINE TOOL TECHNOLOGIES (MTT)
- WUHAN HUAZHONG NUMERICAL CONTROL
- NUM
- LINCOLN ELECTRIC
- POWERMATIC TOOLS
- HEIDENHAIN
- CENTROID
- GLOBAL MACHINES
- BUILDBOTICS
- TORMACH
- CNC MASTERS.
- AVID CNC
- ADTECH CNC EUROPE
- LUNA BEARINGS.
- ZEN AUTOMATION
-
Key Players
-
Appendix
- Discussion Guide
- Knowledge Store: MarketsandMarkets’ Subscription Portal
- Available Customizations
- Related Reports
- Author Details
Note: This is a tentative ToC and it may change as we proceed with the research.
The study involves four major activities for estimating the size of the CNC controllermarket. Exhaustive secondary research has been conducted to collect information related to the market. The next step has been the validation of these findings, assumptions, and sizing with the industry experts across the value chain through primary research. Both top-down and bottom-up approaches have been employed to estimate the overall size of the CNC controller market. After that, market breakdown and data triangulation procedures have been used to determine the extent of different segments and subsegments of the market.
Secondary Research
Secondary sources referred to in this research study include corporate filings (such as annual reports, investor presentations, and financial statements); trade, business, and professional associations; white papers, certified publications, articles from recognized authors; directories; and databases. The secondary data has been collected and analyzed to arrive at the overall market size estimations, which have been further validated by primary research.
Primary Research
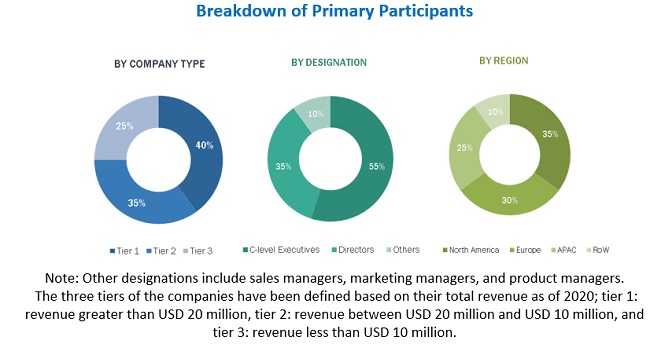
In the primary research process, a number of primary sources from both supply and demand sides have been interviewed to obtain the qualitative and quantitative information pertaining to this report. Several primary interviews have been conducted with market experts from both demand and supply sides (CNC controller manufacturers and distributors). This primary data has been collected through questionnaires, emails, and telephonic interviews. Approximately 20% of the primary interviews have been conducted with the demand side and 80% with the supply side. This primary data has been collected mainly through telephonic interviews, which accounted for 70% of the total primary interviews. Additionally, questionnaires and emails were used to collect the data.
To know about the assumptions considered for the study, download the pdf brochure
Market Size Estimation
In the complete market engineering process, both top-down and bottom-up approaches have been implemented, along with several data triangulation methods, to estimate and validate the size of the CNC controller market and other dependent submarkets listed in this report.
- The key players in the industry and markets have been identified through extensive secondary research.
- Both the supply chain of the industry and the market size, in terms of value has been determined through primary and secondary research.
- All percentage shares, splits, and breakdowns have been determined using secondary sources and verified through primary sources.
Data Triangulation
After arriving at the overall market size, the total market has been split into several segments. To complete the overall market engineering process and arrive at exact statistics for all segments, the market breakdown and data triangulation procedures have been employed wherever applicable. The data has been triangulated by studying various factors and trends from both the demand and supply sides. The market has also been validated using both top-down and bottom-up approaches.
Study Objectives:
- To define, describe, and forecast the size of the CNC controller market based on offering, machine type, axis type, sales channel, industry, and region in terms of value
- To forecast the market size, in terms of value, for various segments with respect to four main regions: North America, Europe, Asia Pacific (APAC), and Rest of the World (RoW)
- To provide detailed information regarding the major factors influencing the growth of the market (drivers, restraints, opportunities, and industry-specific challenges)
- To study and analyze the influence of COVID-19 on the market during the forecast period
- To strategically analyze the micromarkets1 with respect to individual growth trends, prospects, and contribution to the total market
- To strategically profile key players and comprehensively analyze their market shares and core competencies2, and provide a detailed competitive landscape for market leaders
- To analyze various development strategies such as product launches, developments, and expansions implemented by key market players
- To benchmark players within the market using the proprietary Competitive Leadership Mapping framework which analyzes market players on various parameters within the broad categories of business and product strategies and their market shares
Available Customizations:
With the given market data, MarketsandMarkets offers customizations according to the company's specific needs. The following customization options are available for this report:
- Detailed analysis and profiles of additional market players (Up to 5)


 Generating Response ...


Growth opportunities and latent adjacency in CNC Controller Market