Healthcare Education Market by Provider (Universities, Educational Platforms, Medical Simulation), Delivery Mode (Classroom-based, E-Learning), Application (Neurology, Cardiology, Pediatrics), End User (Students, Physicians) - Global Forecasts to 2028
Healthcare Education Market Size, Growth Drivers & Restraints
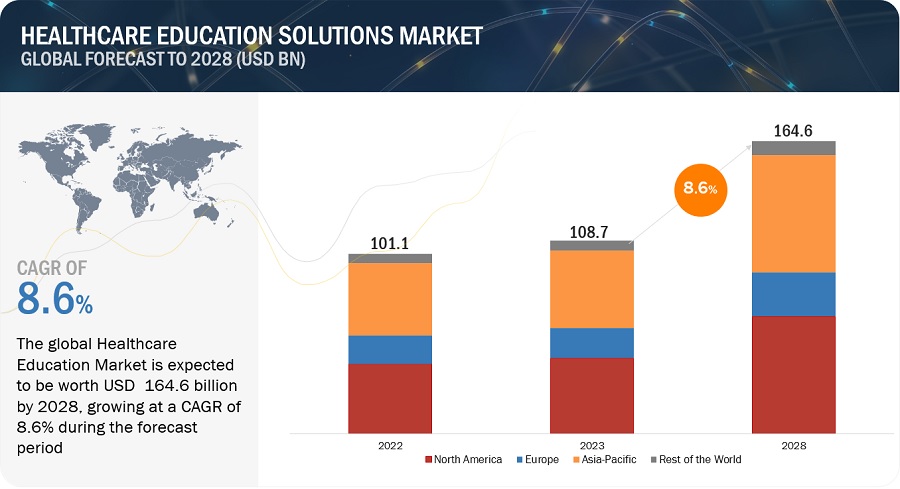
The global healthcare education market, valued at US$101.1 billion in 2022, stood at US$108.7 billion in 2023 and is projected to advance at a resilient CAGR of 8.6% from 2025 to 2028, culminating in a forecasted valuation of US$164.6 billion by the end of the period. The healthcare education solutions market's growth is driven by technological advancements, the focus on patient safety and quality care, the shortage of healthcare professionals, and the impact of the COVID-19 pandemic. These factors collectively create a favorable environment for the expansion of the market as healthcare organizations increasingly recognize the value of continuous education and invest in innovative solutions to meet the evolving needs of their workforce. Concerns about data breaches, unauthorized access, and compliance with privacy regulations can act as barriers to market growth.
Attractive Opportunities in Healthcare Education Market
To know about the assumptions considered for the study, Request for Free Sample Report
Healthcare Education Market Dynamics
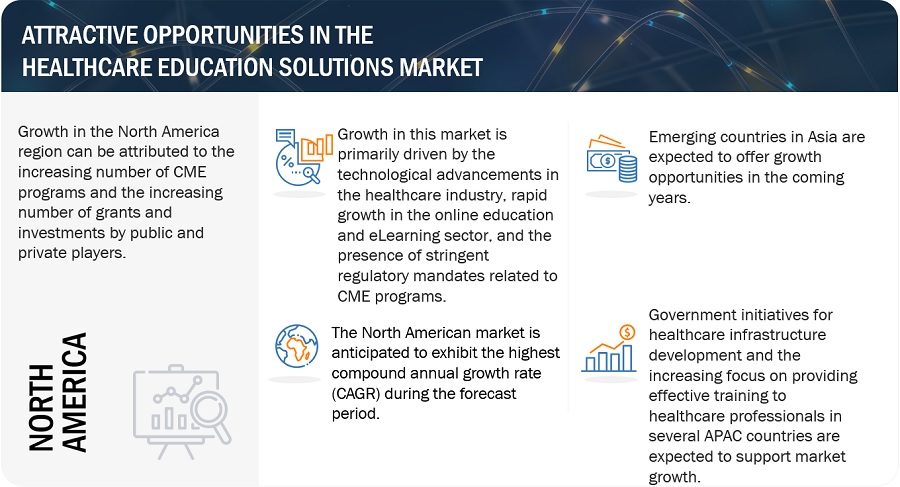
Driver: Increasing adoption of digital learning
Educational solutions have witnessed increasing acceptance and adoption, with advancements in technology reshaping the learning landscape. The primary goal of online education solutions is to effectively administer the learning process while fostering an immersive and interactive learning environment that incorporates additional functionalities to enhance learning capabilities.
The traditional approach to medical training presents several drawbacks, including high costs associated with establishing and maintaining physical training centers and difficulties in keeping up with evolving trends in disease treatments, medical technologies, and pharmaceuticals. However, eLearning solutions effectively address these challenges by offering flexible learning options. Healthcare professionals, including doctors, can conveniently take courses at their own pace, eliminating time and location constraints. One significant advantage of eLearning is the opportunity for students to preview courses before making payment, enabling them to complete an entire class and evaluate its value before committing to certification. This feature holds particular relevance for medical professionals seeking continuing education, as they can assess the course content, quality, and alignment with their learning objectives before making a financial commitment. Continuing medical education (CME) solutions, in particular, have gained widespread acceptance among physicians and non-physician healthcare professionals seeking to stay updated with rapidly evolving technologies. In countries like Canada, physicians are required to accumulate a minimum of 400 CME points, leading to a growing adoption of CME programs to fulfill this requirement.
Government entities in numerous countries worldwide are actively offering eLearning courses to healthcare professionals. For instance, the US government operates the Healthy People eLearning platform, which serves as an online educational resource assisting students and healthcare practitioners in achieving the nation's health objectives. Likewise, the European Union has implemented various e-health programs, including Intervention Research on Health Literacy among Ageing Populations (IROHLA), which focuses on enhancing health literacy for older individuals in Europe. Additionally, initiatives like ENS4Care aim to enhance e-skills for nurses and social care workers while providing evidence-based clinical guidelines for the implementation of eHealth services. The increasing adoption of digital learning solutions within organizations is projected to fuel the growth of the healthcare education solutions market.
Restraint: Unreliable infrastructure in most developing countries
The lack of reliable internet connectivity and electricity supply in several developing countries poses a challenge for accessing and downloading online course content. These limitations hinder individuals from effectively participating in online education. The Asia Pacific and the Middle East, and African regions specifically face infrastructure deficiencies that impede students' access to online learning. However, there are promising developments as governments in these countries are increasingly taking initiatives to improve digital infrastructure. These efforts are expected to enable online education providers to expand their services to a larger student population in the future. Additionally, the healthcare education market is constrained by eLearning's limitations in providing practical and real-life understanding, particularly in medical courses. These factors collectively hinder the growth potential of healthcare education.
Opportunity: Increasing adoption of adaptive learning
Adaptive learning is an educational approach that adjusts the course content based on the user's performance. Utilizing Artificial Intelligence (AI), the adaptive learning system enables online education providers to deliver personalized courses to their students. Since online course participants come from diverse backgrounds, possess varying levels of subject proficiency, and exhibit different aptitudes, it becomes challenging to cater to each individual's pace in a traditional system. However, adaptive learning empowers online education providers to offer content that is better suited to each student. This personalized approach presents a substantial opportunity for digital education providers in the foreseeable future.
Challenge: Lack of skilled trainers and instructors
The current situation reveals a notable scarcity of proficient trainers and instructors capable of effectively imparting subject matter to employees. To support both instructor-led and distance learning approaches, it is imperative to have trainers who possess the necessary expertise in handling relevant software solutions. These instructors should possess the technical acumen to seamlessly integrate supplementary features, materials, and activities into the learners' education portal. Moreover, addressing the challenge of learner's unawareness regarding their skill gaps and learning needs is of utmost importance in optimizing their educational experience.
Healthcare Education Market Ecosystem
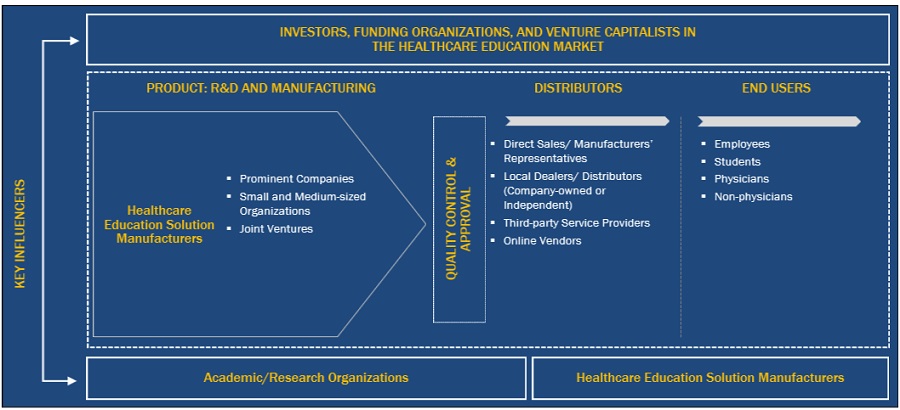
The aspects present in this market are included in the ecosystem market map of the overall healthcare education market, and each element is defined with a list of the organizations involved. Products and services are included. The manufacturers of various products include the organizations involved in the entire process of research, product development, optimization, and launch. Vendors provide the services to end users either directly or through a collaboration with a third party.
In-house research facilities, contract research organizations, and contract development and manufacturing companies are all part of research and product development and are essential for outsourcing product development services.
Source: Secondary Literature, Interviews with Experts, and MarketsandMarkets Analysis
The global healthcare education solution market is segmented by provider, delivery mode, application, end-user, and region.
Providers bear the responsibility of introducing innovative educational solutions and enhancing the landscape of the healthcare education industry.
In 2022, the universities and academic centers of the provider segments segment held the largest share of the healthcare education market. The growth of universities and academic centers in the healthcare education solutions market is fueled by the demand for skilled healthcare professionals, the need for continuous learning in a rapidly evolving industry, partnerships with healthcare organizations, and the focus on patient-centered care and interprofessional collaboration. The aforementioned factors contribute to the expansion and development of healthcare education programs to meet the demands of the healthcare sector.
E-Learning solutions have demonstrated the highest Compound Annual Growth Rate (CAGR) within the delivery mode segment of the healthcare education industry.
In 2022, the classroom-based courses of delivery mode segment accounted for the largest share of the healthcare education market. However, the eLearning solutions segment is projected to register the highest growth in the forecast period. The growth of e-learning solutions in the healthcare education market is driven by the digitization of the healthcare industry, the flexibility and accessibility they offer, their cost-effectiveness, and the advancements in technology that enhance the learning experience. These factors collectively contribute to the expansion of e-learning in healthcare education, enabling healthcare professionals to acquire the necessary skills and knowledge conveniently and efficiently.
The growth of the academic education segment of the healthcare education industry is being propelled by the increasing demand for proficient healthcare professionals.
In 2022, the academic education of application segment held the largest market share within the healthcare education market. The growth of the academic education segment in the healthcare education solutions market is driven by the demand for skilled healthcare professionals, the need to integrate advancements in medical technology and research, the importance of evidence-based practice, and the emphasis on interdisciplinary collaboration. These factors are responsible for the expansion and development of academic education programs that enhance the evolving demands of the healthcare industry.
The expanding availability and accessibility of healthcare education solutions are creating new opportunities for students, thereby fueling the growth of the end users segment in the healthcare education industry.
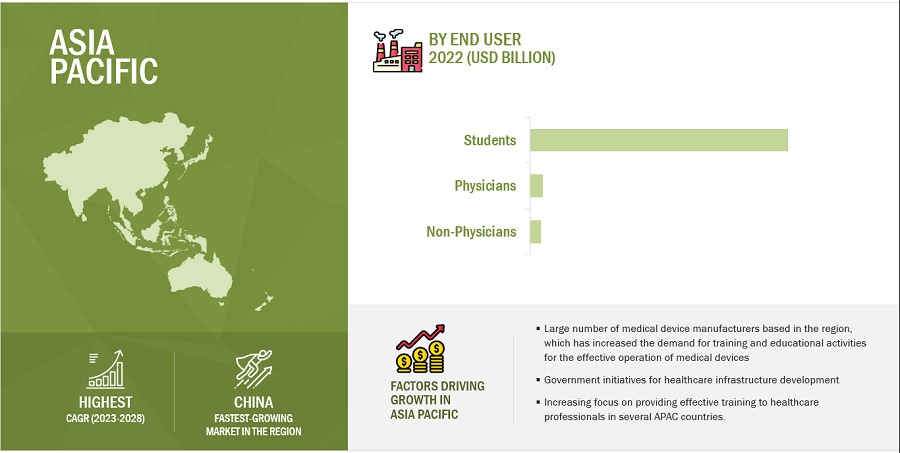
The healthcare education market is segmented based on end users, including students, physicians, and non-physicians. In 2022, the students segment held the largest market share. The increasing availability and accessibility of healthcare education solutions, particularly online and distance learning options, have expanded student opportunities. Online platforms and digital resources allow students to learn at their own pace, from anywhere and at any time. This accessibility allows students to pursue healthcare education while balancing other commitments, making it more feasible for individuals from diverse backgrounds to enter the healthcare field.
To know about the assumptions considered for the study, download the pdf brochure
The rapid population growth in the Asia Pacific region of the global healthcare education industry has resulted in a surge in the demand for healthcare services, consequently driving the need for healthcare education solutions.
In 2022, the Asia Pacific region accounted for the largest share of the healthcare education market. The rapidly expanding population in the Asia Pacific has led to an increased demand for healthcare services. As the population grows, there is a need for a larger healthcare workforce to address the healthcare needs of the growing population. This drives the demand for healthcare education solutions to train and equip healthcare professionals with the necessary knowledge and skills.
Some of the prominent players operating in the healthcare education market are Stryker (US), SAP (Germany), Adobe (US), Infor (US), Oracle (US), HealthStream (US), Symplr (US), Elsevier (Netherlands), Articulate (US), PeopleFluent (US), Fujifilm Corporation (Japan), GE Healthcare (US), Trivantis Corporation (US), Koninklijke Phillips (Netherlands), Siemens Healthineers (Germany), Coursera (US), and IBM (US).
Scope of the Healthcare Education Industry
|
Report Metric |
Details |
|
Market Revenue in 2023 |
$108.7 billion |
|
Projected Revenue by 2028 |
$164.6 billion |
|
Revenue Rate |
Poised to Grow at a CAGR of 8.6% |
|
Market Driver |
Increasing adoption of digital learning |
|
Market Opportunity |
Increasing adoption of adaptive learning |
This study categorizes the global healthcare education market to forecast revenue and analyze trends in each of the following submarkets:
By Provider
- Universities and Academic Centers
- Continuing Medical Education Providers
- OEMs/Pharmaceutical Companies
- Learning Management Systems
- Educational Platforms
- Medical Simulation
By Delivery Mode
- Classroom-based courses
- E-Learning solutions
By Application
- Academic Education
- Cardiology
- Neurology
- Radiology
- Internal Medicine
- Pediatrics
- Others applications
By End User
- Students
- Physicians
- Non Physicians
By Region
-
North America
- US
- Canada
-
Europe
- Germany
- UK
- France
- Rest of Europe (RoE)
-
Asia Pacific
- Japan
- China
- India
- Rest of APAC (RoAPAC)
- RoW
Recent Developments of Healthcare Education Industry
- In 2023, HealthStream (US) acquired Electronic Education Documentation System, LLC (US), which will expand Healthstream’s ecosystem by introducing a cutting-edge, cloud-based continuing education management system for healthcare organizations, delivering innovative solutions in the form of Software-as-a-Service (SaaS).
- In 2023, GE Healthcare (US) collaborated with DePuy Synthes (US) to expand the availability of GE Healthcare's OEC 3D Imaging System alongside DePuy Synthes' comprehensive product portfolio, providing increased access to surgeons and benefiting more patients throughout the United States.
- In 2023, Koninklijke Philips N.V (Netherland) partnered with TriHealth (US). TriHealth will implement Philips' comprehensive portfolio of cardiology solutions at the TriHealth Heart & Vascular Institute located at Bethesda North Hospital and the Harold and Eugenia Thomas Comprehensive Care Center. This partnership enables TriHealth to enhance cardiac care while upholding its commitment to delivering high-quality healthcare, fostering community well-being, promoting collaboration with physicians and providers, and supporting the education of future healthcare professionals.
- In 2022, Siemens Healthineers AG (Germany) partnered with the University of Miami Health System (US), the University of Miami Health System (US) will experience technological advancement and equipment standardization, and it will also develop educational and training programs tailored for clinicians and technologists.
Frequently Asked Questions (FAQ):
What is the projected market revenue value of the global healthcare education market?
The global healthcare education market boasts a total revenue value of $164.6 billion by 2028.
What is the estimated growth rate (CAGR) of the global healthcare education market?
The global healthcare education market has an estimated compound annual growth rate (CAGR) of 8.6% and a revenue size in the region of $108.7 billion in 2023.
To speak to our analyst for a discussion on the above findings, click Speak to Analyst


- 5.1 INTRODUCTION
-
5.2 MARKET DYNAMICSDRIVERS- Increasing adoption of digital learning for medical professionals- Increased training needs due to constantly evolving technologies in medical industry- Greater adoption of continuing medical education programsRESTRAINTS- Lack of face-to-face interaction and direct monitoring- Unreliable internet connectivity and electricity infrastructure in emerging economiesOPPORTUNITIES- Growing focus on patient safety and care quality in healthcare organizations- Increasing adoption of adaptive learning among medical studentsCHALLENGES- Increased competition for offering best-in-class services at lower cost- Lack of skilled trainers and instructors with adequate technical knowledge
-
5.3 ECOSYSTEM MARKET MAP
- 5.4 TECHNOLOGY ANALYSIS
-
5.5 REGULATORY ANALYSISDISTANCE LEARNING AND INNOVATION REGULATION, 2020COMMON CARTRIDGEAUSTRALIAN EDUCATION ACTEDUCATION SERVICES FOR OVERSEAS STUDENTS ACT
- 5.6 PRICING ANALYSIS
- 5.7 ROLE OF MEDICAL SIMULATION IN HEALTHCARE EDUCATION MARKET
- 6.1 INTRODUCTION
-
6.2 UNIVERSITIES AND ACADEMIC CENTERSUNIVERSITIES AND ACADEMIC CENTERS COMMANDED LARGEST SHARE OF HEALTHCARE EDUCATION PROVIDERS MARKET IN 2022
-
6.3 CONTINUING MEDICAL EDUCATION PROVIDERSINCREASING PARTICIPATION OF NURSES, PHYSICIAN ASSISTANTS, AND PHARMACISTS IN EDUCATIONAL ACTIVITIES TO DRIVE MARKET
-
6.4 OEMS/PHARMACEUTICAL COMPANIESINCREASING NUMBER OF PHARMACEUTICAL COMPANIES OFFERING MEDICAL EDUCATION TO DRIVE MARKET
-
6.5 LEARNING MANAGEMENT SYSTEM PROVIDERSGROWING USE OF ARTIFICIAL INTELLIGENCE AND MACHINE LEARNING TO DRIVE MARKET
-
6.6 EDUCATIONAL PLATFORMSINCREASED ADOPTION OF E-LEARNING SOLUTIONS AFTER COVID-19 TO DRIVE MARKET
-
6.7 MEDICAL SIMULATION PROVIDERSGROWING AWARENESS OF SIMULATION EDUCATION IN EMERGING ECONOMIES TO DRIVE MARKET
- 7.1 INTRODUCTION
-
7.2 CLASSROOM-BASED COURSESCLASSROOM-BASED COURSES TO PROVIDE BETTER HANDS-ON TRAINING EXPERIENCE TO PROFESSIONALS
-
7.3 E-LEARNING SOLUTIONSGREATER FLEXIBILITY IN TRAINING SCHEDULES WITH BETTER ACCESSIBILITY TO LEARNING MATERIALS TO DRIVE MARKET
- 8.1 INTRODUCTION
-
8.2 ACADEMIC EDUCATIONHEALTHCARE SOLUTIONS TO SIMPLIFY LEARNING PROCESSES IN HIGHER ACADEMIC INSTITUTIONS
-
8.3 CARDIOLOGYCARDIOLOGY SEGMENT TO REGISTER HIGHEST GROWTH RATE DURING FORECAST PERIOD
-
8.4 NEUROLOGYINCREASED HEALTHCARE EDUCATION SERVICES AND SOLUTIONS FOR NEUROLOGY IN EMERGING ECONOMIES TO DRIVE MARKET
-
8.5 RADIOLOGYINCREASE IN NUMBER OF DOCTORS/PHYSICIANS UNDERGOING RADIOLOGY TRAINING TO DRIVE MARKET
-
8.6 INTERNAL MEDICINEINCREASED NEED TO SOLVE COMPLEX DIAGNOSTIC PROBLEMS AND HANDLE CHRONIC ILLNESSES TO DRIVE MARKET
-
8.7 PEDIATRICSNEED FOR RECERTIFICATION OF PEDIATRICIANS TO INCREASE DEMAND FOR ONLINE EDUCATION COURSES
- 8.8 OTHER APPLICATIONS
- 9.1 INTRODUCTION
-
9.2 STUDENTSSTUDENTS SEGMENT COMMANDED LARGEST SHARE OF HEALTHCARE EDUCATION END USER MARKET IN 2022
-
9.3 PHYSICIANSINCREASING MEDICAL GRANTS PROVIDED BY GOVERNMENT BODIES GLOBALLY TO DRIVE MARKET
-
9.4 NON-PHYSICIANSNON-PHYSICIANS SEGMENT TO GROW AT HIGHEST CAGR DURING STUDY PERIOD
- 10.1 INTRODUCTION
-
10.2 NORTH AMERICAUS- US commanded largest share of North American healthcare education market in 2022CANADA- Increasing number of grants from national medical societies and governing bodies to drive market
-
10.3 EUROPEGERMANY- Germany dominated European healthcare education market in 2022UK- UK to be fastest-growing country in European healthcare education market during forecast periodFRANCE- Shortage of healthcare workers to limit marketREST OF EUROPE
-
10.4 ASIA PACIFICJAPAN- Increased educational activities by OEMs to drive marketCHINA- Increasing number of government initiatives and reforms in healthcare sector to drive marketINDIA- Increasing number of medical schools providing health-related education to drive marketREST OF ASIA PACIFIC
- 10.5 REST OF THE WORLD

- 11.1 OVERVIEW
- 11.2 MARKET RANKING ANALYSIS
- 11.3 REVENUE SHARE ANALYSIS OF KEY PLAYERS
- 11.4 R&D EXPENDITURE: HEALTHCARE EDUCATION MARKET
- 11.5 COMPETITIVE BENCHMARKING
-
11.6 COMPANY EVALUATION MATRIXSTARSEMERGING LEADERSPARTICIPANTSPERVASIVE PLAYERS
-
11.7 COMPETITIVE SCENARIOKEY PRODUCT LAUNCHES AND APPROVALSKEY DEALS
-
12.1 KEY PLAYERSSTRYKER- Business overview- Products offered- Recent developments- MnM viewSAP- Business overview- Products offered- MnM viewADOBE- Business overview- Products offered- MnM viewORACLE- Business overview- Products offered- Recent developments- MnM viewHEALTHSTREAM- Business overview- Products offered- Recent developments- MnM viewGE HEALTHCARE- Business overview- Products offered- Recent developmentsSIEMENS HEALTHINEERS AG- Business overview- Products offered- Recent developments- Other developmentsKONINKLIJKE PHILIPS N.V.- Business overview- Products offered- Recent developmentsIBM- Business overview- Products offeredFUJIFILM CORPORATION- Business overview- Products offered- Recent developmentsSYMPLR- Business overview- Products offered- Recent developmentsINFOR- Business overview- Products offered- Recent developmentsELSEVIER- Business overview- Products offered- Recent developments- Other developmentsARTICULATE GLOBAL, LLC- Business overview- Products offeredPEOPLEFLUENT- Business overview- Products offeredTRIVANTIS CORPORATION- Business overview- Products offeredACADEMY OF MEDICINE OF RICHMOND- Business overview- Products offeredCOURSERA- Business overview- Products offeredCENTRAL MICHIGAN UNIVERSITY (CMU) COLLEGE OF MEDICINE- Business overview- Products offeredVIRTAMED AG- Business overview- Products offered- Recent developments
-
12.2 OTHER PLAYERSHEALTH SCHOLARSBIOFLIGHT VRHAAG-STREIT SIMULATION GMBH
- 13.1 DISCUSSION GUIDE
- 13.2 KNOWLEDGESTORE: MARKETSANDMARKETS’ SUBSCRIPTION PORTAL
- 13.3 CUSTOMIZATION OPTIONS
- 13.4 RELATED REPORTS
- 13.5 AUTHOR DETAILS
- TABLE 1 ANNUAL AVERAGE EXCHANGE RATES FOR CURRENCY CONVERSIONS TO USD
- TABLE 2 RISK ASSESSMENT: HEALTHCARE EDUCATION MARKET
- TABLE 3 TECHNOLOGICAL DEVELOPMENTS BY LEADING VENDORS
- TABLE 4 TRAINING COST INCURRED FOR 1-DAY TRAINING OF EDUCATIONAL SOLUTIONS
- TABLE 5 PRICING RANGE OFFERED BY VENDORS ON DIFFERENT SOLUTIONS
- TABLE 6 HEALTHCARE EDUCATION MARKET, BY PROVIDER, 2021–2028 (USD MILLION)
- TABLE 7 HEALTHCARE EDUCATION MARKET FOR UNIVERSITIES AND ACADEMIC CENTERS, BY COUNTRY, 2021–2028 (USD MILLION)
- TABLE 8 HEALTHCARE EDUCATION MARKET FOR CONTINUING MEDICAL EDUCATION PROVIDERS, BY COUNTRY, 2021–2028 (USD MILLION)
- TABLE 9 HEALTHCARE EDUCATION MARKET FOR OEMS/PHARMACEUTICAL COMPANIES, BY COUNTRY, 2021–2028 (USD MILLION)
- TABLE 10 HEALTHCARE EDUCATION MARKET FOR LEARNING MANAGEMENT SYSTEM PROVIDERS, BY COUNTRY, 2021–2028 (USD MILLION)
- TABLE 11 HEALTHCARE EDUCATION MARKET FOR EDUCATIONAL PLATFORMS, BY COUNTRY, 2021–2028 (USD MILLION)
- TABLE 12 HEALTHCARE EDUCATION MARKET FOR MEDICAL SIMULATION PROVIDERS, BY COUNTRY, 2021–2028 (USD MILLION)
- TABLE 13 HEALTHCARE EDUCATION MARKET, BY DELIVERY MODE, 2021–2028 (USD MILLION)
- TABLE 14 HEALTHCARE EDUCATION MARKET FOR CLASSROOM-BASED COURSES, BY COUNTRY, 2021–2028 (USD MILLION)
- TABLE 15 HEALTHCARE EDUCATION MARKET FOR E-LEARNING SOLUTIONS, BY COUNTRY, 2021–2028 (USD MILLION)
- TABLE 16 HEALTHCARE EDUCATION MARKET, BY APPLICATION, 2021–2028 (USD MILLION)
- TABLE 17 HEALTHCARE EDUCATION MARKET FOR ACADEMIC EDUCATION, BY COUNTRY, 2021–2028 (USD MILLION)
- TABLE 18 HEALTHCARE EDUCATION MARKET FOR CARDIOLOGY, BY COUNTRY, 2021–2028 (USD MILLION)
- TABLE 19 HEALTHCARE EDUCATION MARKET FOR NEUROLOGY, BY COUNTRY, 2021–2028 (USD MILLION)
- TABLE 20 HEALTHCARE EDUCATION MARKET FOR RADIOLOGY, BY COUNTRY, 2021–2028 (USD MILLION)
- TABLE 21 HEALTHCARE EDUCATION MARKET FOR INTERNAL MEDICINE, BY COUNTRY, 2021–2028 (USD MILLION)
- TABLE 22 HEALTHCARE EDUCATION MARKET FOR PEDIATRICS, BY COUNTRY, 2021–2028 (USD MILLION)
- TABLE 23 HEALTHCARE EDUCATION MARKET FOR OTHER APPLICATIONS, BY COUNTRY, 2021–2028 (USD MILLION)
- TABLE 24 HEALTHCARE EDUCATION MARKET, BY END USER, 2021–2028 (USD MILLION)
- TABLE 25 HEALTHCARE EDUCATION MARKET FOR STUDENTS, BY COUNTRY, 2021–2028 (USD MILLION)
- TABLE 26 HEALTHCARE EDUCATION MARKET FOR PHYSICIANS, BY COUNTRY, 2021–2028 (USD MILLION)
- TABLE 27 HEALTHCARE EDUCATION MARKET FOR NON-PHYSICIANS, BY COUNTRY, 2021–2028 (USD MILLION)
- TABLE 28 HEALTHCARE EDUCATION MARKET, BY REGION, 2021–2028 (USD MILLION)
- TABLE 29 NORTH AMERICA: HEALTHCARE EDUCATION MARKET, BY COUNTRY, 2021–2028 (USD MILLION)
- TABLE 30 NORTH AMERICA: HEALTHCARE EDUCATION MARKET, BY PROVIDER, 2021–2028 (USD MILLION)
- TABLE 31 NORTH AMERICA: HEALTHCARE EDUCATION MARKET, BY END USER, 2021–2028 (USD MILLION)
- TABLE 32 NORTH AMERICA: HEALTHCARE EDUCATION MARKET, BY DELIVERY MODE, 2021–2028 (USD MILLION)
- TABLE 33 NORTH AMERICA: HEALTHCARE EDUCATION MARKET, BY APPLICATION, 2021–2028 (USD MILLION)
- TABLE 34 US: HEALTHCARE PROFESSIONALS (2023)
- TABLE 35 US: HEALTHCARE EDUCATION MARKET, BY PROVIDER, 2021–2028 (USD MILLION)
- TABLE 36 US: HEALTHCARE EDUCATION MARKET, BY END USER, 2021–2028 (USD MILLION)
- TABLE 37 US: HEALTHCARE EDUCATION MARKET, BY DELIVERY MODE, 2021–2028 (USD MILLION)
- TABLE 38 US: HEALTHCARE EDUCATION MARKET, BY APPLICATION, 2021–2028 (USD MILLION)
- TABLE 39 CANADA: HEALTHCARE PROFESSIONALS (2023)
- TABLE 40 CANADA: HEALTHCARE EDUCATION MARKET, BY PROVIDER, 2021–2028 (USD MILLION)
- TABLE 41 CANADA: HEALTHCARE EDUCATION MARKET, BY END USER, 2021–2028 (USD MILLION)
- TABLE 42 CANADA: HEALTHCARE EDUCATION MARKET, BY DELIVERY MODE, 2021–2028 (USD MILLION)
- TABLE 43 CANADA: HEALTHCARE EDUCATION MARKET, BY APPLICATION, 2021–2028 (USD MILLION)
- TABLE 44 EUROPE: HEALTHCARE EDUCATION MARKET, BY COUNTRY, 2021–2028 (USD MILLION)
- TABLE 45 EUROPE: HEALTHCARE EDUCATION MARKET, BY PROVIDER, 2021–2028 (USD MILLION)
- TABLE 46 EUROPE: HEALTHCARE EDUCATION MARKET, BY END USER, 2021–2028 (USD MILLION)
- TABLE 47 EUROPE: HEALTHCARE EDUCATION MARKET, BY DELIVERY MODE, 2021–2028 (USD MILLION)
- TABLE 48 EUROPE: HEALTHCARE EDUCATION MARKET, BY APPLICATION, 2021–2028 (USD MILLION)
- TABLE 49 GERMANY: HEALTHCARE PROFESSIONALS (2023)
- TABLE 50 GERMANY: HEALTHCARE EDUCATION MARKET, BY PROVIDER, 2021–2028 (USD MILLION)
- TABLE 51 GERMANY: HEALTHCARE EDUCATION MARKET, BY END USER, 2021–2028 (USD MILLION)
- TABLE 52 GERMANY: HEALTHCARE EDUCATION MARKET, BY DELIVERY MODE, 2021–2028 (USD MILLION)
- TABLE 53 GERMANY: HEALTHCARE EDUCATION MARKET, BY APPLICATION, 2021–2028 (USD MILLION)
- TABLE 54 UK: HEALTHCARE PROFESSIONALS (2023)
- TABLE 55 UK: HEALTHCARE EDUCATION MARKET, BY PROVIDER, 2021–2028 (USD MILLION)
- TABLE 56 UK: HEALTHCARE EDUCATION MARKET, BY END USER, 2021–2028 (USD MILLION)
- TABLE 57 UK: HEALTHCARE EDUCATION MARKET, BY DELIVERY MODE, 2021–2028 (USD MILLION)
- TABLE 58 UK: HEALTHCARE EDUCATION MARKET, BY APPLICATION, 2021–2028 (USD MILLION)
- TABLE 59 FRANCE: HEALTHCARE PROFESSIONALS (2023)
- TABLE 60 FRANCE: HEALTHCARE EDUCATION MARKET, BY PROVIDER, 2021–2028 (USD MILLION)
- TABLE 61 FRANCE: HEALTHCARE EDUCATION MARKET, BY END USER, 2021–2028 (USD MILLION)
- TABLE 62 FRANCE: HEALTHCARE EDUCATION MARKET, BY DELIVERY MODE, 2021–2028 (USD MILLION)
- TABLE 63 FRANCE: HEALTHCARE EDUCATION MARKET, BY APPLICATION, 2021–2028 (USD MILLION)
- TABLE 64 REST OF EUROPE: HEALTHCARE EDUCATION MARKET, BY PROVIDER, 2021–2028 (USD MILLION)
- TABLE 65 REST OF EUROPE: HEALTHCARE EDUCATION MARKET, BY END USER, 2021–2028 (USD MILLION)
- TABLE 66 REST OF EUROPE: HEALTHCARE EDUCATION MARKET, BY DELIVERY MODE, 2021–2028 (USD MILLION)
- TABLE 67 REST OF EUROPE: HEALTHCARE EDUCATION MARKET, BY APPLICATION, 2021–2028 (USD MILLION)
- TABLE 68 ASIA PACIFIC: HEALTHCARE EDUCATION MARKET, BY COUNTRY, 2021–2028 (USD MILLION)
- TABLE 69 ASIA PACIFIC: HEALTHCARE EDUCATION MARKET, BY PROVIDER, 2021–2028 (USD MILLION)
- TABLE 70 ASIA PACIFIC: HEALTHCARE EDUCATION MARKET, BY END USER, 2021–2028 (USD MILLION)
- TABLE 71 ASIA PACIFIC: HEALTHCARE EDUCATION MARKET, BY DELIVERY MODE, 2021–2028 (USD MILLION)
- TABLE 72 ASIA PACIFIC: HEALTHCARE EDUCATION MARKET, BY APPLICATION, 2021–2028 (USD MILLION)
- TABLE 73 JAPAN: HEALTHCARE PROFESSIONALS (2023)
- TABLE 74 JAPAN: HEALTHCARE EDUCATION MARKET, BY PROVIDER, 2021–2028 (USD MILLION)
- TABLE 75 JAPAN: HEALTHCARE EDUCATION MARKET, BY END USER, 2021–2028 (USD MILLION)
- TABLE 76 JAPAN: HEALTHCARE EDUCATION MARKET, BY DELIVERY MODE, 2021–2028 (USD MILLION)
- TABLE 77 JAPAN: HEALTHCARE EDUCATION MARKET, BY APPLICATION, 2021–2028 (USD MILLION)
- TABLE 78 CHINA: HEALTHCARE PROFESSIONALS (2023)
- TABLE 79 CHINA: HEALTHCARE EDUCATION MARKET, BY PROVIDER, 2021–2028 (USD MILLION)
- TABLE 80 CHINA: HEALTHCARE EDUCATION MARKET, BY END USER, 2021–2028 (USD MILLION)
- TABLE 81 CHINA: HEALTHCARE EDUCATION MARKET, BY DELIVERY MODE, 2021–2028 (USD MILLION)
- TABLE 82 CHINA: HEALTHCARE EDUCATION MARKET, BY APPLICATION, 2021–2028 (USD MILLION)
- TABLE 83 INDIA: HEALTHCARE PROFESSIONALS (2023)
- TABLE 84 INDIA: HEALTHCARE EDUCATION MARKET, BY PROVIDER, 2021–2028 (USD MILLION)
- TABLE 85 INDIA: HEALTHCARE EDUCATION MARKET, BY END USER, 2021–2028 (USD MILLION)
- TABLE 86 INDIA: HEALTHCARE EDUCATION MARKET, BY DELIVERY MODE, 2021–2028 (USD MILLION)
- TABLE 87 INDIA: HEALTHCARE EDUCATION MARKET, BY APPLICATION, 2021–2028 (USD MILLION)
- TABLE 88 REST OF ASIA PACIFIC: HEALTHCARE EDUCATION MARKET, BY PROVIDER, 2021–2028 (USD MILLION)
- TABLE 89 REST OF ASIA PACIFIC: HEALTHCARE EDUCATION MARKET, BY END USER, 2021–2028 (USD MILLION)
- TABLE 90 REST OF ASIA PACIFIC: HEALTHCARE EDUCATION MARKET, BY DELIVERY MODE, 2021–2028 (USD MILLION)
- TABLE 91 REST OF ASIA PACIFIC: HEALTHCARE EDUCATION MARKET, BY APPLICATION, 2021–2028 (USD MILLION)
- TABLE 92 REST OF THE WORLD: HEALTHCARE EDUCATION MARKET, BY PROVIDER, 2021–2028 (USD MILLION)
- TABLE 93 REST OF THE WORLD: HEALTHCARE EDUCATION MARKET, BY END USER, 2021–2028 (USD MILLION)
- TABLE 94 REST OF THE WORLD: HEALTHCARE EDUCATION MARKET, BY DELIVERY MODE, 2021–2028 (USD MILLION)
- TABLE 95 REST OF THE WORLD: HEALTHCARE EDUCATION MARKET, BY APPLICATION, 2021–2028 (USD MILLION)
- TABLE 96 FOOTPRINT OF COMPANIES IN HEALTHCARE EDUCATION MARKET
- TABLE 97 KEY PRODUCT LAUNCHES AND APPROVALS, JANUARY 2020– JUNE 2023
- TABLE 98 KEY DEALS, JANUARY 2020– MAY 2023
- TABLE 99 STRYKER: COMPANY OVERVIEW
- TABLE 100 SAP: COMPANY OVERVIEW
- TABLE 101 ADOBE: COMPANY OVERVIEW
- TABLE 102 ORACLE: COMPANY OVERVIEW
- TABLE 103 HEALTHSTREAM: COMPANY OVERVIEW
- TABLE 104 GE HEALTHCARE: COMPANY OVERVIEW
- TABLE 105 SIEMENS HEALTHINEERS AG: COMPANY OVERVIEW
- TABLE 106 KONINKLIJKE PHILIPS N.V.: COMPANY OVERVIEW
- TABLE 107 IBM: COMPANY OVERVIEW
- TABLE 108 FUJIFILM CORPORATION: COMPANY OVERVIEW
- TABLE 109 SYMPLR: COMPANY OVERVIEW
- TABLE 110 INFOR: COMPANY OVERVIEW
- TABLE 111 ELSEVIER: COMPANY OVERVIEW
- TABLE 112 ARTICULATE GLOBAL, LLC: COMPANY OVERVIEW
- TABLE 113 PEOPLEFLUENT: COMPANY OVERVIEW
- TABLE 114 TRIVANTIS CORPORATION: COMPANY OVERVIEW
- TABLE 115 ACADEMY OF MEDICINE OF RICHMOND: COMPANY OVERVIEW
- TABLE 116 COURSERA: COMPANY OVERVIEW
- TABLE 117 CENTRAL MICHIGAN UNIVERSITY (CMU) COLLEGE OF MEDICINE: COMPANY OVERVIEW
- TABLE 118 VIRTAMED AG: COMPANY OVERVIEW
- FIGURE 1 HEALTHCARE EDUCATION MARKET SEGMENTATION
- FIGURE 2 RESEARCH DESIGN
- FIGURE 3 PRIMARY SOURCES
- FIGURE 4 BREAKDOWN OF PRIMARY INTERVIEWS: BY COMPANY TYPE, DESIGNATION, AND REGION
- FIGURE 5 RESEARCH METHODOLOGY: HYPOTHESIS BUILDING
- FIGURE 6 MARKET SIZE ESTIMATION: UNIVERSITIES AND ACADEMIC CENTERS ANALYSIS
- FIGURE 7 MARKET SIZE ESTIMATION: CME ANALYSIS
- FIGURE 8 CAGR PROJECTIONS FROM ANALYSIS OF DRIVERS, RESTRAINTS, OPPORTUNITIES, AND CHALLENGES
- FIGURE 9 CAGR PROJECTIONS: HEALTHCARE EDUCATION MARKET
- FIGURE 10 DATA TRIANGULATION METHODOLOGY
- FIGURE 11 HEALTHCARE EDUCATION MARKET, BY PROVIDER, 2023 VS. 2028 (USD MILLION)
- FIGURE 12 HEALTHCARE EDUCATION MARKET, BY DELIVERY MODE, 2023 VS. 2028 (USD MILLION)
- FIGURE 13 HEALTHCARE EDUCATION MARKET, BY APPLICATION, 2023 VS. 2028 (USD MILLION)
- FIGURE 14 HEALTHCARE EDUCATION MARKET, BY END USER, 2023 VS. 2028 (USD MILLION)
- FIGURE 15 GEOGRAPHICAL SNAPSHOT: HEALTHCARE EDUCATION MARKET
- FIGURE 16 TECHNOLOGICAL ADVANCEMENTS IN HEALTHCARE INDUSTRY AND GROWTH IN ONLINE EDUCATION TO DRIVE MARKET
- FIGURE 17 ASIA PACIFIC COMMANDED LARGEST SHARE OF HEALTHCARE EDUCATION MARKET IN 2022
- FIGURE 18 NORTH AMERICA TO REGISTER HIGHEST GROWTH RATE DURING FORECAST PERIOD
- FIGURE 19 EMERGING ECONOMIES TO REGISTER HIGHER GROWTH DURING STUDY PERIOD
- FIGURE 20 DRIVERS, RESTRAINTS, OPPORTUNITIES, AND CHALLENGES: HEALTHCARE EDUCATION MARKET
- FIGURE 21 ECOSYSTEM MARKET MAP: HEALTHCARE EDUCATION MARKET
- FIGURE 22 REVENUE GENERATED FROM USAGE OF MEDICAL SIMULATION
- FIGURE 23 NORTH AMERICA: HEALTHCARE EDUCATION MARKET SNAPSHOT
- FIGURE 24 ASIA PACIFIC: HEALTHCARE EDUCATION MARKET SNAPSHOT
- FIGURE 25 KEY DEVELOPMENTS OF MAJOR PLAYERS BETWEEN JANUARY 2020 AND JUNE 2023
- FIGURE 26 HEALTHCARE EDUCATION MARKET ANALYSIS, BY KEY PLAYER, 2022
- FIGURE 27 REVENUE ANALYSIS OF KEY PLAYERS IN HEALTHCARE EDUCATION MARKET
- FIGURE 28 R&D EXPENDITURE OF KEY PLAYERS IN HEALTHCARE EDUCATION MARKET (2021 VS. 2022)
- FIGURE 29 GLOBAL LMS MARKET: COMPANY EVALUATION MATRIX, 2022
- FIGURE 30 GLOBAL OEM MARKET: COMPANY EVALUATION MATRIX, 2022
- FIGURE 31 STRYKER: COMPANY SNAPSHOT (2022)
- FIGURE 32 SAP: COMPANY SNAPSHOT (2022)
- FIGURE 33 ADOBE: COMPANY SNAPSHOT (2022)
- FIGURE 34 ORACLE: COMPANY SNAPSHOT (2022)
- FIGURE 35 HEALTHSTREAM: COMPANY SNAPSHOT (2022)
- FIGURE 36 GE HEALTHCARE: COMPANY SNAPSHOT (2022)
- FIGURE 37 SIEMENS HEALTHINEERS AG: COMPANY SNAPSHOT (2022)
- FIGURE 38 KONINKLIJKE PHILIPS N.V.: COMPANY SNAPSHOT (2022)
- FIGURE 39 IBM: COMPANY SNAPSHOT (2022)
- FIGURE 40 FUJIFILM CORPORATION: COMPANY SNAPSHOT (2021)
This study involved four major activities in estimating the size of the healthcare education solution market. Exhaustive secondary research was done to collect information on the market, peer market, and parent market. The next step was to validate these findings, assumptions, and sizing with industry experts across value chains through primary research. The bottom-up approach was employed to estimate the overall market size. After that, market breakdown and data triangulation were used to estimate the market size of segments and sub-segments.
Secondary Research
The secondary research process involved the widespread use of secondary sources, directories, databases (such as Bloomberg Businessweek, Factiva, and D&B Hoovers), white papers, annual reports, company house documents, investor presentations, and SEC filings of companies. Some non-exclusive secondary sources include the Accreditation Council for Continuing Medical Education (ACCME), Royal College of Physicians and Surgeons of Canada (RCPSC), World Health Organization (WHO), European Accreditation Council for CME (EACCME), Agency for Healthcare Research and Quality (AHRQ), European Union of Medical Specialists (UEMS), Eurostat, The American College of Cardiology (ACC), The American Registry of Radiologic Technologists (ARRT), Expert Interviews, and MarketsandMarkets Analysis.
Secondary research was used to identify and collect information useful for the extensive, technical, market-oriented, and commercial study of the clinical decision support system market. It was also used to obtain important information about the key players and market classification and segmentation according to industry trends to the bottom-most level and key developments related to market and technology perspectives. A database of the key industry leaders was also prepared using secondary research.
Primary Research
In the primary research process, various sources from both the supply and demand sides were interviewed to obtain qualitative and quantitative information for this report. The primary sources from the supply side include industry experts such as CEOs, vice presidents, marketing and sales directors, technology & innovation directors, and related key executives from various key companies and organizations operating in the clinical decision support system market. The primary sources from the demand side included industry experts, consultants, healthcare providers, hospital administration, and government bodies. Primary research was conducted to validate the market segmentation, identify key players in the market, and gather insights on key industry trends and key market dynamics.
Breakdown of Primary Interviews
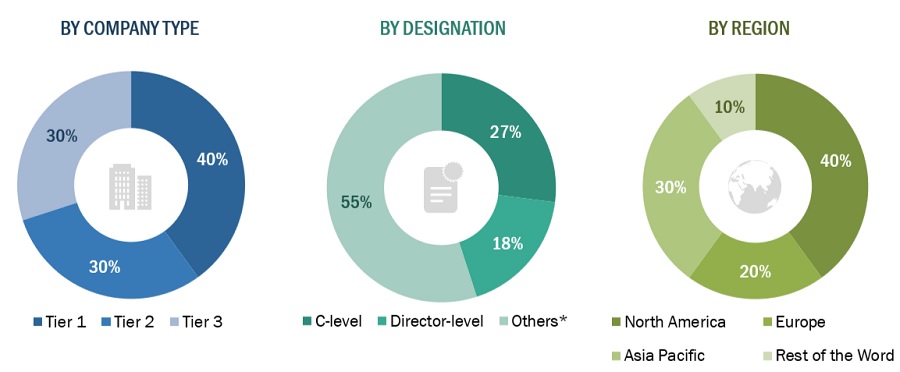
Tiers are defined based on a company’s total revenue. As of 2022: Tier 1= >USD 2 billion, Tier 2 = USD 50 million to USD 2 billion, and Tier 3= <USD 50 million.
To know about the assumptions considered for the study, download the pdf brochure
Market Size Estimation
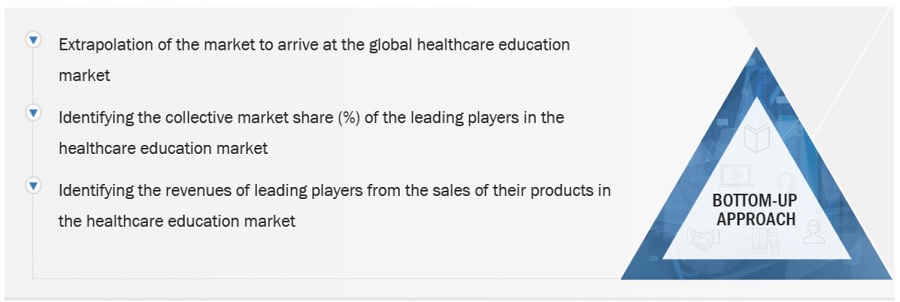
Both top-down and bottom-up approaches were used to estimate and validate the total size of the healthcare education solution market. These methods were also used extensively to estimate the size of various subsegments in the market. The research methodology used to estimate the market size includes the following:
- The key players in the industry and markets have been identified through extensive secondary research
- The industry’s supply chain and market size, in terms of value, have been determined through primary and secondary research processes.
- All percentage shares, splits, and breakdowns have been determined using secondary sources and verified through primary sources.
Global healthcare education market: Bottom-Up Approach
To know about the assumptions considered for the study, Request for Free Sample Report
Global healthcare education market: Top-Down Approach

Data Triangulation
After arriving at the overall market size—using the market size estimation processes as explained above—the market was split into several segments and sub-segments. To complete the overall market engineering process and arrive at the exact statistics of each market segment and subsegment, data triangulation and market breakdown procedures were employed, wherever applicable. The data was triangulated by studying various factors and trends from both the demand and supply sides in the provider, payer, and other industries.
Market Definition:
Healthcare education services are education and training programs or courses offered to healthcare professionals (both physicians and non-physicians) and medical students. They ensure that healthcare professionals are up to date with the recent developments in clinical specialties, related skills, and advanced technologies.
Key Stakeholders:
- Academic institutes and universities
- Educational platform providers
- CME providers
- Venture capitalists
- Government agencies
- Healthcare startups, consultants, and regulators
- Hospitals (public and private)
- Ambulatory surgery centers (ASCs)
- Rehabilitation centers
- Surgeons, physicians, and operating room staff
- Academic medical institutes
Report Objectives
- To define, describe, and forecast the healthcare education market on the basis of provider, delivery mode, application, end-user, and region
- To provide detailed information regarding the major factors influencing the market growth (such as drivers, restraints, opportunities, and challenges)
- To strategically analyze micromarkets1 with respect to individual growth trends, prospects, and contributions to the overall market
- To analyze the opportunities in the market for stakeholders and provide details of the competitive landscape for market leaders
- To forecast the size of the market segments with respect to four main regions—North America, Europe, Asia Pacific, and the Rest of the World (RoW)2
- To profile the key players and comprehensively analyze their market shares and core competencies3
- To track and analyze competitive developments such as acquisitions, product launches, expansions, agreements, collaborations, and approvals in the global healthcare education market
Available Customizations
With the given market data, MarketsandMarkets offers customizations as per the company’s specific needs. The following customization options are available for the report:
GEOGRAPHIC ANALYSIS
- Further breakdown of the Rest of the Asia Pacific market into South Korea, Australia, New Zealand, and others
- Further breakdown of the Rest of Europe market into Belgium, Russia, Switzerland, and others
- Further breakdown of the Rest of the World into Latin America, Middle East and Africa, and others


 Generating Response ...


Growth opportunities and latent adjacency in Healthcare Education Market
What are the potential challenges that the healthcare education market will face in the near future?
Does this report include a COVID-19 impact assessment on the healthcare education market?
Which region led the healthcare education market in 2021?