Over the Top Market

Over the Top Market by Type (Game Streaming, Audio Streaming, Video Streaming, and Communication), Monetization Model (Subscription-based, Advertising-based, and Transaction-based), Streaming Device, Vertical and Region - Global Forecast to 2027

Report Code: TC 2445 Jan, 2023, by marketsandmarkets.com

Over the Top Market Overview & Report Summary, Global Size

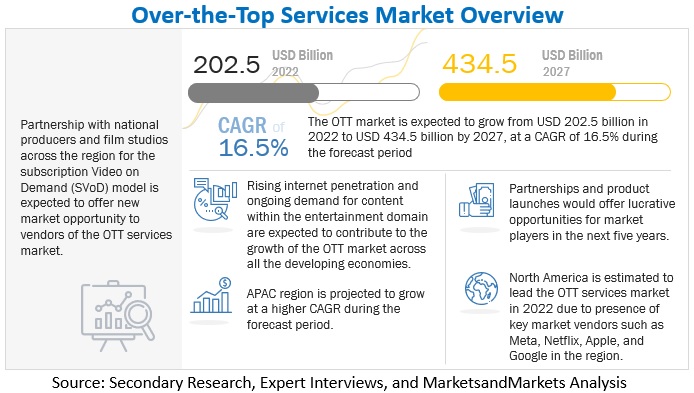
The global Over The Top Market size was worth approximately $202.5 billion in 2022 and is expected to generate revenue around $434.5 billion by the end of 2027, projecting a CAGR of 16.5% during 2022-2027.

Rise in demand of OTT during lockdown, global and local players offering freemium models in price-sensitive markets, internet proliferation with penetration of smart devices, and flexibility and ease-of-use to offer seamless customer experience are major factors for the over the top market growth.
Over-the-Top (OTT) Market

To know about the assumptions considered for the study, Request for Free Sample Report

Over the Top Market Growth Dynamics

Driver: Flexibility and ease-of-use to offer seamless customer experience

Viewership dynamics have changed the way consumers watch videos and consume television content. There is a drift from traditional TV viewership to online content consumption, which acts as a major driver in the growth of Over the top players. Home entertainment has made its way via streaming services, enabling customers to consume the offered content depending on their preferred choice of genre, comfort, freedom, and flexibility. Viewers are further provided with a plethora of choices, with titles from diverse genres within the vast library to choose from at any given time. Owing to this ease of use and flexibility, viewers can have a seamless experience

Restraint: Disparity in opinion between producers and aggregators over licensed business model

Streaming licensed content can act as a major revenue contributor and as a major restraint for players in the Over the top Market. This is due to the presence of the same licensed content across competitive platforms. In terms of global players, the license fee paid to the foreign licensor would be considered royalty and the OTT service providers would have to comply with regional tax regulations while making payments to content producers or aggregators. The definition of royalty between artists and OTT players over content withholds the production of original content.

Opportunity: Partnership with national producers and film studios across regions on SVoD models

OTT players focus on generating content that is original and local, which is based on the concerned region to drive their Over the top Market growth. These players partner with national producers and directors for such content production. The main aim of such partnerships is to explore untapped markets to reach the unreached audience that is unable to consume content owing to language barriers. National producers and film studios are aware of the grip of viewers’ and their consuming patterns, creating an opportunity for the major Subscription VoD (SVoD) players to penetrate the market and increase the number of viewers and subscribers.

Challenge: Difficulty in retaining subscribers due to high competition

With many OTT services available to users, it is a challenge to attract new subscribers and, further, to retain them. Introductory offers are usually free for the customers or are at a reduced rate. Subscribers can opt for a free trial and then opt out when it ends; meanwhile, the lack of new content drives away subscribers, and the complex user interface can push customers to unsubscribe from the service. To prevent this, many service providers focus on creating high-quality content and a smooth user experience. Also, in the initial phase of using the OTT service, the content is original and new. However, after the content fails to justify the full price of the subscription, the viewers are able to unsubscribe from the service. There is also an emergence of free, ad-supported alternatives, creating immense competition for premium service providers.

Gaming service vertical to hold the largest market size during the forecast period

Online gaming companies need to reach out to a large number of global customers, avoiding the presence of limitations across the entire gaming experience. These companies aim at delivering a fast and secured online gaming experience, offering a rich media experience, and tracking the record of users that use various gaming applications. The consistent engagement of end users in the gaming sector enables companies to make notable developments across the segment in terms of High Quality (HQ) delivery over handheld devices, such as smartphones and tablets

Smartphones and tablets in gaming service vertical segment to record the fastest growth rate during the forecast period

Game streaming end users are mainly young viewers who aim for ease of accessibility of the content. Smartphones and tablets provide anytime and anywhere access to game streaming and therefore, these devices are expected to record the fastest growth rate during the forecast period. The streamers can record videos and live streams in impressive HD quality without the need of large equipment or a specific setup, saving money and time. Smartphones and tablets have dedicated apps for game streaming depending upon the operating system i.e. Android or iOS. Also, the upcoming 5G technology which can be accessed over these devices will help to increase the adoption rate of OTT services in the gaming service vertical.
Over-the-Top Services Market (OTT) Market Size, and Share

To know about the assumptions considered for the study, download the pdf brochure

North America to hold the largest market size during the forecast period

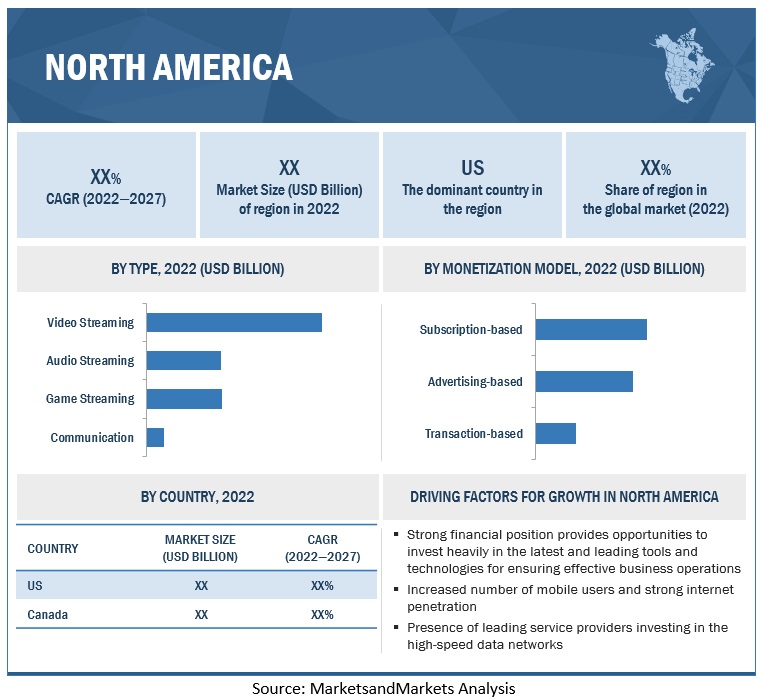
North America consists of developed countries with well-established infrastructure, which generate a huge demand for OTT solutions in the region. Countries that contribute the most to the Over the top Market in North America are the US and Canada; the reason for the dominance of these countries is their well-established economies, which enable investments in new technologies. North America, the most developed region, is home to large verticals capable of investing in reliable and advanced IT infrastructure for growing data traffic, thereby opening new opportunities for adopting OTT solutions.

Key Market Players:

Key market players profiled in the Over the top Market report are Meta (US), Netflix (US), Amazon (US), Google (US), Apple (US), Home Box Office (US), Roku (US), Rakuten(Japan), IndieFlix (US), Tencent (China), and Kakao (South Korea).

Get online access to the report on the World's First Market Intelligence Cloud

  • Easy to Download Historical Data & Forecast Numbers
  • Company Analysis Dashboard for high growth potential opportunities
  • Research Analyst Access for customization & queries
  • Competitor Analysis with Interactive dashboard
  • Latest News, Updates & Trend analysis
Request Sample

Scope of the Report

Report Metrics

Details

Market Size in 2022 $202.5 billion
Revenue Forecast Size for 2027 $434.5 billion
Estimated Growth Rate CAGR of 16.5%
Largest Market North America
Key Driving Factors Flexibility and ease-of-use to offer seamless customer experience
Key Growth Opportunities Partnership with national producers and film studios across regions on SVoD model
Market size available for years 2022–2027
Base year considered 2021
Forecast period 2022-2027
Forecast Market Size Value
Market Segmentation Type, Streaming Devices, Monetization Model, Services, Region
Region covered Asia Pacific, Europe, North America and RoW
Companies Covered Panasonic (Japan), NXP Semiconductors (Netherlands), Renesas Electronics (Japan), Blackberry (Canada), and Visteon Corporation (US) are top players in the market
A total of 23 companies are profiled in the report

This research report categorizes the Over the Top (OTT) Market to forecast revenues and analyze trends in each of the following submarkets:

Based on type component: Type
  • Game Streaming
  • Audio Streaming
  • Video Streaming
  • Communication
Based on streaming devices: Streaming Devices
  • Smartphones and Tablets
  • Desktops and Laptops
  • IPTV and Consoles
Based on monetization model: Monetization Model
  • Subscription-based
  • Advertising-based
  • Transaction-based
Based on service verticals:
  • Media and Entertainment
  • Education and Learning
  • Gaming
  • Service Utilities
Based on region:
  • North America
    • US
    • Canada
  • Europe
    • UK
    • Germany
    • France
    • Italy
    • Spain
    • Nordic Region
    • Rest of Europe
  • APAC
    • China
    • India
    • Japan
    • Australia and New Zealand
    • Rest of APAC
  • Latin America
    • Brazil
    • Mexico
    • Rest of Latin America
  • MEA
    • Kingdom of Saudi Arabia
    • United Arab Emirates
    • South Africa
    • Middle East & Africa

Recent Developments:

  • In October 2021, Netflix made its biggest acquisition by buying Roald Dahl Story Co. The acquisition would build on the partnership to create a slate of animated TV series. The projects under these would promote more ambitious ventures of creating a unique universe across animated and live-action films and TV, publishing, games, immersive experiences, live theatre, consumer products, and more.
  • In June 2022, Amazon partnered with American entertainment company AMC Networks to offer its content on Amazon Prime Video channels in India. As part of the partnership, Amazon Prime Video would offer ad-free subscription service AMC+ and AMC’s streaming service Acorn TV on Prime Video channels in India on a subscription basis.
  • In April 2020, Synamedia, one of the world’s largest independent video software providers, partnered with Google Cloud to expand its video network portfolio with new over-the-top (OTT) offerings ‘as a service.’ With this partnership, Synamedia would be able to further address customer needs for high availability, increased scalability and maximized performance for OTT services while simultaneously reducing operational costs and complexity, particularly with live sports events. The tech innovators came together to maximize OTT service uptime and achieve broadcast quality latency.
  • In May 2022, Mattel, Inc. announced a partnership with HBO Max on a pair of new live-action American Girl specials based on the hit doll and book line. The first special, American Girl: Corinne Tan (wt), focused on the brand’s 2022 Girl of the Year of the same name. Produced by MarVista Entertainment, a Fox Entertainment Company, American Girl: Corinne Tan would premiere in December on Cartoon Network and the following day on HBO Max. A second American Girl special would follow in 2023.
  • In April 2021, The Walt Disney Company (DIS) and Sony Pictures Entertainment (SPE) announced a multi-year content licensing agreement for US streaming and TV rights to Sony Pictures’ new theatrical releases across Disney Media & Entertainment Distribution’s vast portfolio of platforms, including its streaming services Disney+ and Hulu, as well as linear entertainment networks including ABC, Disney Channels, Freeform, FX, and National Geographic. The deal covers theatrical releases from 2022 to 2026 and begins for each film following its Pay 1 TV window.
  • In November 2022, AMC Networks and Roku announced an expanded partnership to feature AMC Networks’ high-quality content and targeted streaming services across The Roku Channel’s broad and growing ecosystem. The agreement included the addition of 11 free ad-supported streaming (FAST) channels created and programmed by AMC Networks to The Roku Channel, including an exclusive channel, AMC Showcase, which would feature many of AMC’s signature dramas, including Mad Men.
  • In December 2021, Tencent partnered with Shiseido to build a D2C (Direct to Consumer) model and strengthen its social commerce business to provide new services to Chinese consumers globally. Applying the know-how learned from this partnership to the entire Shiseido group, the company would strengthen its global growth by accelerating its group-wide digital transformation and enhancing capability development in terms of digitalization.
  • In September 2021, Amagi, a global leader in cloud-based SaaS technology for broadcast and connected TV, strengthens its partnership with Rakuten TV, one of the leading video-on-demand (VoD) platforms in Europe, for channel distribution and monetization. Rakuten TV was the first Video on Demand platform in Europe that combined transactional video-on-demand (TVoD), advertising video-on-demand (AVoD), Free Ad-Supported Streaming TV (FAST), and subscription video-on-demand (SVoD) services. For Rakuten TV, Amagi delivers a lineup of nearly 50 third-party linear channels, working alongside Rakuten TV’s primary monetization partner Rakuten Advertising. These included BITE, Bon Appétit, Brat TV, IMG EDGEsport, Insight TV, PopSugar Fitness, Qwest TV, Talk Radio TV, and XITE.

Frequently Asked Questions (FAQ):

To speak to our analyst for a discussion on the above findings, click Speak to Analyst

TABLE OF CONTENTS
 
1 INTRODUCTION (Page No. - 29)
    1.1 STUDY OBJECTIVES 
    1.2 MARKET DEFINITION 
           1.2.1 INCLUSIONS & EXCLUSIONS
    1.3 MARKET SCOPE 
           1.3.1 MARKET SEGMENTATION
           1.3.2 REGIONS COVERED
           1.3.3 YEARS CONSIDERED
    1.4 CURRENCY CONSIDERED 
           TABLE 1 USD EXCHANGE RATES, 2019–2021
    1.5 STAKEHOLDERS 
    1.6 SUMMARY OF CHANGES 
 
2 RESEARCH METHODOLOGY (Page No. - 34)
    2.1 RESEARCH DATA 
           FIGURE 1 MARKET RESEARCH DESIGN
           FIGURE 2 RESEARCH METHODOLOGY
           2.1.1 BREAKUP OF PRIMARIES
           2.1.2 KEY INDUSTRY INSIGHTS
    2.2 DATA TRIANGULATION 
    2.3 MARKET SIZE ESTIMATION 
           FIGURE 3 TOP-DOWN AND BOTTOM-UP APPROACHES
           2.3.1 TOP-DOWN APPROACH
           2.3.2 BOTTOM-UP APPROACH
    2.4 OVER-THE-TOP SERVICES MARKET: RECESSION IMPACT 
           FIGURE 4 OVER-THE-TOP SERVICES MARKET TO WITNESS DECLINE IN Y-O-Y GROWTH
    2.5 ASSUMPTIONS 
    2.6 LIMITATIONS 
 
3 EXECUTIVE SUMMARY (Page No. - 41)
    FIGURE 5 OVER THE TOP MARKET SHARE, BY TYPE, 2022 AND 2027 
    FIGURE 6 OVER-THE-TOP SERVICES MARKET SHARE, BY MONETIZATION MODEL, 2022 AND 2027 
    FIGURE 7 ASIA PACIFIC TO WITNESS HIGHEST CAGR DURING 2022–2027 
 
4 PREMIUM INSIGHTS (Page No. - 44)
    4.1 ATTRACTIVE OPPORTUNITIES FOR OVER THE TOP MARKET PLAYERS 
           FIGURE 8 RISE IN NUMBER OF PARTNERSHIPS BETWEEN OTT VENDORS AND CONTENT PRODUCERS TO SUPPORT OVER-THE-TOP SERVICES MARKET GROWTH
    4.2 OVER-THE-TOP SERVICES MARKET, BY STREAMING DEVICE 
           FIGURE 9 SMARTPHONES & TABLETS TO ACCOUNT FOR HIGHEST MARKET SHARE IN 2022
    4.3 NORTH AMERICA: OVER THE TOP MARKET, BY STREAMING DEVICE AND MONETIZATION MODEL 
           FIGURE 10 SMARTPHONES & TABLETS AND SUBSCRIPTION-BASED MONETIZATION TO ACCOUNT FOR LARGEST RESPECTIVE MARKET SHARES IN NORTH AMERICA
    4.4 ASIA PACIFIC: OVER-THE-TOP SERVICES MARKET, BY STREAMING DEVICE AND MONETIZATION MODEL 
           FIGURE 11 SMARTPHONES & TABLETS AND ADVERTISEMENT-BASED MONETIZATION TO BE LARGEST RESPECTIVE SEGMENTS IN ASIA PACIFIC
 
5 MARKET OVERVIEW AND INDUSTRY TRENDS (Page No. - 46)
    5.1 INTRODUCTION 
    5.2 MARKET DYNAMICS 
           FIGURE 12 OVER THE TOP MARKET: DRIVERS, RESTRAINTS, OPPORTUNITIES, AND CHALLENGES
           5.2.1 DRIVERS
                    5.2.1.1 Flexibility and ease-of-use to offer seamless customer experience
                    5.2.1.2 Internet proliferation with penetration of smart devices
                               FIGURE 13 NUMBER OF INTERNET USERS, BY REGION, 2022 (MILLION)
                               FIGURE 14 TOP SMARTPHONE USER COUNTRIES, 2021 (MILLION)
                    5.2.1.3 Freemium models of global and local players in price-sensitive markets
                    5.2.1.4 Rise in demand for Over-the-Top services during lockdown
           5.2.2 RESTRAINTS
                    5.2.2.1 Disparity in opinion between producers and aggregators over licensed business model
                    5.2.2.2 Threat to privacy of content consumption and security of user database due to spyware
                    5.2.2.3 Inadequate supply of high-speed internet in emerging economies
           5.2.3 OPPORTUNITIES
                    5.2.3.1 Partnership with national producers and film studios across regions on SVoD models
                    5.2.3.2 Adoption of 5G technology
           5.2.4 CHALLENGES
                    5.2.4.1 Complex IP, government regulatory frameworks, and licensing regimes across regions
                    5.2.4.2 Difficulty in retaining subscribers due to high competition
    5.3 INDUSTRY TRENDS 
           5.3.1 ECOSYSTEM MAPPING
                    TABLE 2 OVER-THE-TOP SERVICES MARKET ECOSYSTEM
           5.3.2 SUPPLY CHAIN ANALYSIS
                    FIGURE 15 OVER-THE-TOP SERVICES MARKET: SUPPLY CHAIN ANALYSIS
 
6 OVER-THE-TOP MARKET, BY MONETIZATION MODEL (Page No. - 54)
    6.1 INTRODUCTION 
           FIGURE 16 SUBSCRIPTION-BASED MONETIZATION MODEL TO WITNESS HIGHEST CAGR DURING FORECAST PERIOD
           6.1.1 MONETIZATION MODEL: MARKET DRIVERS
                    TABLE 3 OVER-THE-TOP SERVICES MARKET, BY MONETIZATION MODEL, 2017–2021 (USD BILLION)
                    TABLE 4 OVER-THE-TOP SERVICES MARKET, BY MONETIZATION MODEL, 2022–2027 (USD BILLION)
    6.2 SUBSCRIPTION-BASED 
           6.2.1 BILLING AS PER SERVICES OPTED BY CUSTOMERS TO DRIVE DEMAND FOR OVER-THE-TOP SERVICES
                    TABLE 5 SUBSCRIPTION-BASED OVER-THE-TOP SERVICES MARKET, BY REGION, 2017–2021 (USD BILLION)
                    TABLE 6 SUBSCRIPTION-BASED OVER THE TOP MARKET, BY REGION, 2022–2027 (USD BILLION)
    6.3 ADVERTISING-BASED 
           6.3.1 HIGHER PENETRATION OF INTERNET AND USE OF MOBILE DEVICES TO INCREASE ADOPTION OF OVER-THE-TOP SERVICES
                    TABLE 7 ADVERTISING-BASED OVER-THE-TOP SERVICES MARKET, BY REGION, 2017–2021 (USD BILLION)
                    TABLE 8 ADVERTISING-BASED OTT MARKET, BY REGION, 2022–2027 (USD BILLION)
    6.4 TRANSACTION-BASED 
           6.4.1 ATTRACTIVE VIDEO PACKAGES THROUGH TRANSACTION-BASED MONETIZATION MODEL TO PROPEL ADOPTION OF OVER-THE-TOP SERVICES
                    TABLE 9 TRANSACTION-BASED OVER-THE-TOP SERVICES MARKET, BY REGION, 2017–2021 (USD BILLION)
                    TABLE 10 TRANSACTION-BASED OVER THE TOP MARKET, BY REGION, 2022–2027 (USD BILLION)
 
7 OVER-THE-TOP SERVICES MARKET, BY TYPE (Page No. - 60)
    7.1 INTRODUCTION 
           FIGURE 17 VIDEO STREAMING SEGMENT TO RECORD HIGHEST CAGR DURING FORECAST PERIOD
           7.1.1 TYPE: MARKET DRIVERS
                    TABLE 11 OVER-THE-TOP SERVICES MARKET, BY TYPE, 2017–2021 (USD BILLION)
                    TABLE 12 OVER THE TOP MARKET, BY TYPE, 2022–2027 (USD BILLION)
    7.2 GAME STREAMING 
           7.2.1 LIVE RESULTS AND REAL-TIME SHARING TO DRIVE GROWTH OF GAME STREAMING SEGMENT
                    TABLE 13 GAME STREAMING MARKET, BY MONETIZATION MODEL, 2017–2021 (USD BILLION)
                    TABLE 14 GAME STREAMING MARKET, BY MONETIZATION MODEL, 2022–2027 (USD BILLION)
                    TABLE 15 GAME STREAMING MARKET, BY REGION, 2017–2021 (USD BILLION)
                    TABLE 16 GAME STREAMING MARKET, BY REGION, 2022–2027 (USD BILLION)
    7.3 AUDIO STREAMING 
           7.3.1 SUBSCRIPTION- AND TRANSACTION-BASED MONETIZATION MODELS TO BE HIGHLY PREFERRED BY END USERS FOR AUDIO STREAMING
                    TABLE 17 AUDIO STREAMING MARKET, BY MONETIZATION MODEL, 2017–2021 (USD BILLION)
                    TABLE 18 AUDIO STREAMING MARKET, BY MONETIZATION MODEL, 2022–2027 (USD BILLION)
                    TABLE 19 AUDIO STREAMING MARKET, BY REGION, 2017–2021 (USD BILLION)
                    TABLE 20 AUDIO STREAMING MARKET, BY REGION, 2022–2027 (USD BILLION)
    7.4 VIDEO STREAMING 
           7.4.1 FLEXIBILITY, COMFORT, AND PERSONALIZATION OF CONTENT TO DRIVE ADOPTION OF VIDEO STREAMING SERVICES
                    TABLE 21 VIDEO STREAMING MARKET, BY MONETIZATION MODEL, 2017–2021 (USD BILLION)
                    TABLE 22 VIDEO STREAMING MARKET, BY MONETIZATION MODEL, 2022–2027 (USD BILLION)
                    TABLE 23 VIDEO STREAMING MARKET, BY REGION, 2017–2021 (USD BILLION)
                    TABLE 24 VIDEO STREAMING MARKET, BY REGION, 2022–2027 (USD BILLION)
    7.5 COMMUNICATION 
           7.5.1 HIGH MOBILE PENETRATION WITH OVER-THE-TOP MESSAGING APPLICATIONS TO PROMOTE GLOBAL GROWTH OF COMMUNICATION SEGMENT
                    TABLE 25 COMMUNICATION SERVICES MARKET, BY MONETIZATION MODEL, 2017–2021 (USD BILLION)
                    TABLE 26 COMMUNICATION SERVICES MARKET, BY MONETIZATION MODEL, 2022–2027 (USD BILLION)
                    TABLE 27 COMMUNICATION SERVICES MARKET, BY REGION, 2017–2021 (USD BILLION)
                    TABLE 28 COMMUNICATION SERVICES MARKET, BY REGION, 2022–2027 (USD BILLION)
 
8 OVER-THE-TOP MARKET, BY STREAMING DEVICE (Page No. - 69)
    8.1 INTRODUCTION 
           FIGURE 18 SMARTPHONES & TABLETS TO RECORD LARGEST MARKET SIZE DURING FORECAST PERIOD
           8.1.1 STREAMING DEVICE: MARKET DRIVERS
                    TABLE 29 OVER-THE-TOP SERVICES MARKET, BY STREAMING DEVICE, 2017–2021 (USD BILLION)
                    TABLE 30 OVER-THE-TOP SERVICES MARKET, BY STREAMING DEVICE, 2022–2027 (USD BILLION)
    8.2 SMARTPHONES & TABLETS 
           8.2.1 INTERNET PENETRATION TO LEAD TO INCREASED NUMBER OF SMARTPHONES
                    TABLE 31 SMARTPHONES & TABLETS MARKET, BY REGION, 2017–2021 (USD BILLION)
                    TABLE 32 SMARTPHONES & TABLETS MARKET, BY REGION, 2022–2027 (USD BILLION)
    8.3 DESKTOPS & LAPTOPS 
           8.3.1 HD CONTENT ON BIGGER SCREENS AND MULTITASKING TO SUPPORT MARKET GROWTH OF CONTENT VIEWING ON DESKTOPS & LAPTOPS
                    TABLE 33 DESKTOPS & LAPTOPS MARKET, BY REGION, 2017–2021 (USD BILLION)
                    TABLE 34 DESKTOPS & LAPTOPS MARKET, BY REGION, 2022–2027 (USD BILLION)
    8.4 INTERNET PROTOCOL TELEVISIONS & CONSOLES 
           8.4.1 GROWTH OF GAMING INDUSTRY TO BOOST ADOPTION OF IPTVS & CONSOLES FOR STREAMING OVER-THE-TOP SERVICES
                    TABLE 35 IPTV & CONSOLES MARKET, BY REGION, 2017–2021 (USD BILLION)
                    TABLE 36 IPTV & CONSOLES MARKET, BY REGION, 2022–2027 (USD BILLION)
 
9 OVER THE TOP MARKET, BY SERVICE VERTICAL (Page No. - 74)
    9.1 INTRODUCTION 
           FIGURE 19 GAMING SEGMENT TO RECORD HIGHEST GROWTH RATE DURING FORECAST PERIOD
           9.1.1 SERVICE VERTICAL: MARKET DRIVERS
                    TABLE 37 OVER-THE-TOP SERVICES MARKET, BY SERVICE VERTICAL, 2017–2021 (USD BILLION)
                    TABLE 38 OVER THE TOP MARKET, BY SERVICE VERTICAL, 2022–2027 (USD BILLION)
    9.2 MEDIA & ENTERTAINMENT 
           9.2.1 INCREASED INTERNET PENETRATION AND DEMAND FOR ENTERTAINMENT TO FUEL GROWTH IN VERTICAL
                    TABLE 39 MEDIA & ENTERTAINMENT VERTICAL MARKET, BY REGION, 2017–2021 (USD BILLION)
                    TABLE 40 MEDIA & ENTERTAINMENT VERTICAL MARKET, BY REGION, 2022–2027 (USD BILLION)
                    TABLE 41 MEDIA & ENTERTAINMENT VERTICAL MARKET, BY STREAMING DEVICE, 2017–2021 (USD BILLION)
                    TABLE 42 MEDIA & ENTERTAINMENT VERTICAL MARKET, BY STREAMING DEVICE, 2022–2027 (USD BILLION)
    9.3 EDUCATION & LEARNING 
           9.3.1 EMERGENCE OF SMART EDUCATION SYSTEM AND DIVERSE ONLINE LEARNING NEEDS TO DRIVE GROWTH IN EDUCATION & LEARNING SECTOR
                    TABLE 43 EDUCATION & LEARNING VERTICAL MARKET, BY REGION, 2017–2021 (USD BILLION)
                    TABLE 44 EDUCATION & LEARNING VERTICAL MARKET, BY REGION, 2022–2027 (USD BILLION)
                    TABLE 45 EDUCATION & LEARNING VERTICAL MARKET, BY STREAMING DEVICE, 2017–2021 (USD BILLION)
                    TABLE 46 EDUCATION & LEARNING VERTICAL MARKET, BY STREAMING DEVICE, 2022–2027 (USD BILLION)
    9.4 GAMING 
           9.4.1 HIGHER TRACTION AMONG MILLENNIALS TO BOOST GAMING VERTICAL
                    TABLE 47 GAMING VERTICAL MARKET, BY REGION, 2017–2021 (USD BILLION)
                    TABLE 48 GAMING VERTICAL MARKET, BY REGION, 2022–2027 (USD BILLION)
                    TABLE 49 GAMING VERTICAL MARKET, BY STREAMING DEVICE, 2017–2021 (USD BILLION)
                    TABLE 50 GAMING VERTICAL MARKET, BY STREAMING DEVICE, 2022–2027 (USD BILLION)
    9.5 SERVICE UTILITIES 
           9.5.1 RISE IN DEMAND FOR ON-THE-GO SERVICES ON HANDHELD DEVICES TO BOOST SERVICE UTILITY ADOPTION
                    TABLE 51 SERVICE UTILITIES VERTICAL MARKET, BY REGION, 2017–2021 (USD BILLION)
                    TABLE 52 SERVICE UTILITIES VERTICAL MARKET, BY REGION, 2022–2027 (USD BILLION)
                    TABLE 53 SERVICE UTILITIES VERTICAL MARKET, BY STREAMING DEVICE, 2017–2021 (USD BILLION)
                    TABLE 54 SERVICE UTILITIES VERTICAL MARKET, BY STREAMING DEVICE, 2022–2027 (USD BILLION)
 
10 OVER-THE-TOP SERVICES MARKET, BY REGION (Page No. - 83)
     10.1 INTRODUCTION 
               FIGURE 20 OVER THE TOP MARKET REGIONAL SNAPSHOT, 2022
               FIGURE 21 ASIA PACIFIC TO EXHIBIT HIGHEST CAGR DURING FORECAST PERIOD
               TABLE 55 OVER-THE-TOP SERVICES MARKET, BY REGION, 2017–2021 (USD BILLION)
               TABLE 56 OVER-THE-TOP SERVICES MARKET, BY REGION, 2022–2027 (USD BILLION)
     10.2 NORTH AMERICA 
             10.2.1 NORTH AMERICA: RECESSION IMPACT
             10.2.2 NORTH AMERICA: MARKET DRIVERS
                       FIGURE 22 NORTH AMERICA: MARKET SNAPSHOT
                       TABLE 57 NORTH AMERICA: OVER-THE-TOP SERVICES MARKET, BY TYPE, 2017–2021 (USD BILLION)
                       TABLE 58 NORTH AMERICA: OVER THE TOP MARKET, BY TYPE, 2022–2027 (USD BILLION)
                       TABLE 59 NORTH AMERICA: OTT SERVICES MARKET, BY MONETIZATION MODEL, 2017–2021 (USD BILLION)
                       TABLE 60 NORTH AMERICA: OVER-THE-TOP SERVICES MARKET, BY MONETIZATION MODEL, 2022–2027 (USD BILLION)
                       TABLE 61 NORTH AMERICA: GAME STREAMING MARKET, BY MONETIZATION MODEL, 2017–2021 (USD BILLION)
                       TABLE 62 NORTH AMERICA: GAME STREAMING MARKET, BY MONETIZATION MODEL, 2022–2027 (USD BILLION)
                       TABLE 63 NORTH AMERICA: AUDIO STREAMING MARKET, BY MONETIZATION MODEL, 2017–2021 (USD BILLION)
                       TABLE 64 NORTH AMERICA: AUDIO STREAMING MARKET, BY MONETIZATION MODEL, 2022–2027 (USD BILLION)
                       TABLE 65 NORTH AMERICA: VIDEO STREAMING MARKET, BY MONETIZATION MODEL, 2017–2021 (USD BILLION)
                       TABLE 66 NORTH AMERICA: VIDEO STREAMING MARKET, BY MONETIZATION MODEL, 2022–2027 (USD BILLION)
                       TABLE 67 NORTH AMERICA: COMMUNICATION SERVICES MARKET, BY MONETIZATION MODEL, 2017–2021 (USD BILLION)
                       TABLE 68 NORTH AMERICA: COMMUNICATION SERVICES MARKET, BY MONETIZATION MODEL, 2022–2027 (USD BILLION)
                       TABLE 69 NORTH AMERICA: OVER-THE-TOP SERVICES MARKET, BY SERVICE VERTICAL, 2017–2021 (USD BILLION)
                       TABLE 70 NORTH AMERICA: OOVER THE TOP MARKET BY SERVICE VERTICAL, 2022–2027 (USD BILLION)
                       TABLE 71 NORTH AMERICA: OVER-THE-TOP SERVICES MARKET, BY STREAMING DEVICE, 2017–2021 (USD BILLION)
                       TABLE 72 NORTH AMERICA: OVER-THE-TOP SERVICES MARKET, BY STREAMING DEVICE, 2022–2027 (USD BILLION)
                       TABLE 73 NORTH AMERICA: MEDIA & ENTERTAINMENT VERTICAL MARKET, BY STREAMING DEVICE, 2017–2021 (USD BILLION)
                       TABLE 74 NORTH AMERICA: MEDIA & ENTERTAINMENT VERTICAL MARKET, BY STREAMING DEVICE, 2022–2027 (USD BILLION)
                       TABLE 75 NORTH AMERICA: EDUCATION & LEARNING VERTICAL MARKET, BY STREAMING DEVICE, 2017–2021 (USD BILLION)
                       TABLE 76 NORTH AMERICA: EDUCATION & LEARNING VERTICAL MARKET, BY STREAMING DEVICE, 2022–2027 (USD BILLION)
                       TABLE 77 NORTH AMERICA: GAMING VERTICAL MARKET, BY STREAMING DEVICE, 2017–2021 (USD BILLION)
                       TABLE 78 NORTH AMERICA: GAMING VERTICAL MARKET, BY STREAMING DEVICE, 2022–2027 (USD BILLION)
                       TABLE 79 NORTH AMERICA: SERVICE UTILITIES VERTICAL MARKET, BY STREAMING DEVICE, 2017–2021 (USD BILLION)
                       TABLE 80 NORTH AMERICA: SERVICE UTILITIES VERTICAL MARKET, BY STREAMING DEVICE, 2022–2027 (USD BILLION)
                       TABLE 81 NORTH AMERICA: OVER-THE-TOP SERVICES MARKET, BY COUNTRY, 2017–2021 (USD BILLION)
                       TABLE 82 NORTH AMERICA: OVER-THE-TOP SERVICES MARKET, BY COUNTRY, 2022–2027 (USD BILLION)
             10.2.3 UNITED STATES
             10.2.4 CANADA
     10.3 EUROPE 
             10.3.1 EUROPE: RECESSION IMPACT
             10.3.2 EUROPE: MARKET DRIVERS
                       TABLE 83 EUROPE: OVER THE TOP MARKET, BY TYPE, 2017–2021 (USD BILLION)
                       TABLE 84 EUROPE: OVER-THE-TOP SERVICES MARKET, BY TYPE, 2022–2027 (USD BILLION)
                       TABLE 85 EUROPE: OVER-THE-TOP SERVICES MARKET, BY MONETIZATION MODEL, 2017–2021 (USD BILLION)
                       TABLE 86 EUROPE: OVER-THE-TOP SERVICES MARKET, BY MONETIZATION MODEL, 2022–2027 (USD BILLION)
                       TABLE 87 EUROPE: GAME STREAMING MARKET, BY MONETIZATION MODEL, 2017–2021 (USD BILLION)
                       TABLE 88 EUROPE: GAME STREAMING MARKET, BY MONETIZATION MODEL, 2022–2027 (USD BILLION)
                       TABLE 89 EUROPE: AUDIO STREAMING MARKET, BY MONETIZATION MODEL, 2017–2021 (USD BILLION)
                       TABLE 90 EUROPE: AUDIO STREAMING MARKET, BY MONETIZATION MODEL, 2022–2027 (USD BILLION)
                       TABLE 91 EUROPE: VIDEO STREAMING MARKET, BY MONETIZATION MODEL, 2017–2021 (USD BILLION)
                       TABLE 92 EUROPE: VIDEO STREAMING MARKET, BY MONETIZATION MODEL, 2022–2027 (USD BILLION)
                       TABLE 93 EUROPE: COMMUNICATION SERVICES MARKET, BY MONETIZATION MODEL, 2017–2021 (USD BILLION)
                       TABLE 94 EUROPE: COMMUNICATION SERVICES MARKET, BY MONETIZATION MODEL, 2022–2027 (USD BILLION)
                       TABLE 95 EUROPE: OVER-THE-TOP SERVICES MARKET, BY SERVICE VERTICAL, 2017–2021 (USD BILLION)
                       TABLE 96 EUROPE: OVER THE TOP MARKET, BY SERVICE VERTICAL, 2022–2027 (USD BILLION)
                       TABLE 97 EUROPE: OVER-THE-TOP SERVICES MARKET, BY STREAMING DEVICE, 2017–2021 (USD BILLION)
                       TABLE 98 EUROPE: OVER-THE-TOP SERVICES MARKET, BY STREAMING DEVICE, 2022–2027 (USD BILLION)
                       TABLE 99 EUROPE: MEDIA & ENTERTAINMENT VERTICAL MARKET, BY STREAMING DEVICE, 2017–2021 (USD BILLION)
                       TABLE 100 EUROPE: MEDIA & ENTERTAINMENT VERTICAL MARKET, BY STREAMING DEVICE, 2022–2027 (USD BILLION)
                       TABLE 101 EUROPE: EDUCATION & LEARNING VERTICAL MARKET, BY STREAMING DEVICE, 2017–2021 (USD BILLION)
                       TABLE 102 EUROPE: EDUCATION & LEARNING VERTICAL MARKET, BY STREAMING DEVICE, 2022–2027 (USD BILLION)
                       TABLE 103 EUROPE: GAMING VERTICAL MARKET, BY STREAMING DEVICE, 2017–2021 (USD BILLION)
                       TABLE 104 EUROPE: GAMING VERTICAL MARKET, BY STREAMING DEVICE, 2022–2027 (USD BILLION)
                       TABLE 105 EUROPE: SERVICE UTILITIES VERTICAL MARKET, BY STREAMING DEVICE, 2017–2021 (USD BILLION)
                       TABLE 106 EUROPE: SERVICE UTILITIES VERTICAL MARKET, BY STREAMING DEVICE, 2022–2027 (USD BILLION)
                       TABLE 107 EUROPE: OVER-THE-TOP SERVICES MARKET, BY COUNTRY/REGION, 2017–2021 (USD BILLION)
                       TABLE 108 EUROPE: OVER-THE-TOP SERVICES MARKET, BY COUNTRY/REGION, 2022–2027 (USD BILLION)
             10.3.3 UNITED KINGDOM
             10.3.4 GERMANY
             10.3.5 FRANCE
             10.3.6 ITALY
             10.3.7 SPAIN
             10.3.8 NORDIC REGION
             10.3.9 REST OF EUROPE
     10.4 ASIA PACIFIC 
             10.4.1 ASIA PACIFIC: RECESSION IMPACT
             10.4.2 ASIA PACIFIC: MARKET DRIVERS
                       FIGURE 23 ASIA PACIFIC: MARKET SNAPSHOT
                       TABLE 109 ASIA PACIFIC: OVER THE TOP MARKET, BY TYPE, 2017–2021 (USD BILLION)
                       TABLE 110 ASIA PACIFIC: OVER-THE-TOP SERVICES MARKET, BY TYPE, 2022–2027 (USD BILLION)
                       TABLE 111 ASIA PACIFIC: OVER-THE-TOP SERVICES MARKET, BY MONETIZATION MODEL, 2017–2021 (USD BILLION)
                       TABLE 112 ASIA PACIFIC: OVER-THE-TOP SERVICES MARKET, BY MONETIZATION MODEL, 2022–2027 (USD BILLION)
                       TABLE 113 ASIA PACIFIC: GAME STREAMING MARKET, BY MONETIZATION MODEL, 2017–2021 (USD BILLION)
                       TABLE 114 ASIA PACIFIC: GAME STREAMING MARKET, BY MONETIZATION MODEL, 2022–2027 (USD BILLION)
                       TABLE 115 ASIA PACIFIC: AUDIO STREAMING MARKET, BY MONETIZATION MODEL, 2017–2021 (USD BILLION)
                       TABLE 116 ASIA PACIFIC: AUDIO STREAMING MARKET, BY MONETIZATION MODEL, 2022–2027 (USD BILLION)
                       TABLE 117 ASIA PACIFIC: VIDEO STREAMING MARKET, BY MONETIZATION MODEL, 2017–2021 (USD BILLION)
                       TABLE 118 ASIA PACIFIC: VIDEO STREAMING MARKET, BY MONETIZATION MODEL, 2022–2027 (USD BILLION)
                       TABLE 119 ASIA PACIFIC: COMMUNICATION SERVICES MARKET, BY MONETIZATION MODEL, 2017–2021 (USD BILLION)
                       TABLE 120 ASIA PACIFIC: COMMUNICATION SERVICES MARKET, BY MONETIZATION MODEL, 2022–2027 (USD BILLION)
                       TABLE 121 ASIA PACIFIC: OVER THE TOP MARKET, BY SERVICE VERTICAL, 2017–2021 (USD BILLION)
                       TABLE 122 ASIA PACIFIC: OVER-THE-TOP SERVICES MARKET, BY SERVICE VERTICAL, 2022–2027 (USD BILLION)
                       TABLE 123 ASIA PACIFIC: OVER-THE-TOP SERVICES MARKET, BY STREAMING DEVICE, 2017–2021 (USD BILLION)
                       TABLE 124 ASIA PACIFIC: OVER-THE-TOP SERVICES MARKET, BY STREAMING DEVICE, 2022–2027 (USD BILLION)
                       TABLE 125 ASIA PACIFIC: MEDIA & ENTERTAINMENT VERTICAL MARKET, BY STREAMING DEVICE, 2017–2021 (USD BILLION)
                       TABLE 126 ASIA PACIFIC: MEDIA & ENTERTAINMENT VERTICAL MARKET, BY STREAMING DEVICE, 2022–2027 (USD BILLION)
                       TABLE 127 ASIA PACIFIC: EDUCATION & LEARNING VERTICAL MARKET, BY STREAMING DEVICE, 2017–2021 (USD BILLION)
                       TABLE 128 ASIA PACIFIC: EDUCATION & LEARNING VERTICAL MARKET, BY STREAMING DEVICE, 2022–2027 (USD BILLION)
                       TABLE 129 ASIA PACIFIC: GAMING VERTICAL MARKET, BY STREAMING DEVICE, 2017–2021 (USD BILLION)
                       TABLE 130 ASIA PACIFIC: GAMING VERTICAL MARKET, BY STREAMING DEVICE, 2022–2027 (USD BILLION)
                       TABLE 131 ASIA PACIFIC: SERVICE UTILITIES VERTICAL MARKET, BY STREAMING DEVICE, 2017–2021 (USD BILLION)
                       TABLE 132 ASIA PACIFIC: SERVICE UTILITIES VERTICAL MARKET, BY STREAMING DEVICE, 2022–2027 (USD BILLION)
                       TABLE 133 ASIA PACIFIC: OVER-THE-TOP SERVICES MARKET, BY COUNTRY, 2017–2021 (USD BILLION)
                       TABLE 134 ASIA PACIFIC: OVER THE TOP MARKET, BY COUNTRY, 2022–2027 (USD BILLION)
             10.4.3 CHINA
             10.4.4 JAPAN
             10.4.5 INDIA
             10.4.6 AUSTRALIA & NEW ZEALAND
             10.4.7 REST OF ASIA PACIFIC
     10.5 LATIN AMERICA 
             10.5.1 LATIN AMERICA: RECESSION IMPACT
             10.5.2 LATIN AMERICA: MARKET DRIVERS
                       TABLE 135 LATIN AMERICA: OVER-THE-TOP SERVICES MARKET, BY TYPE, 2017–2021 (USD BILLION)
                       TABLE 136 LATIN AMERICA: OVER-THE-TOP SERVICES MARKET, BY TYPE, 2022–2027 (USD BILLION)
                       TABLE 137 LATIN AMERICA: OVER THE TOP MARKET, BY MONETIZATION MODEL, 2017–2021 (USD BILLION)
                       TABLE 138 LATIN AMERICA: OVER-THE-TOP SERVICES MARKET, BY MONETIZATION MODEL, 2022–2027 (USD BILLION)
                       TABLE 139 LATIN AMERICA: GAME STREAMING MARKET, BY MONETIZATION MODEL, 2017–2021 (USD BILLION)
                       TABLE 140 LATIN AMERICA: GAME STREAMING MARKET, BY MONETIZATION MODEL, 2022–2027 (USD BILLION)
                       TABLE 141 LATIN AMERICA: AUDIO STREAMING MARKET, BY MONETIZATION MODEL, 2017–2021 (USD BILLION)
                       TABLE 142 LATIN AMERICA: AUDIO STREAMING MARKET, BY MONETIZATION MODEL, 2022–2027 (USD BILLION)
                       TABLE 143 LATIN AMERICA: VIDEO STREAMING MARKET, BY MONETIZATION MODEL, 2017–2021 (USD BILLION)
                       TABLE 144 LATIN AMERICA: VIDEO STREAMING MARKET, BY MONETIZATION MODEL, 2022–2027 (USD BILLION)
                       TABLE 145 LATIN AMERICA: COMMUNICATION SERVICES MARKET, BY MONETIZATION MODEL, 2017–2021 (USD BILLION)
                       TABLE 146 LATIN AMERICA: COMMUNICATION SERVICES MARKET, BY MONETIZATION MODEL, 2022–2027 (USD BILLION)
                       TABLE 147 LATIN AMERICA: OVER-THE-TOP SERVICES MARKET, BY SERVICE VERTICAL, 2017–2021 (USD BILLION)
                       TABLE 148 LATIN AMERICA: OVER THE TOP MARKET, BY SERVICE VERTICAL, 2022–2027 (USD BILLION)
                       TABLE 149 LATIN AMERICA: OVER-THE-TOP SERVICES MARKET, BY STREAMING DEVICE, 2017–2021 (USD BILLION)
                       TABLE 150 LATIN AMERICA: OVER-THE-TOP SERVICES MARKET, BY STREAMING DEVICE, 2022–2027 (USD BILLION)
                       TABLE 151 LATIN AMERICA: MEDIA & ENTERTAINMENT VERTICAL MARKET, BY STREAMING DEVICE, 2017–2021 (USD BILLION)
                       TABLE 152 LATIN AMERICA: MEDIA & ENTERTAINMENT VERTICAL MARKET, BY STREAMING DEVICE, 2022–2027 (USD BILLION)
                       TABLE 153 LATIN AMERICA: EDUCATION & LEARNING VERTICAL MARKET, BY STREAMING DEVICE, 2017–2021 (USD BILLION)
                       TABLE 154 LATIN AMERICA: EDUCATION & LEARNING VERTICAL MARKET, BY STREAMING DEVICE, 2022–2027 (USD BILLION)
                       TABLE 155 LATIN AMERICA: GAMING VERTICAL MARKET, BY STREAMING DEVICE, 2017–2021 (USD BILLION)
                       TABLE 156 LATIN AMERICA: GAMING VERTICAL MARKET, BY STREAMING DEVICE, 2022–2027 (USD BILLION)
                       TABLE 157 LATIN AMERICA: SERVICE UTILITIES VERTICAL MARKET, BY STREAMING DEVICE, 2017–2021 (USD BILLION)
                       TABLE 158 LATIN AMERICA: SERVICE UTILITIES VERTICAL MARKET, BY STREAMING DEVICE, 2022–2027 (USD BILLION)
                       TABLE 159 LATIN AMERICA: OVER-THE-TOP SERVICES MARKET, BY COUNTRY, 2017–2021 (USD BILLION)
                       TABLE 160 LATIN AMERICA: OVER THE TOP MARKET, BY COUNTRY, 2022–2027 (USD BILLION)
             10.5.3 MEXICO
             10.5.4 BRAZIL
             10.5.5 REST OF LATIN AMERICA
     10.6 MIDDLE EAST & AFRICA 
             10.6.1 MIDDLE EAST & AFRICA: RECESSION IMPACT
             10.6.2 MIDDLE EAST: MARKET DRIVERS
             10.6.3 AFRICA: MARKET DRIVERS
                       TABLE 161 MIDDLE EAST & AFRICA: OVER-THE-TOP SERVICES MARKET, BY TYPE, 2017–2021 (USD BILLION)
                       TABLE 162 MIDDLE EAST & AFRICA: OVER-THE-TOP SERVICES MARKET, BY TYPE, 2022–2027 (USD BILLION)
                       TABLE 163 MIDDLE EAST & AFRICA: OVER THE TOP MARKET, BY MONETIZATION MODEL, 2017–2021 (USD BILLION)
                       TABLE 164 MIDDLE EAST & AFRICA: OVER-THE-TOP SERVICES MARKET, BY MONETIZATION MODEL, 2022–2027 (USD BILLION)
                       TABLE 165 MIDDLE EAST & AFRICA: GAME STREAMING MARKET, BY MONETIZATION MODEL, 2017–2021 (USD BILLION)
                       TABLE 166 MIDDLE EAST & AFRICA: GAME STREAMING MARKET, BY MONETIZATION MODEL, 2022–2027 (USD BILLION)
                       TABLE 167 MIDDLE EAST & AFRICA: AUDIO STREAMING MARKET, BY MONETIZATION MODEL, 2017–2021 (USD BILLION)
                       TABLE 168 MIDDLE EAST & AFRICA: AUDIO STREAMING MARKET, BY MONETIZATION MODEL, 2022–2027 (USD BILLION)
                       TABLE 169 MIDDLE EAST & AFRICA: VIDEO STREAMING MARKET, BY MONETIZATION MODEL, 2017–2021 (USD BILLION)
                       TABLE 170 MIDDLE EAST & AFRICA: VIDEO STREAMING MARKET, BY MONETIZATION MODEL, 2022–2027 (USD BILLION)
                       TABLE 171 MIDDLE EAST & AFRICA: COMMUNICATION SERVICES MARKET, BY MONETIZATION MODEL, 2017–2021 (USD BILLION)
                       TABLE 172 MIDDLE EAST & AFRICA: COMMUNICATION SERVICES MARKET, BY MONETIZATION MODEL, 2022–2027 (USD BILLION)
                       TABLE 173 MIDDLE EAST & AFRICA: OVER-THE-TOP SERVICES MARKET, BY SERVICE VERTICAL, 2017–2021 (USD BILLION)
                       TABLE 174 MIDDLE EAST & AFRICA: OVER THE TOP MARKET, BY SERVICE VERTICAL, 2022–2027 (USD BILLION)
                       TABLE 175 MIDDLE EAST & AFRICA: OVER-THE-TOP SERVICES MARKET, BY STREAMING DEVICE, 2017–2021 (USD BILLION)
                       TABLE 176 MIDDLE EAST & AFRICA: OVER-THE-TOP SERVICES MARKET, BY STREAMING DEVICE, 2022–2027 (USD BILLION)
                       TABLE 177 MIDDLE EAST & AFRICA: MEDIA & ENTERTAINMENT VERTICAL MARKET, BY STREAMING DEVICE, 2017–2021 (USD BILLION)
                       TABLE 178 MIDDLE EAST & AFRICA: MEDIA & ENTERTAINMENT VERTICAL MARKET, BY STREAMING DEVICE, 2022–2027 (USD BILLION)
                       TABLE 179 MIDDLE EAST & AFRICA: EDUCATION & LEARNING VERTICAL MARKET, BY STREAMING DEVICE, 2017–2021 (USD BILLION)
                       TABLE 180 MIDDLE EAST & AFRICA: EDUCATION & LEARNING VERTICAL MARKET, BY STREAMING DEVICE, 2022–2027 (USD BILLION)
                       TABLE 181 MIDDLE EAST & AFRICA: GAMING VERTICAL MARKET, BY STREAMING DEVICE, 2017–2021 (USD BILLION)
                       TABLE 182 MIDDLE EAST & AFRICA: GAMING VERTICAL MARKET, BY STREAMING DEVICE, 2022–2027 (USD BILLION)
                       TABLE 183 MIDDLE EAST & AFRICA: SERVICE UTILITIES VERTICAL MARKET, BY STREAMING DEVICE, 2017–2021 (USD BILLION)
                       TABLE 184 MIDDLE EAST & AFRICA: SERVICE UTILITIES VERTICAL MARKET, BY STREAMING DEVICE, 2022–2027 (USD BILLION)
                       TABLE 185 MIDDLE EAST & AFRICA: OVER THE TOP MARKET, BY COUNTRY, 2017–2021 (USD BILLION)
                       TABLE 186 MIDDLE EAST & AFRICA: OVER-THE-TOP SERVICES MARKET, BY COUNTRY, 2022–2027 (USD BILLION)
             10.6.4 KINGDOM OF SAUDI ARABIA
             10.6.5 UNITED ARAB EMIRATES
             10.6.6 SOUTH AFRICA
             10.6.7 REST OF THE MIDDLE EAST & AFRICA
 
11 COMPETITIVE LANDSCAPE (Page No. - 135)
     11.1 OVERVIEW 
               TABLE 187 KEY DEVELOPMENTS BY LEADING PLAYERS IN OVER-THE-TOP SERVICES MARKET, 2021–2022
     11.2 COMPETITIVE SCENARIO 
               TABLE 188 MARKET EVALUATION FRAMEWORK, 2019–2022
             11.2.1 NEW PRODUCT LAUNCHES
                       TABLE 189 NEW PRODUCT LAUNCHES, 2021
             11.2.2 DEALS
                       TABLE 190 DEALS, 2020–2022
 
12 COMPANY PROFILES (Page No. - 141)
(Business Overview, Products/Solutions/Services Offered, Recent Developments, MnM view (Key strengths/Right to win, Strategic choices made, Weakness/competitive threats)*
     12.1 NETFLIX 
               TABLE 191 NETFLIX: BUSINESS OVERVIEW
               FIGURE 24 NETFLIX: COMPANY SNAPSHOT
               TABLE 192 NETFLIX: NEW PRODUCT LAUNCHES
               TABLE 193 NETFLIX: DEALS
     12.2 AMAZON 
               TABLE 194 AMAZON: BUSINESS OVERVIEW
               FIGURE 25 AMAZON: COMPANY SNAPSHOT
               TABLE 195 AMAZON: DEALS
     12.3 GOOGLE 
               TABLE 196 ALPHABET: BUSINESS OVERVIEW
               FIGURE 26 ALPHABET: COMPANY SNAPSHOT
               TABLE 197 GOOGLE: DEALS
     12.4 APPLE 
               TABLE 198 APPLE: BUSINESS OVERVIEW
               FIGURE 27 APPLE: COMPANY SNAPSHOT
               TABLE 199 APPLE: NEW PRODUCT LAUNCHES
               TABLE 200 APPLE: DEALS
     12.5 META 
               TABLE 201 META: COMPANY SNAPSHOT
               FIGURE 28 META: COMPANY SNAPSHOT
               TABLE 202 META: NEW PRODUCT LAUNCHES
               TABLE 203 META: DEALS
     12.6 HBO 
               TABLE 204 HBO: BUSINESS OVERVIEW
               FIGURE 29 WARNER BROS. DISCOVERY: COMPANY SNAPSHOT
               TABLE 205 HBO: DEALS
     12.7 THE WALT DISNEY COMPANY 
               TABLE 206 THE WALT DISNEY COMPANY: BUSINESS OVERVIEW
               FIGURE 30 THE WALT DISNEY COMPANY: COMPANY SNAPSHOT
               TABLE 207 THE WALT DISNEY COMPANY: DEALS
     12.8 INDIEFLIX 
               TABLE 208 INDIEFLIX: BUSINESS OVERVIEW
     12.9 FANDANGO MEDIA 
               TABLE 209 FANDANGO MEDIA: BUSINESS OVERVIEW
     12.10 ROKU 
               TABLE 210 ROKU: BUSINESS OVERVIEW
               FIGURE 31 ROKU: COMPANY SNAPSHOT
               TABLE 211 ROKU: NEW PRODUCT LAUNCHES
               TABLE 212 ROKU: DEALS
     12.11 TENCENT 
               TABLE 213 TENCENT: BUSINESS OVERVIEW
               FIGURE 32 TENCENT: COMPANY SNAPSHOT
               TABLE 214 TENCENT: DEALS
     12.12 RAKUTEN 
               TABLE 215 RAKUTEN: BUSINESS OVERVIEW
               FIGURE 33 RAKUTEN: COMPANY SNAPSHOT
               TABLE 216 RAKUTEN: DEALS
     12.13 KAKAO 
               TABLE 217 KAKAO: BUSINESS OVERVIEW
               FIGURE 34 KAKAO: COMPANY SNAPSHOT
               TABLE 218 KAKAO: DEALS
*Details on Business Overview, Products/Solutions/Services Offered, Recent Developments, MnM view (Key strengths/Right to win, Strategic choices made, Weakness/competitive threats)* might not be captured in case of unlisted companies.
 
13 APPENDIX (Page No. - 182)
     13.1 DISCUSSION GUIDE 
     13.2 KNOWLEDGESTORE: MARKETSANDMARKETS’ SUBSCRIPTION PORTAL 
     13.3 RELATED REPORTS 
     13.4 AUTHOR DETAILS 
 

The study involved 4 major activities to estimate the current size of the Over-the-Top (OTT) services market. Exhaustive secondary research was done to collect information on the OTT services market. The next step was to validate these findings, assumptions, and sizing with industry experts across the value chain using primary research. Both top-down and bottom-up approaches were employed to estimate the complete market size. Thereafter, the market breakup and data triangulation procedures were used to estimate the market size of the segments and sub-segments of the OTT services market.

Secondary Research

In the secondary research process, various secondary sources, such as D&B Hoovers, Bloomberg, BusinessWeek, and Dun & Bradstreet, were referred to identify and collect information for this study. These secondary sources included annual reports, press releases, and investor presentations of companies; whitepapers, certified publications, and articles by recognized authors; gold standard and silver standard websites; regulatory bodies; trade directories; and databases.

Primary Research

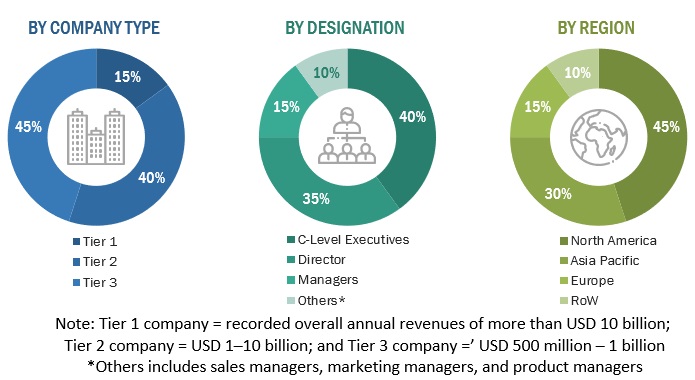
The OTT services market comprises several stakeholders, such as OTT operators, OTT service providers, venture capitalists, government organizations, regulatory authorities, policymakers and financial organizations, consulting firms, research organizations, academic institutions, resellers and distributors, and training providers. The demand side of the OTT services market consists of all the firms operating in several industry verticals. The supply side includes OTT service providers, offering OTT services. Various primary sources from both the supply and demand sides of the market were interviewed to obtain qualitative and quantitative information. Given below is the breakup of the primary respondents:
Over-the-Top Services Market (OTT) Market Size, and Share

To know about the assumptions considered for the study, download the pdf brochure

Market Size Estimation

Both the top-down and bottom-up approaches were used to estimate and validate the size of the global OTT services market and various other dependent submarkets in the overall market. An exhaustive list of all the players who offer solutions and services in the OTT services market was prepared while using the top-down approach. The market share for all the players in the market was estimated through annual reports, press releases, funding, investor presentations, paid databases, and primary interviews. Each player was evaluated based on its operational model component (type, monetization model, streaming devices). The aggregate of all companies’ revenues was extrapolated to reach the overall market size.

Furthermore, each subsegment was studied and analyzed for its global market size and regional penetration. The markets were triangulated through both primary and secondary research. The primary procedure included extensive interviews for key insights from the industry leaders, such as Chief Executive Officers (CEOs), Vice Presidents (VPs), directors, and marketing executives.

Data Triangulation

After arriving at the overall OTT services market size using the market size estimation processes as explained above, the market was split into several segments and subsegments. The data triangulation and market breakup procedures were employed, wherever applicable, to complete the overall market engineering process and arrive at the exact statistics of each market segment and subsegment. The data was triangulated by studying various factors and trends from both the demand and supply sides.

Report Objectives

  • To determine and forecast the global OTT services market by type, monetization model, streaming device, service vertical, and region from 2022 to 2027, and analyze the various macroeconomic and microeconomic factors that affect the market growth
  • To forecast the size of the market segments with respect to 5 main regions, namely, North America, Europe, Asia Pacific (APAC), Middle East and Africa (MEA), and Latin America
  • To analyze each submarket with respect to individual growth trends, prospects, and contributions to the overall OTT services market
  • To profile key market players; generate a comparative analysis based on their business overviews, service offerings, regional presence, business strategies, and key financials; and provide companies with in-house statistical tools required to understand the competitive landscape
  • To track and analyze competitive developments, such as mergers and acquisitions, product developments, partnerships and collaborations, and Research and Development (R&D) activities, in the market
  • To provide detailed information about major factors (drivers, restraints, opportunities, and challenges) influencing the growth of the OTT services market

Available Customizations

Along with the market data, MarketsandMarkets offers customizations as per the company’s specific needs. The following customization options are available for the report:

Company information

  • Detailed analysis and profiling of additional market players (Up to 5)
Custom Market Research Services

We will customize the research for you, in case the report listed above does not meet with your exact requirements. Our custom research will comprehensively cover the business information you require to help you arrive at strategic and profitable business decisions.

Request Customization

Instant Answers with GPT - Ask Now!

Ask real questions. Get complete answers !
Report Code
TC 2445
Published ON
Jan, 2023
Choose License Type
BUY NOW
  • SHARE
X
Request Customization
Speak to Analyst
Speak to Analyst
OR FACE-TO-FACE MEETING
PERSONALIZE THIS RESEARCH
  • Triangulate with your Own Data
  • Get Data as per your Format and Definition
  • Gain a Deeper Dive on a Specific Application, Geography, Customer or Competitor
  • Any level of Personalization
REQUEST A FREE CUSTOMIZATION
LET US HELP YOU!
  • What are the Known and Unknown Adjacencies Impacting the Over the Top Market
  • What will your New Revenue Sources be?
  • Who will be your Top Customer; what will make them switch?
  • Defend your Market Share or Win Competitors
  • Get a Scorecard for Target Partners
CUSTOMIZED WORKSHOP REQUEST
+1-888-600-6441
  • Call Us
  • +1-888-600-6441 (Corporate office hours)
  • +1-888-600-6441 (US/Can toll free)
  • +44-800-368-9399 (UK office hours)
CONNECT WITH US
ABOUT TRUST ONLINE
©2024 MarketsandMarkets Research Private Ltd. All rights reserved
DMCA.com Protection Status Website Feedback