Passenger Informatio

Passenger Information System Market, By Solution (Display System, Announcement System, Emergency Communication System, Infotainment System), Transportation Mode (Railways, Roadways, Airways & Waterways) - Global Forecast to 2028

Report Code: TC 2279 Mar, 2024, by marketsandmarkets.com

The global passenger information system market size reached US$ 29.3 Billion in 2023. Looking forward, expects the market to reach US$ 52.6 Billion by 2028, exhibiting a growth rate (CAGR) of 12.4% during 2024-2028. The PIS system market is expected to substantially surge in the coming years. This growth is fueled by several key trends such as passengers demanding better experiences, technological advancements such as AI and IoT, a focus on cost efficiency, the rise of cloud-based solutions, increasing urbanization and public transport use, and supportive government initiatives. These factors will combine to create a booming market for PIS systems, making them an essential tool for transportation providers seeking to attract and retain passengers while optimizing operations.
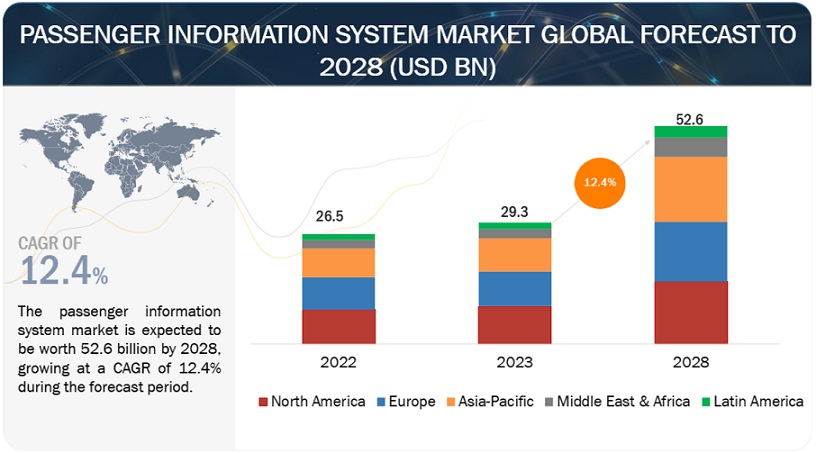
Passenger Information System Market

To know about the assumptions considered for the study, Request for Free Sample Report
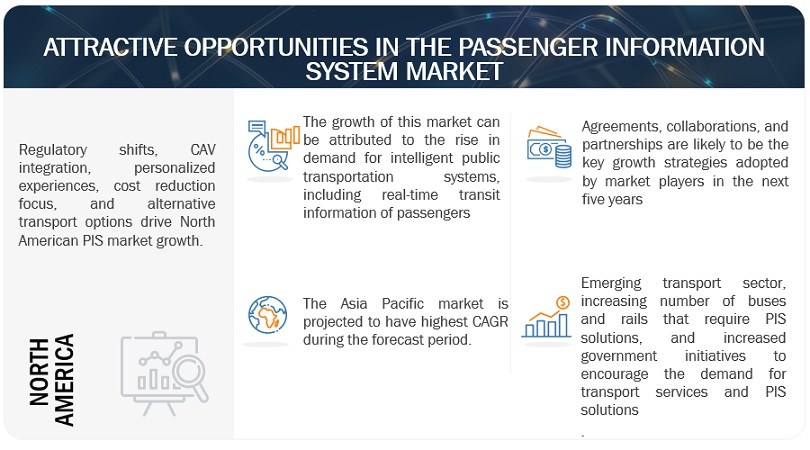
Passenger Information System Market Opportunities

To know about the assumptions considered for the study, download the pdf brochure

Passenger Information System Market Trends

Driver: Rise in demand for intelligent public transportation systems, including real-time transit information of passengers

Intelligent public transportation systems are promoting the passenger information system (PIS) market in several ways. Firstly, the demand for reliable real-time information, for instance exact arrival times and delays, is crucial for passengers and drives the need for advanced PIS solutions. Secondly, these systems prioritize a positive user experience, and PIS plays a key role by reducing stress and empowering passengers through information. Additionally, PIS acts as a core component, integrating data from various sources to provide a unified picture for passengers, necessitating further market growth. Furthermore, government investments in these intelligent systems directly impact PIS demand as accurate and timely data delivery is essential. Finally, advancements in technology further enhance the capabilities of PIS, making it more valuable and driving the market forward.  In essence, the rise of intelligent public transportation creates a strong demand for reliable passenger information, propelling the growth of the PIS market. Vendors in this market offer real-time information to passengers through different modes, such as smartphones, platform-level signage, third-party applications, and automated public-address systems. The information comprises both predictions about arrival and departure times, as well as information about the nature and causes of delays or disruptions.

Restraint: High costs involved in implementing and maintaining the passenger information systems

The overall cost of a PIS system includes the implementation and maintenance costs that can restrain the PIS market growth. The implementation costs primarily consist of the cost of designing the system, purchasing and installing the equipment needed for the system to work (including conduit), and monitoring the system's quality before it is released to the public. The maintenance costs comprise the entire cost of all inputs required to operate and maintain the real-time PIS solutions and services. It also includes operating costs that consist of electricity costs required to power the systems, the cost of data transfer between units of the system, and the parts and equipment utilized by maintenance staff in conducting their work. Maintaining the PIS system requires special attention as the information about passengers and public transport keeps changing. PIS systems also provide information about including new Passenger Transport (PT) operators in the Integrated Passenger Information (IPI) system, vehicle fleet changes as per requirements, and vehicle equipment breakdowns. Thus, PIS encompasses complex operational procedures due to the integration of associated additional components, increasing the overall costs due to technical hitches associated with the installation and the cost of employing experienced and skilled professionals related to the PIS market. PIS solutions and services further require regular upgrades to ensure the efficient functionality and reliability of the system, which leads to a rise in the overall maintenance costs, inhibiting the growth of the global PIS market.

Opportunity: Adoption of IoT, 5G, and automation technologies to enhance technological optimization

The evolution of IoT has enabled the exchange of information between different electronic devices without the need for direct human interaction. The convergence of IoT platforms with PIS is projected to help drive the market's growth. IoT is a combination of storing, processing, and computing sensor data using data analytics to achieve and assist the management of traffic systems effectively. IoT-based Intelligent Transportation Systems (ITS) help automate railways, roadways, airways, and marine lines, enhancing passengers' travel experiences. Smart devices integrated for improved connectivity, automation, and control are projected to become more self-governing and intelligent in terms of sharing data with transportation management control centers and the cloud.

Moreover, logistics vendors are finding ways to face new economic challenges with the help of technologies, such as Radio-Frequency Identification (RFID), Global System for Mobile Communications-Railway (GSM-R), and collaboration platforms. In addition, according to The Mobile Economy 2020, IoT will be an integral part of the 5G era. Between 2019 and 2025, the number of global IoT connections will be more than double, reaching nearly 25 billion, while global IoT revenue would triple to USD 1.1 trillion. The transportation industry is gradually adopting 5G networks for performing its business operations. These next-generation wireless networks would be an essential weapon for the successful adoption of IoT. The policies to support R&D activities and commercialize 5G that have been drawn globally, which would help increase IoT usage. The high speed and low latency of the 5G networks enable the passengers to get real-time data about their journeys quickly. For instance, China plans to implement the 5G technology for many life-transforming applications, from 3D video to immersive media and autonomous vehicles. China is projected to reach 576 million 5G connections by 2025, which covers nearly 40% of 5G connections globally. Hence, 5G is projected to provide improved connectivity by providing the speed, reliability, capacity, and mobility manufacturers require for a successful IoT implementation.

Challenge: Complexities in the integration over the legacy infrastructure and communication networks

Legacy systems are outdated computer software and hardware that remain in use even after the installation of modern technologies. Legacy systems are crucial for organizations as they support some key functionalities of the business. Organizations require to upgrade their legacy systems as it becomes difficult to continue with systems whose services are discontinued from vendors. Many of the legacy systems do not have the configuration required to connect with smart devices and enhanced communication networks. The PIS market vendors face challenges in integrating these legacy systems with various components present in the smart public transportation ecosystem. The smart public transportation ecosystem integrates multiple technology elements, such as software, hardware, and network elements, and involves multiple vendors. The integration of smart technology elements with legacy transportation systems is highly complex due to the lack of an open interface and protocol issues. These integration issues would then lead to communication gaps between traditional systems and technologically advanced systems. In addition, the upgradation of legacy systems requires high investments. These complexities are expected to restrict the PIS market growth in the coming years.

Ecosystem Of Passenger Information System Market
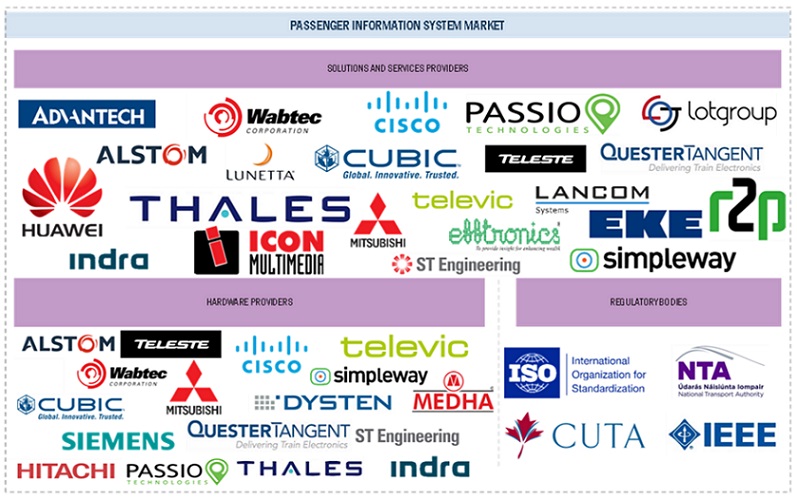
Top Companies in Passenger Information System Market

The prominent players in the passenger information system market include Advantech Co., Ltd. (Taiwan), Alstom SA (France), Wabtec Corporation (US), Cisco Systems (US), Cubic Corporation (US), and so on. These companies have been operating in the market for several years and possess a diversified product portfolio and state-of-the-art technologies with a well-established geographic footprint.

"By location, on-board segment to hold the largest market size during the forecast period.”

Passengers demand real-time travel updates, and on-board PIS systems delivery. Fueled by better connectivity, safety concerns, and wider applications, these systems are projected to dominate the market (2023-2028). From trains navigating delays to planes displaying gate information, location-specific benefits solidify their lead. Cost-effectiveness and integration with other technologies further enhance the deal, making on-board PIS systems the go-to solution for a seamless and informed passenger experience.

“Roadways segment is expected to have the fastest growth rate during the forecast period.”

Roadways are anticipated to have the fastest growth rate during the forecast period 2023-2028. The market growth is driven by connected and autonomous vehicles relying on PIS for navigation. It’s a key player for cities focused on efficient public transport which displays live bus arrival info and optimizes the routes. Cost-effective and flexible, PIS appeals to both private and public providers. Additionally, mobile app integration lets passengers access information on the go. Safety is paramount, with PIS displaying accident alerts and emergency procedures.

“North America to have the largest market size during the forecast period.”

North America is projected to have a stronghold in the on-board PIS market, with the largest market size during the forecast period. Tech-savvy citizens demand the latest PIS features, from real-time displays to AI chatbots. The region's vast transportation network demands robust solutions, and government support for smart cities and ITS fuels market growth. PIS systems enhance passenger’s experience with real-time information and reduced wait times, boosting market demand and providing a solid foundation for future growth.
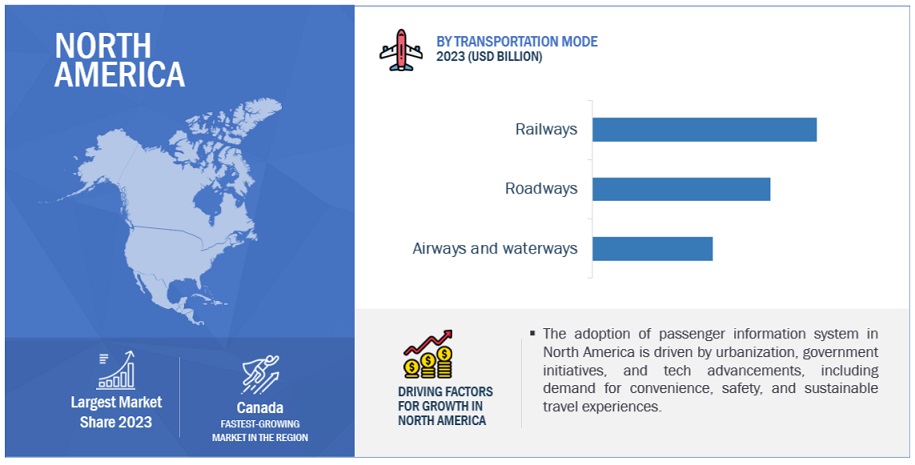
North American Passenger Information System Market Size, and Share

Market Players:

The major players in the passenger information system Advantech Co., Ltd. (Taiwan), Alstom SA (France), Wabtec Corporation (US), Cisco Systems (US), Cubic Corporation (US), Siemens AG (Germany), Hitachi Ltd. (Japan), Huawei Technologies Co., Ltd. (China), Mitsubishi Electric Corporation (Japan), Televic (Belgium), ST Engineering Ltd (Singapore), Indra (Spain), Medha Servo Drives (India), Efftronics Systems Pvt. Ltd. (India), Dysten (Poland), Lunetta (India), r2p Group (Germany), Icon Multimedia (Spain), Passio Technologies (US), Teleste (Finland), Lancom D.O.O (Slovenia), Simpleway (Czech Republic), Eke-Electronics (Finland), Quester Tangent (Canada), and LOT Group (Ukraine). These players have adopted various growth strategies, such as partnerships, agreements and collaborations, new product launches and enhancements, and acquisitions to expand their passenger information system market footprint.

Get online access to the report on the World's First Market Intelligence Cloud

  • Easy to Download Historical Data & Forecast Numbers
  • Company Analysis Dashboard for high growth potential opportunities
  • Research Analyst Access for customization & queries
  • Competitor Analysis with Interactive dashboard
  • Latest News, Updates & Trend analysis
Request Sample

Scope of the Report

Report Metrics

Details

Market size available for years

2017-2028

Base year considered

2022

Forecast period

2023–2028

Forecast units

Value (USD) Billion

Segments Covered

By Solution (Display System, Announcement System, Emergency Communication System, Infotainment System), Transportation Mode (Railways, Roadways, Airways & Waterways)

Region covered

North America, Europe, Asia Pacific, Middle East & Africa, and Latin America.

Companies covered

Advantech Co., Ltd. (Taiwan), Alstom SA (France), Wabtec Corporation (US), Cisco Systems (US), Cubic Corporation (US), Siemens AG (Germany), Hitachi Ltd. (Japan), Huawei Technologies Co., Ltd. (China), Mitsubishi Electric Corporation (Japan), Televic (Belgium), ST Engineering Ltd (Singapore), Indra (Spain), Medha Servo Drives (India), Efftronics Systems Pvt. Ltd. (India), Dysten (Poland), Lunetta (India), r2p Group (Germany), Icon Multimedia (Spain), Passio Technologies (US), Teleste (Finland), Lancom D.O.O (Slovenia), Simpleway (Czech Republic), Eke-Electronics (Finland), Quester Tangent (Canada), LOT Group (Ukraine)

This research report categorizes the passenger information system market to forecast revenues and analyze trends in each of the following submarkets:

Based on offering:
  • Solution
    • Display systems
    • Announcement systems
    • Emergency communication systems
    • Mobile applications
    • Infotainment System
    • Video Surveillance System
    • Other solutions (Content Management System, In-station and On-board Wi-Fi System, and Passenger Counting & Occupancy Information System)
  • Services
    • Consulting
    • Deployment & Integration
    • Support & Maintenance
Based on location:
  • On-board
  • In-station
Based on Transportation Mode:
  • Railways
    • Trains
    • Trams
  • Roadways
  • Airways and waterways
By Region:
  • North America
    • United States (US)
    • Canada
  • Europe
    • United Kingdom (UK)
    • Germany
    • France
    • Italy
    • Spain
    • Nordic countries
    • Rest of Europe
  • Asia Pacific
    • China
    • Japan
    • India
    • South Korea
    • Australia & New Zealand
    • Rest of Asia Pacific
  • Middle East & Africa
    • GCC Countries
      • Kingdom of Saudi Arabia (KSA)
      • United Arab Emirates (UAE)
      • Rest of GCC Countries
    • South Africa
    • Rest of the Middle East & Africa
  • Latin America
    • Brazil
    • Mexico
    • Rest of Latin America

Recent Developments

  • In December 2023, Alstom launched its largest Digital Experience Centre for developing next generation Signaling solutions in India with a total investment of USD 43 million over the last decade.
  • In January 2022, Siemens Mobility developed a new Passenger Info Plus system by collaborating with Wiener Linien to meet the special public transport requirements in Vienna.

Frequently Asked Questions (FAQ):

To speak to our analyst for a discussion on the above findings, click Speak to Analyst

TABLE OF CONTENTS
 
1 INTRODUCTION (Page No. - 29)
    1.1 STUDY OBJECTIVES 
    1.2 MARKET DEFINITION 
    1.3 STUDY SCOPE 
           1.3.1 MARKET SEGMENTATION
                    FIGURE 1 PASSENGER INFORMATION SYSTEM MARKET SEGMENTATION
           1.3.2 REGIONS COVERED
                    FIGURE 2 PASSENGER INFORMATION SYSTEM MARKET SEGMENTATION, BY REGION
           1.3.3 INCLUSIONS & EXCLUSIONS
           1.3.4 YEARS CONSIDERED
                    FIGURE 3 YEARS CONSIDERED
    1.4 CURRENCY CONSIDERED 
           TABLE 1 USD EXCHANGE RATES, 2021–2023
    1.5 STAKEHOLDERS 
    1.6 SUMMARY OF CHANGES 
           1.6.1 IMPACT OF RECESSION
 
2 RESEARCH METHODOLOGY (Page No. - 35)
    2.1 RESEARCH DATA 
           FIGURE 4 PASSENGER INFORMATION SYSTEM MARKET: RESEARCH DESIGN
           2.1.1 SECONDARY DATA
           2.1.2 PRIMARY DATA
                    2.1.2.1 Primary interviews with experts
                    2.1.2.2 Breakdown of primary profiles
                               FIGURE 5 BREAKDOWN OF PRIMARY INTERVIEWS, BY COMPANY TYPE, DESIGNATION, AND REGION
                    2.1.2.3 Key insights from industry experts
                               FIGURE 6 KEY INSIGHTS FROM INDUSTRY EXPERTS
    2.2 MARKET SIZE ESTIMATION 
           FIGURE 7 PASSENGER INFORMATION SYSTEM MARKET: TOP-DOWN AND BOTTOM-UP APPROACHES
           2.2.1 TOP-DOWN APPROACH
                    FIGURE 8 APPROACH 1 (SUPPLY SIDE): REVENUE OF VENDORS IN PASSENGER INFORMATION SYSTEM MARKET
           2.2.2 BOTTOM-UP APPROACH
                    FIGURE 9 APPROACH 2 (DEMAND SIDE): PASSENGER INFORMATION SYSTEM MARKET
                    FIGURE 10 MARKET SIZE ESTIMATION USING BOTTOM-UP APPROACH
    2.3 DATA TRIANGULATION 
           FIGURE 11 DATA TRIANGULATION
    2.4 RISK ASSESSMENT 
           TABLE 2 RISK ASSESSMENT
    2.5 RESEARCH ASSUMPTIONS 
           TABLE 3 RESEARCH ASSUMPTIONS
    2.6 LIMITATIONS 
    2.7 IMPLICATION OF RECESSION ON PASSENGER INFORMATION SYSTEM MARKET 
 
3 EXECUTIVE SUMMARY (Page No. - 46)
    FIGURE 12 PASSENGER INFORMATION SYSTEM MARKET TO WITNESS SIGNIFICANT GROWTH DURING FORECAST PERIOD 
    FIGURE 13 MARKET: REGIONAL SNAPSHOT 
 
4 PREMIUM INSIGHTS (Page No. - 49)
    4.1 ATTRACTIVE OPPORTUNITIES FOR PLAYERS IN PASSENGER INFORMATION SYSTEM MARKET 
           FIGURE 14 INCREASE IN DEMAND FOR INTELLIGENT TRANSPORTATION SYSTEMS TO DRIVE MARKET
    4.2 MARKET: TOP GROWING SEGMENTS 
           FIGURE 15 TOP GROWING SEGMENTS IN MARKET IN 2023
    4.3 MARKET, BY OFFERING 
           FIGURE 16 PASSENGER INFORMATION SYSTEM SERVICES TO WITNESS FASTER GROWTH RATE DURING FORECAST PERIOD
    4.4 MARKET, BY SOLUTION 
           FIGURE 17 DISPLAY SYSTEMS TO LEAD SOLUTIONS SEGMENT IN 2023
    4.5 PASSENGER INFORMATION SYSTEM MARKET, BY SERVICE 
           FIGURE 18 DEPLOYMENT & INTEGRATION TO BE FASTEST-GROWING SERVICES SEGMENT DURING FORECAST PERIOD
    4.6 MARKET, BY TRANSPORTATION MODE 
           FIGURE 19 RAILWAYS SEGMENT TO LEAD MARKET DURING FORECAST PERIOD
    4.7 NORTH AMERICA: MARKET, BY OFFERING AND TRANSPORTATION MODE 
           FIGURE 20 SOLUTIONS AND RAILWAYS TO ACCOUNT FOR LARGEST SEGMENTAL SHARES IN 2023
 
5 PASSENGER INFORMATION SYSTEM MARKET OVERVIEW AND INDUSTRY TRENDS (Page No. - 53)
    5.1 MARKET OVERVIEW 
    5.2 MARKET DYNAMICS 
           FIGURE 21 DRIVERS, RESTRAINTS, OPPORTUNITIES, AND CHALLENGES: PASSENGER INFORMATION SYSTEM MARKET
           5.2.1 DRIVERS
                    5.2.1.1 Rise in demand for smart public transportation systems, including real-time transit information of passengers
                    5.2.1.2 Increase in adoption of handheld devices led to rise in connectivity and usage of advertising and information systems
                    5.2.1.3 Advancements in technological solutions to enhance passenger experience
                    5.2.1.4 Rise in urban population and traffic in public transportation systems
                               TABLE 4 TOP 10 CONGESTED CITIES WORLDWIDE
           5.2.2 RESTRAINTS
                    5.2.2.1 High costs involved in implementing and maintaining passenger information systems
                    5.2.2.2 Stringent transportation regulatory policies
           5.2.3 OPPORTUNITIES
                    5.2.3.1 Adoption of IoT, 5G, and automation technologies to enhance technological optimization
                    5.2.3.2 Increase in penetration of cloud, big data, and analytics in PIS
                    5.2.3.3 Decline in vehicle ownership with advancements in Mobility-as-a-Service (MaaS)
           5.2.4 CHALLENGES
                    5.2.4.1 Complexities in integration over legacy infrastructure and communication networks
                    5.2.4.2 Multiple sensors and touchpoints pose data fusion challenges
    5.3 BRIEF HISTORY OF PASSENGER INFORMATION SYSTEM 
           FIGURE 22 BRIEF HISTORY OF PASSENGER INFORMATION SYSTEM
           5.3.1 1600–1990
           5.3.2 1999–2009
           5.3.3 2010–2019
           5.3.4 2020–PRESENT
    5.4 ECOSYSTEM/MARKET MAP 
           FIGURE 23 PASSENGER INFORMATION SYSTEM MARKET: KEY PLAYERS IN ECOSYSTEM
           TABLE 5 ECOSYSTEM: PASSENGER INFORMATION SYSTEM MARKET
    5.5 CASE STUDY ANALYSIS 
           5.5.1 READING BUSES ENHANCED TRAVEL INFORMATION AND MARKETING WITH NIMBUS
           5.5.2 PLATFORM SCREEN DOOR AND PASSENGER INFORMATION SYSTEM SOLUTIONS FOR RIYADH METRO, KINGDOM OF SAUDI ARABIA
           5.5.3 PASSENGER INFORMATION SYSTEM FOR RAILWAYS BY DYSTEN AT OLESNO RAILWAY STATION
           5.5.4 HUAWEI HELPED RUILI AIRLINES IMPROVE PASSENGER EXPERIENCE WITH PRIVATE CLOUD PLATFORM
           5.5.5 TELESTE PROVIDED STADLER WITH ONBOARD SYSTEM FOR ITS HELSINKI SM5 TRAINS
    5.6 VALUE CHAIN ANALYSIS 
           FIGURE 24 PASSENGER INFORMATION SYSTEM MARKET: VALUE CHAIN
    5.7 PRICING ANALYSIS 
           5.7.1 INDICATIVE PRICING ANALYSIS, BY HARDWARE
                    FIGURE 25 INDICATIVE PRICING ANALYSIS, BY HARDWARE
                    TABLE 6 INDICATIVE PRICING ANALYSIS, BY HARDWARE (USD)
           5.7.2 INDICATIVE PRICING ANALYSIS, BY TRANSPORTATION MODE
                    TABLE 7 INDICATIVE PRICING ANALYSIS, BY TRANSPORTATION MODE (USD)
    5.8 PORTER’S FIVE FORCES MODEL 
           TABLE 8 PORTER’S FIVE FORCES ANALYSIS: PASSENGER INFORMATION SYSTEM MARKET
           5.8.1 THREAT OF NEW ENTRANTS
           5.8.2 THREAT OF SUBSTITUTES
           5.8.3 BARGAINING POWER OF BUYERS
           5.8.4 BARGAINING POWER OF SUPPLIERS
           5.8.5 INTENSITY OF COMPETITIVE RIVALRY
    5.9 TARIFF AND REGULATORY LANDSCAPE 
           5.9.1 TARIFFS RELATED TO PARTS OF ROLLING STOCK
                    TABLE 9 TARIFFS RELATED TO PARTS OF ROLLING STOCK
           5.9.2 REGULATORY BODIES, GOVERNMENT AGENCIES, AND OTHER ORGANIZATIONS
                    5.9.2.1 International organization for standardization standards
                               5.9.2.1.1 ISO/IEC JTC 1
                               5.9.2.1.2 ISO/IEC 27001
                               5.9.2.1.3 ISO/IEC 19770
                               5.9.2.1.4 ISO/IEC JTC 1/SWG 5
                               5.9.2.1.5 ISO/IEC JTC 1SC 31
                               5.9.2.1.6 ISO/IEC JTC 1/SC 27
                               5.9.2.1.7 ISO/IEC JTC 1/WG 7 sensors
                    5.9.2.2 General data protection regulation
                    5.9.2.3 Institute of electrical and electronics engineers
                               TABLE 10 NORTH AMERICA: REGULATORY BODIES, GOVERNMENT AGENCIES, AND OTHER ORGANIZATIONS
                               TABLE 11 EUROPE: LIST OF REGULATORY BODIES, GOVERNMENT AGENCIES, AND OTHER ORGANIZATIONS
                               TABLE 12 ASIA PACIFIC: LIST OF REGULATORY BODIES, GOVERNMENT AGENCIES, AND OTHER ORGANIZATIONS
                               TABLE 13 REST OF THE WORLD: LIST OF REGULATORY BODIES, GOVERNMENT AGENCIES, AND OTHER ORGANIZATIONS
    5.10 PATENT ANALYSIS 
           FIGURE 26 LIST OF MAJOR PATENTS FOR PASSENGER INFORMATION SYSTEM MARKET
           5.10.1 LIST OF MAJOR PATENTS
    5.11 TECHNOLOGY ANALYSIS 
           5.11.1 KEY TECHNOLOGIES
                    5.11.1.1 Sensor technologies
                    5.11.1.2 Communication technologies
                    5.11.1.3 Display technologies
                    5.11.1.4 Big data and analytics
           5.11.2 COMPLEMENTARY TECHNOLOGIES
                    5.11.2.1 Location-based services
                    5.11.2.2 Digital payment
           5.11.3 ADJACENT TECHNOLOGIES
                    5.11.3.1 Internet of Things (IoT)
                    5.11.3.2 Artificial Intelligence (AI)/Machine Learning (ML)
                    5.11.3.3 Blockchain
    5.12 KEY STAKEHOLDERS & BUYING CRITERIA 
           5.12.1 KEY STAKEHOLDERS IN BUYING PROCESS
                    FIGURE 27 INFLUENCE OF STAKEHOLDERS ON BUYING PROCESS FOR TOP THREE END USERS
                    TABLE 14 INFLUENCE OF STAKEHOLDERS ON BUYING PROCESS FOR END USERS
           5.12.2 BUYING CRITERIA
                    FIGURE 28 KEY BUYING CRITERIA FOR TOP THREE END USERS
                    TABLE 15 KEY BUYING CRITERIA FOR TOP END USERS
    5.13 KEY CONFERENCES & EVENTS 
                    TABLE 16 MARKET: DETAILED LIST OF CONFERENCES & EVENTS, 2023–2024
    5.14 DISRUPTIONS IMPACTING BUYERS/CLIENTS IN MARKET 
                    FIGURE 29 PASSENGER INFORMATION SYSTEM MARKET: DISRUPTIONS IMPACTING BUYERS/CLIENTS
    5.15 BEST PRACTICES IN PASSENGER INFORMATION SYSTEM MARKET 
           5.15.1 USER-CENTRIC DESIGN
           5.15.2 REAL-TIME DATA INTEGRATION
           5.15.3 MULTIMODAL COMPATIBILITY
           5.15.4 CYBERSECURITY AND DATA PRIVACY
           5.15.5 OPEN STANDARDS AND INTEROPERABILITY
           5.15.6 PROACTIVE COMMUNICATION AND EMERGENCY MANAGEMENT
           5.15.7 CONTINUOUS INNOVATION AND ADAPTABILITY
    5.16 CURRENT AND EMERGING BUSINESS MODELS 
           5.16.1 SUBSCRIPTION MODEL
           5.16.2 ADVERTISING-BASED
           5.16.3 PER-PASSENGER FEE
           5.16.4 DATA ANALYTICS MODEL
           5.16.5 SAAS (SOFTWARE-AS-A-SERVICE)
           5.16.6 API INTEGRATION
           5.16.7 BLOCKCHAIN-BASED SYSTEMS
           5.16.8 PERSONALIZED INFORMATION SERVICES
    5.17 PASSENGER INFORMATION SYSTEM TOOLS, FRAMEWORKS, AND TECHNIQUES 
    5.18 FUTURE LANDSCAPE OF PASSENGER INFORMATION SYSTEM MARKET 
           5.18.1 SHORT-TERM ROADMAP (2023–2025)
           5.18.2 MID-TERM ROADMAP (2026–2028)
           5.18.3 LONG-TERM ROADMAP (2029–2030)
    5.19 TRADE ANALYSIS: REGULATING OR CONTROLLING INSTRUMENTS AND APPARATUS (9032) 
           5.19.1 EXPORT SCENARIO OF REGULATING OR CONTROLLING INSTRUMENTS AND APPARATUS (9032)
                    FIGURE 30 EXPORT OF REGULATING OR CONTROLLING INSTRUMENTS AND APPARATUS, BY KEY COUNTRY, 2015–2022 (USD BILLION)
           5.19.2 IMPORT SCENARIO OF REGULATING OR CONTROLLING INSTRUMENTS AND APPARATUS (9032)
                    FIGURE 31 IMPORT OF REGULATING OR CONTROLLING INSTRUMENTS AND APPARATUS, BY KEY COUNTRY, 2015–2022 (USD BILLION)
    5.20 INVESTMENT AND FUNDING SCENARIO 
           FIGURE 32 INVESTMENT AND FUNDING SCENARIO, 2016–2021 (USD MILLION)
 
6 PASSENGER INFORMATION SYSTEM MARKET, BY OFFERING (Page No. - 90)
    6.1 INTRODUCTION 
           FIGURE 33 PIS SERVICES TO GROW AT HIGHER CAGR DURING FORECAST PERIOD
           6.1.1 OFFERING: PASSENGER INFORMATION SYSTEM MARKET DRIVERS
                    TABLE 17 MARKET, BY OFFERING, 2017–2022 (USD MILLION)
                    TABLE 18 MARKET, BY OFFERING, 2023–2028 (USD MILLION)
    6.2 SOLUTIONS 
           FIGURE 34 MOBILE APPLICATIONS SEGMENT TO GROW AT HIGHER CAGR DURING FORECAST PERIOD
           TABLE 19 PASSENGER INFORMATION SYSTEM SOLUTIONS MARKET, BY REGION, 2017–2022 (USD MILLION)
           TABLE 20 PASSENGER INFORMATION SYSTEM SOLUTIONS MARKET, BY REGION, 2023–2028 (USD MILLION)
           TABLE 21 PASSENGER INFORMATION SYSTEM SOLUTIONS MARKET, BY TYPE, 2017–2022 (USD MILLION)
           TABLE 22 PASSENGER INFORMATION SYSTEM SOLUTIONS MARKET, BY TYPE, 2023–2028 (USD MILLION)
           6.2.1 DISPLAY SYSTEMS
                    6.2.1.1 Need to showcase detailed and relational timetables for real-time as well as future information
                               TABLE 23 PASSENGER INFORMATION DISPLAY SYSTEMS MARKET, BY REGION, 2017–2022 (USD MILLION)
                               TABLE 24 PASSENGER INFORMATION DISPLAY SYSTEMS MARKET, BY REGION, 2023–2028 (USD MILLION)
           6.2.2 ANNOUNCEMENT SYSTEMS
                    6.2.2.1 Need to issue pre-recorded audio messages or make live announcements
                               TABLE 25 PASSENGER INFORMATION ANNOUNCEMENT SYSTEMS MARKET, BY REGION, 2017–2022 (USD MILLION)
                               TABLE 26 PASSENGER INFORMATION ANNOUNCEMENT SYSTEMS MARKET, BY REGION, 2023–2028 (USD MILLION)
           6.2.3 EMERGENCY COMMUNICATION SYSTEMS
                    6.2.3.1 Importance of providing safety warnings and helping passengers in case of accidents, attacks, or natural calamities
                               TABLE 27 PASSENGER INFORMATION EMERGENCY COMMUNICATION SYSTEMS MARKET, BY REGION, 2017–2022 (USD MILLION)
                               TABLE 28 PASSENGER INFORMATION EMERGENCY COMMUNICATION SYSTEMS MARKET, BY REGION, 2023–2028 (USD MILLION)
           6.2.4 MOBILE APPLICATIONS
                    6.2.4.1 Access to real-time transit information at required time and place
                               TABLE 29 PASSENGER INFORMATION MOBILE APPLICATIONS MARKET, BY REGION, 2017–2022 (USD MILLION)
                               TABLE 30 PASSENGER INFORMATION MOBILE APPLICATIONS MARKET, BY REGION, 2023–2028 (USD MILLION)
           6.2.5 INFOTAINMENT SYSTEMS
                    6.2.5.1 Need to make trip informative and entertaining to improve passenger travel experience
                               TABLE 31 PASSENGER INFORMATION INFOTAINMENT SYSTEMS MARKET, BY REGION, 2017–2022 (USD MILLION)
                               TABLE 32 PASSENGER INFORMATION INFOTAINMENT SYSTEMS MARKET, BY REGION, 2023–2028 (USD MILLION)
           6.2.6 VIDEO SURVEILLANCE SYSTEM
                    6.2.6.1 Need to identify security vulnerabilities and make informed strategic security plans
                               TABLE 33 PASSENGER INFORMATION VIDEO SURVEILLANCE SYSTEMS MARKET, BY REGION, 2017–2022 (USD MILLION)
                               TABLE 34 PASSENGER INFORMATION VIDEO SURVEILLANCE SYSTEMS MARKET, BY REGION, 2023–2028 (USD MILLION)
           6.2.7 OTHER SOLUTIONS
                    TABLE 35 OTHER PASSENGER INFORMATION SYSTEM SOLUTIONS MARKET, BY REGION, 2017–2022 (USD MILLION)
                    TABLE 36 OTHER PASSENGER INFORMATION SYSTEM SOLUTIONS MARKET, BY REGION, 2023–2028 (USD MILLION)
    6.3 SERVICES 
           FIGURE 35 DEPLOYMENT & INTEGRATION TO GROW AT HIGHER CAGR DURING FORECAST PERIOD
           TABLE 37 PASSENGER INFORMATION SYSTEM SERVICES MARKET, BY REGION, 2017–2022 (USD MILLION)
           TABLE 38 PASSENGER INFORMATION SYSTEM SERVICES MARKET, BY REGION, 2023–2028 (USD MILLION)
           TABLE 39 PASSENGER INFORMATION SYSTEM SERVICES MARKET, BY TYPE, 2017–2022 (USD MILLION)
           TABLE 40 PASSENGER INFORMATION SYSTEM SERVICES MARKET, BY TYPE, 2023–2028 (USD MILLION)
           6.3.1 CONSULTING
                    6.3.1.1 Leveraging technology to suggest, analyze, and guide customers to choose most suitable PIS solutions
                               TABLE 41 PASSENGER INFORMATION SYSTEM CONSULTING SERVICES MARKET, BY REGION, 2017–2022 (USD MILLION)
                               TABLE 42 PASSENGER INFORMATION SYSTEM CONSULTING SERVICES MARKET, BY REGION, 2023–2028 (USD MILLION)
           6.3.2 DEPLOYMENT & INTEGRATION
                    6.3.2.1 Identifying need for upgrade or adoption of PIS solutions and integrate with existing ones
                               TABLE 43 PASSENGER INFORMATION SYSTEM DEPLOYMENT & INTEGRATION SERVICES MARKET, BY REGION, 2017–2022 (USD MILLION)
                               TABLE 44 PASSENGER INFORMATION SYSTEM DEPLOYMENT & INTEGRATION SERVICES MARKET, BY REGION, 2023–2028 (USD MILLION)
           6.3.3 SUPPORT & MAINTENANCE
                    6.3.3.1 Easy upgrading of deployed PIS solutions and resolving product-related issues
                               TABLE 45 PASSENGER INFORMATION SYSTEM SUPPORT & MAINTENANCE SERVICES MARKET, BY REGION, 2017–2022 (USD MILLION)
                               TABLE 46 PASSENGER INFORMATION SYSTEM SUPPORT & MAINTENANCE SERVICES MARKET, BY REGION, 2023–2028 (USD MILLION)
 
7 PASSENGER INFORMATION SYSTEM MARKET, BY LOCATION (Page No. - 108)
    7.1 INTRODUCTION 
           FIGURE 36 IN-STATION PASSENGER INFORMATION SYSTEMS TO GROW AT HIGHER CAGR DURING FORECAST PERIOD
           7.1.1 LOCATION: MARKET DRIVERS
                    TABLE 47 MARKET, BY LOCATION, 2017–2022 (USD MILLION)
                    TABLE 48 MARKET, BY LOCATION, 2023–2028 (USD MILLION)
    7.2 ON-BOARD 
           7.2.1 EQUIPPING PASSENGERS WITH PRECISE ARRIVAL AND DEPARTURE INFORMATION WITH MULTILINGUAL SUPPORT TO ENSURE CLARITY
                    TABLE 49 ON-BOARD MARKET, BY REGION, 2017–2022 (USD MILLION)
                    TABLE 50 ON-BOARD MARKET, BY REGION, 2023–2028 (USD MILLION)
    7.3 IN-STATION 
           7.3.1 OFFERING AUDIO AND VISUAL INFORMATION THROUGH MULTIPLE DISPLAYS ACROSS STATIONS AND AIRPORTS TO ENSURE SMOOTH TRAVEL
                    TABLE 51 IN-STATION MARKET, BY REGION, 2017–2022 (USD MILLION)
                    TABLE 52 IN-STATION MARKET, BY REGION, 2023–2028 (USD MILLION)
 
8 PASSENGER INFORMATION SYSTEM MARKET, BY TRANSPORTATION MODE (Page No. - 113)
    8.1 INTRODUCTION 
           FIGURE 37 ROADWAYS SEGMENT TO GROW AT HIGHER CAGR DURING FORECAST PERIOD
           8.1.1 TRANSPORTATION MODE: MARKET DRIVERS
                    TABLE 53 MARKET, BY TRANSPORTATION MODE, 2017–2022 (USD MILLION)
                    TABLE 54 MARKET, BY TRANSPORTATION MODE, 2023–2028 (USD MILLION)
    8.2 RAILWAYS 
           8.2.1 ENHANCED PIS SOLUTIONS EMPOWERED BY MOBILITY AND BIG DATA ANALYTICS TO PROVIDE REAL-TIME INFORMATION TO COMMUTERS
                    TABLE 55 MARKET IN RAILWAYS, BY REGION, 2017–2022 (USD MILLION)
                    TABLE 56 MARKET IN RAILWAYS, BY REGION, 2023–2028 (USD MILLION)
                    TABLE 57 MARKET IN RAILWAYS, BY RAILWAY MODE, 2017–2022 (USD MILLION)
                    TABLE 58 MARKET IN RAILWAYS, BY RAILWAY MODE, 2023–2028 (USD MILLION)
           8.2.2 TRAINS
                    TABLE 59 PASSENGER INFORMATION SYSTEMS MARKET FOR TRAINS, BY REGION, 2017–2022 (USD MILLION)
                    TABLE 60 PASSENGER INFORMATION SYSTEMS MARKET FOR TRAINS, BY REGION, 2023–2028 (USD MILLION)
           8.2.3 TRAMS
                    TABLE 61 PASSENGER INFORMATION SYSTEMS MARKET FOR TRAMS, BY REGION, 2017–2022 (USD MILLION)
                    TABLE 62 PASSENGER INFORMATION SYSTEMS MARKET FOR TRAMS, BY REGION, 2023–2028 (USD MILLION)
    8.3 ROADWAYS 
           8.3.1 INCREASE IN ADOPTION OF PIS SOLUTIONS IN BUSES FOR RELIABLE AND SAFE OFFERINGS ENSURING SMOOTH TRAFFIC FLOW
                    TABLE 63 MARKET IN ROADWAYS, BY REGION, 2017–2022 (USD MILLION)
                    TABLE 64 MARKET IN ROADWAYS, BY REGION, 2023–2028 (USD MILLION)
    8.4 AIRWAYS & WATERWAYS 
           8.4.1 SURGE IN IMPLEMENTATION OF PIS SOLUTIONS VIA UNIFIED INFORMATION PLATFORMS
                    TABLE 65 MARKET IN AIRWAYS & WATERWAYS, BY REGION, 2017–2022 (USD MILLION)
                    TABLE 66 MARKET IN AIRWAYS & WATERWAYS, BY REGION, 2023–2028 (USD MILLION)
 
9 PASSENGER INFORMATION SYSTEM MARKET, BY REGION (Page No. - 122)
    9.1 INTRODUCTION 
           TABLE 67 MARKET, BY REGION, 2017–2022 (USD MILLION)
           TABLE 68 MARKET, BY REGION, 2023–2028 (USD MILLION)
    9.2 NORTH AMERICA 
           9.2.1 NORTH AMERICA: PASSENGER INFORMATION SYSTEM MARKET DRIVERS
           9.2.2 NORTH AMERICA: RECESSION IMPACT
                    FIGURE 38 NORTH AMERICA: MARKET SNAPSHOT
                    TABLE 69 NORTH AMERICA: MARKET, BY OFFERING, 2017–2022 (USD MILLION)
                    TABLE 70 NORTH AMERICA: MARKET, BY OFFERING, 2023–2028 (USD MILLION)
                    TABLE 71 NORTH AMERICA: MARKET, BY SOLUTION, 2017–2022 (USD MILLION)
                    TABLE 72 NORTH AMERICA: MARKET, BY SOLUTION, 2023–2028 (USD MILLION)
                    TABLE 73 NORTH AMERICA: MARKET, BY SERVICE, 2017–2022 (USD MILLION)
                    TABLE 74 NORTH AMERICA: MARKET, BY SERVICE, 2023–2028 (USD MILLION)
                    TABLE 75 NORTH AMERICA: MARKET, BY LOCATION, 2017–2022 (USD MILLION)
                    TABLE 76 NORTH AMERICA: MARKET, BY LOCATION, 2023–2028 (USD MILLION)
                    TABLE 77 NORTH AMERICA: MARKET, BY TRANSPORTATION MODE, 2017–2022 (USD MILLION)
                    TABLE 78 NORTH AMERICA: MARKET, BY TRANSPORTATION MODE, 2023–2028 (USD MILLION)
                    TABLE 79 NORTH AMERICA: MARKET IN RAILWAYS, BY RAILWAY MODE, 2017–2022 (USD MILLION)
                    TABLE 80 NORTH AMERICA: MARKET IN RAILWAYS, BY RAILWAY MODE, 2023–2028 (USD MILLION)
                    TABLE 81 NORTH AMERICA: MARKET, BY COUNTRY, 2017–2022 (USD MILLION)
                    TABLE 82 NORTH AMERICA: MARKET, BY COUNTRY, 2023–2028 (USD MILLION)
           9.2.3 US
                    9.2.3.1 Rise in demand for improved travel experiences with infrastructure offered by prominent players
                               TABLE 83 US: MARKET, BY OFFERING, 2017–2022 (USD MILLION)
                               TABLE 84 US: MARKET, BY OFFERING, 2023–2028 (USD MILLION)
                               TABLE 85 US: MARKET, BY SOLUTION, 2017–2022 (USD MILLION)
                               TABLE 86 US: MARKET, BY SOLUTION, 2023–2028 (USD MILLION)
                               TABLE 87 US: MARKET, BY SERVICE, 2017–2022 (USD MILLION)
                               TABLE 88 US: MARKET, BY SERVICE, 2023–2028 (USD MILLION)
                               TABLE 89 US: MARKET, BY LOCATION, 2017–2022 (USD MILLION)
                               TABLE 90 US: MARKET, BY LOCATION, 2023–2028 (USD MILLION)
                               TABLE 91 US: MARKET, BY TRANSPORTATION MODE, 2017–2022 (USD MILLION)
                               TABLE 92 US: MARKET, BY TRANSPORTATION MODE, 2023–2028 (USD MILLION)
                               TABLE 93 US: MARKET IN RAILWAYS, BY RAILWAY MODE, 2017–2022 (USD MILLION)
                               TABLE 94 US: MARKET IN RAILWAYS, BY RAILWAY MODE, 2023–2028 (USD MILLION)
           9.2.4 CANADA
                    9.2.4.1 Rise in demand for constant connectivity and entertainment on-the-go
                               TABLE 95 CANADA: MARKET, BY OFFERING, 2017–2022 (USD MILLION)
                               TABLE 96 CANADA: MARKET, BY OFFERING, 2023–2028 (USD MILLION)
                               TABLE 97 CANADA: MARKET, BY SOLUTION, 2017–2022 (USD MILLION)
                               TABLE 98 CANADA: MARKET, BY SOLUTION, 2023–2028 (USD MILLION)
                               TABLE 99 CANADA: MARKET, BY SERVICE, 2017–2022 (USD MILLION)
                               TABLE 100 CANADA: MARKET, BY SERVICE, 2023–2028 (USD MILLION)
                               TABLE 101 CANADA: MARKET, BY LOCATION, 2017–2022 (USD MILLION)
                               TABLE 102 CANADA: MARKET, BY LOCATION, 2023–2028 (USD MILLION)
                               TABLE 103 CANADA: MARKET, BY TRANSPORTATION MODE, 2017–2022 (USD MILLION)
                               TABLE 104 CANADA: MARKET, BY TRANSPORTATION MODE, 2023–2028 (USD MILLION)
                               TABLE 105 CANADA: MARKET IN RAILWAYS, BY RAILWAY MODE, 2017–2022 (USD MILLION)
                               TABLE 106 CANADA: MARKET IN RAILWAYS, BY RAILWAY MODE, 2023–2028 (USD MILLION)
    9.3 EUROPE 
           9.3.1 EUROPE: PASSENGER INFORMATION SYSTEM MARKET DRIVERS
           9.3.2 EUROPE: RECESSION IMPACT
                    TABLE 107 EUROPE: MARKET, BY OFFERING, 2017–2022 (USD MILLION)
                    TABLE 108 EUROPE: MARKET, BY OFFERING, 2023–2028 (USD MILLION)
                    TABLE 109 EUROPE: MARKET, BY SOLUTION, 2017–2022 (USD MILLION)
                    TABLE 110 EUROPE: MARKET, BY SOLUTION, 2023–2028 (USD MILLION)
                    TABLE 111 EUROPE: MARKET, BY SERVICE, 2017–2022 (USD MILLION)
                    TABLE 112 EUROPE: MARKET, BY SERVICE, 2023–2028 (USD MILLION)
                    TABLE 113 EUROPE: MARKET, BY LOCATION, 2017–2022 (USD MILLION)
                    TABLE 114 EUROPE: MARKET, BY LOCATION, 2023–2028 (USD MILLION)
                    TABLE 115 EUROPE: MARKET, BY TRANSPORTATION MODE, 2017–2022 (USD MILLION)
                    TABLE 116 EUROPE: MARKET, BY TRANSPORTATION MODE, 2023–2028 (USD MILLION)
                    TABLE 117 EUROPE: MARKET IN RAILWAYS, BY RAILWAY MODE, 2017–2022 (USD MILLION)
                    TABLE 118 EUROPE: MARKET IN RAILWAYS, BY RAILWAY MODE, 2023–2028 (USD MILLION)
                    TABLE 119 EUROPE: MARKET, BY COUNTRY/REGION, 2017–2022 (USD MILLION)
                    TABLE 120 EUROPE: MARKET, BY COUNTRY/REGION, 2023–2028 (USD MILLION)
           9.3.3 UK
                    9.3.3.1 Increase in number of travelers by train and air to provide opportunities to expand business operations
                               TABLE 121 UK: MARKET, BY OFFERING, 2017–2022 (USD MILLION)
                               TABLE 122 UK: MARKET, BY OFFERING, 2023–2028 (USD MILLION)
                               TABLE 123 UK: MARKET, BY SOLUTION, 2017–2022 (USD MILLION)
                               TABLE 124 UK: MARKET, BY SOLUTION, 2023–2028 (USD MILLION)
                               TABLE 125 UK: MARKET, BY SERVICE, 2017–2022 (USD MILLION)
                               TABLE 126 UK: MARKET, BY SERVICE, 2023–2028 (USD MILLION)
                               TABLE 127 UK: MARKET, BY LOCATION, 2017–2022 (USD MILLION)
                               TABLE 128 UK: MARKET, BY LOCATION, 2023–2028 (USD MILLION)
                               TABLE 129 UK: MARKET, BY TRANSPORTATION MODE, 2017–2022 (USD MILLION)
                               TABLE 130 UK: MARKET, BY TRANSPORTATION MODE, 2023–2028 (USD MILLION)
                               TABLE 131 UK: MARKET IN RAILWAYS, BY RAILWAY MODE, 2017–2022 (USD MILLION)
                               TABLE 132 UK: MARKET IN RAILWAYS, BY RAILWAY MODE, 2023–2028 (USD MILLION)
           9.3.4 GERMANY
                    9.3.4.1 Government investments in infrastructure and leveraging position as tech-forward transportation hub
           9.3.5 FRANCE
                    9.3.5.1 Use of robotics and IoT advancements in dense transportation system
           9.3.6 ITALY
                    9.3.6.1 Focus on real-time information, AI integration, and passenger experience
           9.3.7 SPAIN
                    9.3.7.1 Smart city initiatives and strong high-speed rail network
           9.3.8 NORDIC COUNTRIES
                    9.3.8.1 Cybersecurity, open standards, and data privacy: Emerging trends
           9.3.9 REST OF EUROPE
    9.4 ASIA PACIFIC 
           9.4.1 ASIA PACIFIC: PASSENGER INFORMATION SYSTEM MARKET DRIVERS
           9.4.2 ASIA PACIFIC: RECESSION IMPACT
                    FIGURE 39 ASIA PACIFIC: MARKET SNAPSHOT
                    TABLE 133 ASIA PACIFIC: MARKET, BY OFFERING, 2017–2022 (USD MILLION)
                    TABLE 134 ASIA PACIFIC: MARKET, BY OFFERING, 2023–2028 (USD MILLION)
                    TABLE 135 ASIA PACIFIC: MARKET, BY SOLUTION, 2017–2022 (USD MILLION)
                    TABLE 136 ASIA PACIFIC: MARKET, BY SOLUTION, 2023–2028 (USD MILLION)
                    TABLE 137 ASIA PACIFIC: MARKET, BY SERVICE, 2017–2022 (USD MILLION)
                    TABLE 138 ASIA PACIFIC: MARKET, BY SERVICE, 2023–2028 (USD MILLION)
                    TABLE 139 ASIA PACIFIC: MARKET, BY LOCATION, 2017–2022 (USD MILLION)
                    TABLE 140 ASIA PACIFIC: MARKET, BY LOCATION, 2023–2028 (USD MILLION)
                    TABLE 141 ASIA PACIFIC: MARKET, BY TRANSPORTATION MODE, 2017–2022 (USD MILLION)
                    TABLE 142 ASIA PACIFIC: MARKET, BY TRANSPORTATION MODE, 2023–2028 (USD MILLION)
                    TABLE 143 ASIA PACIFIC: MARKET IN RAILWAYS, BY RAILWAY MODE, 2017–2022 (USD MILLION)
                    TABLE 144 ASIA PACIFIC: MARKET IN RAILWAYS, BY RAILWAY MODE, 2023–2028 (USD MILLION)
                    TABLE 145 ASIA PACIFIC: MARKET, BY COUNTRY, 2017–2022 (USD MILLION)
                    TABLE 146 ASIA PACIFIC: MARKET, BY COUNTRY, 2023–2028 (USD MILLION)
           9.4.3 CHINA
                    9.4.3.1 Increase in investment to develop and improve existing transit services
                               TABLE 147 CHINA: MARKET, BY OFFERING, 2017–2022 (USD MILLION)
                               TABLE 148 CHINA: MARKET, BY OFFERING, 2023–2028 (USD MILLION)
                               TABLE 149 CHINA: MARKET, BY SOLUTION, 2017–2022 (USD MILLION)
                               TABLE 150 CHINA: MARKET, BY SOLUTION, 2023–2028 (USD MILLION)
                               TABLE 151 CHINA: MARKET, BY SERVICE, 2017–2022 (USD MILLION)
                               TABLE 152 CHINA: MARKET, BY SERVICE, 2023–2028 (USD MILLION)
                               TABLE 153 CHINA: MARKET, BY LOCATION, 2017–2022 (USD MILLION)
                               TABLE 154 CHINA: MARKET, BY LOCATION, 2023–2028 (USD MILLION)
                               TABLE 155 CHINA: MARKET, BY TRANSPORTATION MODE, 2017–2022 (USD MILLION)
                               TABLE 156 CHINA: MARKET, BY TRANSPORTATION MODE, 2023–2028 (USD MILLION)
                               TABLE 157 CHINA: MARKET IN RAILWAYS, BY RAILWAY MODE, 2017–2022 (USD MILLION)
                               TABLE 158 CHINA: MARKET IN RAILWAYS, BY RAILWAY MODE, 2023–2028 (USD MILLION)
           9.4.4 JAPAN
                    9.4.4.1 Cultural sensitivity and multi-lingual support for dense urban areas and complex transport systems
           9.4.5 INDIA
                    9.4.5.1 Government mandate aimed at digitalization
           9.4.6 AUSTRALIA & NEW ZEALAND
                    9.4.6.1 Tourism, infrastructure, and connected vehicles: Focus areas for tech integration and expansion
           9.4.7 SOUTH KOREA
                    9.4.7.1 Growing tourism, government support, and AI advancements with promise of personalization and optimization
           9.4.8 REST OF ASIA PACIFIC
    9.5 MIDDLE EAST & AFRICA 
           9.5.1 MIDDLE EAST & AFRICA: PASSENGER INFORMATION SYSTEM MARKET DRIVERS
           9.5.2 MIDDLE EAST & AFRICA: RECESSION IMPACT
                    TABLE 159 MIDDLE EAST & AFRICA: MARKET, BY OFFERING, 2017–2022 (USD MILLION)
                    TABLE 160 MIDDLE EAST & AFRICA: MARKET, BY OFFERING, 2023–2028 (USD MILLION)
                    TABLE 161 MIDDLE EAST & AFRICA: MARKET, BY SOLUTION, 2017–2022 (USD MILLION)
                    TABLE 162 MIDDLE EAST & AFRICA: MARKET, BY SOLUTION, 2023–2028 (USD MILLION)
                    TABLE 163 MIDDLE EAST & AFRICA: MARKET, BY SERVICE, 2017–2022 (USD MILLION)
                    TABLE 164 MIDDLE EAST & AFRICA: MARKET, BY SERVICE, 2023–2028 (USD MILLION)
                    TABLE 165 MIDDLE EAST & AFRICA: MARKET, BY LOCATION, 2017–2022 (USD MILLION)
                    TABLE 166 MIDDLE EAST & AFRICA: MARKET, BY LOCATION, 2023–2028 (USD MILLION)
                    TABLE 167 MIDDLE EAST & AFRICA: MARKET, BY TRANSPORTATION MODE, 2017–2022 (USD MILLION)
                    TABLE 168 MIDDLE EAST & AFRICA: MARKET, BY TRANSPORTATION MODE, 2023–2028 (USD MILLION)
                    TABLE 169 MIDDLE EAST & AFRICA: MARKET IN RAILWAYS, BY RAILWAY MODE, 2017–2022 (USD MILLION)
                    TABLE 170 MIDDLE EAST & AFRICA: MARKET IN RAILWAYS, BY RAILWAY MODE, 2023–2028 (USD MILLION)
                    TABLE 171 MIDDLE EAST & AFRICA: MARKET, BY COUNTRY/REGION, 2017–2022 (USD MILLION)
                    TABLE 172 MIDDLE EAST & AFRICA: MARKET, BY COUNTRY/REGION, 2023–2028 (USD MILLION)
           9.5.3 GCC COUNTRIES
                    TABLE 173 GCC COUNTRIES: MARKET, BY COUNTRY, 2017–2022 (USD MILLION)
                    TABLE 174 GCC COUNTRIES: MARKET, BY COUNTRY, 2023–2028 (USD MILLION)
                    9.5.3.1 UAE
                               9.5.3.1.1 Booming logistics and transport industry
                               TABLE 175 UAE: MARKET, BY OFFERING, 2017–2022 (USD MILLION)
                               TABLE 176 UAE: MARKET, BY OFFERING, 2023–2028 (USD MILLION)
                               TABLE 177 UAE: MARKET, BY SOLUTION, 2017–2022 (USD MILLION)
                               TABLE 178 UAE: MARKET, BY SOLUTION, 2023–2028 (USD MILLION)
                               TABLE 179 UAE: MARKET, BY SERVICE, 2017–2022 (USD MILLION)
                               TABLE 180 UAE: MARKET, BY SERVICE, 2023–2028 (USD MILLION)
                               TABLE 181 UAE: MARKET, BY LOCATION, 2017–2022 (USD MILLION)
                               TABLE 182 UAE: MARKET, BY LOCATION, 2023–2028 (USD MILLION)
                               TABLE 183 UAE: MARKET, BY TRANSPORTATION MODE, 2017–2022 (USD MILLION)
                               TABLE 184 UAE: MARKET, BY TRANSPORTATION MODE, 2023–2028 (USD MILLION)
                               TABLE 185 UAE: MARKET IN RAILWAYS, BY RAILWAY MODE, 2017–2022 (USD MILLION)
                               TABLE 186 UAE: MARKET IN RAILWAYS, BY RAILWAY MODE, 2023–2028 (USD MILLION)
                    9.5.3.2 KSA
                               9.5.3.2.1 Diverse geographical and cultural requirements demand careful tech integration and planning
                    9.5.3.3 Rest of GCC Countries
           9.5.4 SOUTH AFRICA
                    9.5.4.1 Government initiatives to develop intelligent transport system
           9.5.5 REST OF MIDDLE EAST & AFRICA
    9.6 LATIN AMERICA 
           9.6.1 LATIN AMERICA: PASSENGER INFORMATION SYSTEM MARKET DRIVERS
           9.6.2 LATIN AMERICA: RECESSION IMPACT
                    TABLE 187 LATIN AMERICA: MARKET, BY OFFERING, 2017–2022 (USD MILLION)
                    TABLE 188 LATIN AMERICA: MARKET, BY OFFERING, 2023–2028 (USD MILLION)
                    TABLE 189 LATIN AMERICA: MARKET, BY SOLUTION, 2017–2022 (USD MILLION)
                    TABLE 190 LATIN AMERICA: MARKET, BY SOLUTION, 2023–2028 (USD MILLION)
                    TABLE 191 LATIN AMERICA: MARKET, BY SERVICE, 2017–2022 (USD MILLION)
                    TABLE 192 LATIN AMERICA: MARKET, BY SERVICE, 2023–2028 (USD MILLION)
                    TABLE 193 LATIN AMERICA: MARKET, BY LOCATION, 2017–2022 (USD MILLION)
                    TABLE 194 LATIN AMERICA: MARKET, BY LOCATION, 2023–2028 (USD MILLION)
                    TABLE 195 LATIN AMERICA: MARKET, BY TRANSPORTATION MODE, 2017–2022 (USD MILLION)
                    TABLE 196 LATIN AMERICA: MARKET, BY TRANSPORTATION MODE, 2023–2028 (USD MILLION)
                    TABLE 197 LATIN AMERICA: MARKET IN RAILWAYS, BY RAILWAY MODE, 2017–2022 (USD MILLION)
                    TABLE 198 LATIN AMERICA: MARKET IN RAILWAYS, BY RAILWAY MODE, 2023–2028 (USD MILLION)
                    TABLE 199 LATIN AMERICA: MARKET, BY COUNTRY, 2017–2022 (USD MILLION)
                    TABLE 200 LATIN AMERICA: MARKET, BY COUNTRY, 2023–2028 (USD MILLION)
           9.6.3 BRAZIL
                    9.6.3.1 High demand for real-time information regarding transportation scheduling
                               TABLE 201 BRAZIL: MARKET, BY OFFERING, 2017–2022 (USD MILLION)
                               TABLE 202 BRAZIL: MARKET, BY OFFERING, 2023–2028 (USD MILLION)
                               TABLE 203 BRAZIL: MARKET, BY SOLUTION, 2017–2022 (USD MILLION)
                               TABLE 204 BRAZIL: MARKET, BY SOLUTION, 2023–2028 (USD MILLION)
                               TABLE 205 BRAZIL: MARKET, BY SERVICE, 2017–2022 (USD MILLION)
                               TABLE 206 BRAZIL: MARKET, BY SERVICE, 2023–2028 (USD MILLION)
                               TABLE 207 BRAZIL: MARKET, BY LOCATION, 2017–2022 (USD MILLION)
                               TABLE 208 BRAZIL: MARKET, BY LOCATION, 2023–2028 (USD MILLION)
                               TABLE 209 BRAZIL: MARKET, BY TRANSPORTATION MODE, 2017–2022 (USD MILLION)
                               TABLE 210 BRAZIL: MARKET, BY TRANSPORTATION MODE, 2023–2028 (USD MILLION)
                               TABLE 211 BRAZIL: MARKET IN RAILWAYS, BY RAILWAY MODE, 2017–2022 (USD MILLION)
                               TABLE 212 BRAZIL: MARKET IN RAILWAYS, BY RAILWAY MODE, 2023–2028 (USD MILLION)
           9.6.4 MEXICO
                    9.6.4.1 Strategic location adoption for trade recovery and heavy investment by government
           9.6.5 REST OF LATIN AMERICA
 
10 COMPETITIVE LANDSCAPE (Page No. - 180)
     10.1 INTRODUCTION 
     10.2 KEY PLAYER STRATEGIES/RIGHT TO WIN 
             10.2.1 OVERVIEW OF STRATEGIES ADOPTED BY KEY PASSENGER INFORMATION SYSTEM PROVIDERS
     10.3 REVENUE ANALYSIS 
               FIGURE 40 HISTORICAL REVENUE ANALYSIS OF KEY PLAYERS, 2018–2022 (USD MILLION)
     10.4 MARKET SHARE ANALYSIS 
               FIGURE 41 PASSENGER INFORMATION SYSTEM MARKET SHARE ANALYSIS, 2022
               TABLE 213 PASSENGER INFORMATION SYSTEM MARKET: DEGREE OF COMPETITION
             10.4.1 MARKET RANKING ANALYSIS
                       FIGURE 42 MARKET RANKING ANALYSIS OF TOP FIVE PLAYERS
     10.5 COMPANY EVALUATION MATRIX: KEY PLAYERS 
             10.5.1 STARS
             10.5.2 EMERGING LEADERS
             10.5.3 PERVASIVE PLAYERS
             10.5.4 PARTICIPANTS
                       FIGURE 43 COMPANY EVALUATION MATRIX FOR KEY PLAYERS, 2023
             10.5.5 COMPANY FOOTPRINT: KEY PLAYERS
                       FIGURE 44 OVERALL COMPANY FOOTPRINT
                       TABLE 214 OFFERING FOOTPRINT
                       TABLE 215 TRANSPORTATION MODE FOOTPRINT
                       TABLE 216 REGIONAL FOOTPRINT
     10.6 COMPANY EVALUATION MATRIX: STARTUPS/SMES 
             10.6.1 PROGRESSIVE COMPANIES
             10.6.2 RESPONSIVE COMPANIES
             10.6.3 DYNAMIC COMPANIES
             10.6.4 STARTING BLOCKS
                       FIGURE 45 COMPANY EVALUATION MATRIX FOR STARTUPS/SMES, 2023
             10.6.5 COMPETITIVE BENCHMARKING: STARTUPS/SMES
                       TABLE 217 DETAILED LIST OF KEY STARTUPS/SMES, 2023
                       TABLE 218 COMPETITIVE BENCHMARKING OF KEY STARTUPS/SMES
     10.7 COMPETITIVE SCENARIO AND TRENDS 
             10.7.1 PRODUCT LAUNCHES
                       TABLE 219 PASSENGER INFORMATION SYSTEM MARKET: PRODUCT LAUNCHES, JANUARY 2021–JANUARY 2024
             10.7.2 DEALS
                       TABLE 220 MARKET: DEALS, JANUARY 2021–JANUARY 2024
             10.7.3 OTHERS
                       TABLE 221 MARKET: EXPANSIONS, JANUARY 2021–JANUARY 2023
     10.8 BRAND/PRODUCT COMPARISON 
               FIGURE 46 BRAND/PRODUCT COMPARISON
     10.9 COMPANY VALUATION AND FINANCIAL METRICS OF KEY PASSENGER INFORMATION SYSTEM PROVIDERS 
               FIGURE 47 COMPANY VALUATION AND FINANCIAL METRICS OF KEY PASSENGER INFORMATION SYSTEM VENDORS
 
11 COMPANY PROFILES (Page No. - 197)
     11.1 KEY PLAYERS 
(Business Overview, Products/Solutions/Services offered, Recent Developments, MnM View)*
             11.1.1 ADVANTECH CO., LTD.
                       TABLE 222 ADVANTECH CO., LTD.: BUSINESS OVERVIEW
                       FIGURE 48 ADVANTECH CO., LTD.: COMPANY SNAPSHOT
                       TABLE 223 ADVANTECH CO., LTD.: PRODUCTS/SOLUTIONS/SERVICES OFFERED
                       TABLE 224 ADVANTECH CO., LTD.: PRODUCT LAUNCHES & ENHANCEMENTS
                       TABLE 225 ADVANTECH CO., LTD.: DEALS
             11.1.2 ALSTOM SA
                       TABLE 226 ALSTOM SA: BUSINESS OVERVIEW
                       FIGURE 49 ALSTOM SA: COMPANY SNAPSHOT
                       TABLE 227 ALSTOM SA: PRODUCTS/SOLUTIONS/SERVICES OFFERED
                       TABLE 228 ALSTOM SA: PRODUCT LAUNCHES
                       TABLE 229 ALSTOM SA: DEALS
             11.1.3 WABTEC CORPORATION
                       TABLE 230 WABTEC CORPORATION: BUSINESS OVERVIEW
                       FIGURE 50 WABTEC CORPORATION: COMPANY SNAPSHOT
                       TABLE 231 WABTEC CORPORATION: PRODUCTS/SOLUTIONS/SERVICES OFFERED
                       TABLE 232 WABTEC CORPORATION: DEALS
                       TABLE 233 WABTEC CORPORATION: EXPANSIONS
             11.1.4 CISCO SYSTEMS, INC.
                       TABLE 234 CISCO SYSTEMS, INC.: COMPANY OVERVIEW
                       FIGURE 51 CISCO SYSTEMS, INC.: COMPANY SNAPSHOT
                       TABLE 235 CISCO SYSTEMS, INC.: PRODUCTS/SOLUTIONS/SERVICES OFFERED
                       TABLE 236 CISCO SYSTEMS, INC.: DEALS
             11.1.5 SIEMENS AG
                       TABLE 237 SIEMENS AG: BUSINESS OVERVIEW
                       FIGURE 52 SIEMENS AG: COMPANY SNAPSHOT
                       TABLE 238 SIEMENS AG: PRODUCTS/SOLUTIONS/SERVICES OFFERED
                       TABLE 239 SIEMENS AG: PRODUCT LAUNCHES
                       TABLE 240 SIEMENS AG: DEALS
             11.1.6 CUBIC CORPORATION
                       TABLE 241 CUBIC CORPORATION: BUSINESS OVERVIEW
                       TABLE 242 CUBIC CORPORATION: PRODUCTS/SOLUTIONS/SERVICES OFFERED
                       TABLE 243 CUBIC CORPORATION: EXPANSIONS
             11.1.7 TELEVIC
                       TABLE 244 TELEVIC: BUSINESS OVERVIEW
                       TABLE 245 TELEVIC: SOLUTIONS OFFERED
                       TABLE 246 TELEVIC: DEALS
             11.1.8 HUAWEI TECHNOLOGIES CO., LTD.
                       TABLE 247 HUAWEI TECHNOLOGIES CO., LTD.: BUSINESS OVERVIEW
                       FIGURE 53 HUAWEI TECHNOLOGIES CO., LTD.: COMPANY SNAPSHOT
                       TABLE 248 HUAWEI TECHNOLOGIES CO., LTD.: PRODUCTS/SOLUTIONS/SERVICES OFFERED
                       TABLE 249 HUAWEI TECHNOLOGIES CO., LTD.: PRODUCT LAUNCHES
             11.1.9 HITACHI, LTD.
                       TABLE 250 HITACHI, LTD.: BUSINESS OVERVIEW
                       FIGURE 54 HITACHI, LTD.: COMPANY SNAPSHOT
                       TABLE 251 HITACHI, LTD.: PRODUCTS/SOLUTIONS/SERVICES OFFERED
                       TABLE 252 HITACHI, LTD.: PRODUCT LAUNCHES
                       TABLE 253 HITACHI, LTD.: DEALS
             11.1.10 MITSUBISHI ELECTRIC CORPORATION
                                   TABLE 254 MITSUBISHI ELECTRIC CORPORATION: BUSINESS OVERVIEW
                                   FIGURE 55 MITSUBISHI ELECTRIC CORPORATION: COMPANY SNAPSHOT
                                   TABLE 255 MITSUBISHI ELECTRIC CORPORATION: SOLUTIONS OFFERED
                                   TABLE 256 MITSUBISHI ELECTRIC CORPORATION: DEALS
             11.1.11 ST ENGINEERING
             11.1.12 INDRA
             11.1.13 MEDHA SERVO DRIVES
*Details on Business Overview, Products/Solutions/Services offered, Recent Developments, MnM View might not be captured in case of unlisted companies.
     11.2 STARTUP/SMES 
             11.2.1 EFFTRONICS
             11.2.2 DYSTEN
             11.2.3 LUNETTA
             11.2.4 R2P
             11.2.5 ICON MULTIMEDIA
             11.2.6 PASSIO TECHNOLOGIES
             11.2.7 TELESTE
             11.2.8 LANCOM D.O.O.
             11.2.9 SIMPLEWAY
             11.2.10 EKE-ELECTRONICS
             11.2.11 QUESTER TANGENT
             11.2.12 LOT GROUP
 
12 ADJACENT/RELATED MARKETS (Page No. - 245)
     12.1 INTRODUCTION 
     12.2 FLEET MANAGEMENT MARKET 
             12.2.1 MARKET DEFINITION
             12.2.2 MARKET OVERVIEW
             12.2.3 FLEET MANAGEMENT MARKET, BY COMPONENT
                       TABLE 257 FLEET MANAGEMENT MARKET, BY COMPONENT, 2018–2022 (USD MILLION)
                       TABLE 258 FLEET MANAGEMENT MARKET, BY COMPONENT, 2023–2028 (USD MILLION)
                       TABLE 259 FLEET MANAGEMENT MARKET, BY SOLUTION, 2018–2022 (USD MILLION)
                       TABLE 260 FLEET MANAGEMENT MARKET, BY SOLUTION, 2023–2028 (USD MILLION)
                       TABLE 261 FLEET MANAGEMENT MARKET, BY SERVICE, 2018–2022 (USD MILLION)
                       TABLE 262 FLEET MANAGEMENT MARKET, BY SERVICE, 2023–2028 (USD MILLION)
                       TABLE 263 FLEET MANAGEMENT MARKET, BY PROFESSIONAL SERVICE, 2018–2022 (USD MILLION)
                       TABLE 264 FLEET MANAGEMENT MARKET, BY PROFESSIONAL SERVICE, 2023–2028 (USD MILLION)
             12.2.4 FLEET MANAGEMENT MARKET, BY FLEET TYPE
                       TABLE 265 FLEET MANAGEMENT MARKET, BY FLEET TYPE, 2018–2022 (USD MILLION)
                       TABLE 266 FLEET MANAGEMENT MARKET, BY FLEET TYPE, 2023–2028 (USD MILLION)
             12.2.5 FLEET MANAGEMENT MARKET, BY VERTICAL
                       TABLE 267 FLEET MANAGEMENT MARKET, BY VERTICAL, 2018–2022 (USD MILLION)
                       TABLE 268 FLEET MANAGEMENT MARKET, BY VERTICAL, 2023–2028 (USD MILLION)
     12.3 SMART TRANSPORTATION MARKET 
             12.3.1 MARKET DEFINITION
             12.3.2 MARKET OVERVIEW
             12.3.3 SMART TRANSPORTATION MARKET, BY TRANSPORTATION MODE
                       TABLE 269 SMART TRANSPORTATION MARKET, BY TRANSPORTATION MODE, 2018–2022 (USD MILLION)
                       TABLE 270 SMART TRANSPORTATION MARKET, BY TRANSPORTATION MODE, 2023–2028 (USD MILLION)
             12.3.4 SMART TRANSPORTATION MARKET, BY ROADWAY
                       TABLE 271 SMART TRANSPORTATION MARKET, BY SOLUTION IN ROADWAYS, 2018–2022 (USD MILLION)
                       TABLE 272 SMART TRANSPORTATION MARKET, BY SOLUTION IN ROADWAYS, 2023–2028 (USD MILLION)
             12.3.5 SMART TRANSPORTATION MARKET, BY RAILWAY
                       TABLE 273 SMART TRANSPORTATION MARKET, BY SOLUTION IN RAILWAYS, 2018–2022 (USD MILLION)
                       TABLE 274 SMART TRANSPORTATION MARKET, BY SOLUTION IN RAILWAYS, 2023–2028 (USD MILLION)
             12.3.6 SMART TRANSPORTATION MARKET, BY AIRWAY
                       TABLE 275 SMART TRANSPORTATION MARKET, BY SOLUTION IN AIRWAYS, 2018–2022 (USD MILLION)
                       TABLE 276 SMART TRANSPORTATION MARKET, BY SOLUTION IN AIRWAYS, 2023–2028 (USD MILLION)
             12.3.7 SMART TRANSPORTATION MARKET, BY MARITIME
                       TABLE 277 SMART TRANSPORTATION MARKET, BY SOLUTION IN MARITIME, 2018–2022 (USD MILLION)
                       TABLE 278 SMART TRANSPORTATION MARKET, BY SOLUTION IN MARITIME, 2023–2028 (USD MILLION)
 
13 APPENDIX (Page No. - 255)
     13.1 DISCUSSION GUIDE 
     13.2 KNOWLEDGESTORE: MARKETSANDMARKETS’ SUBSCRIPTION PORTAL 
     13.3 CUSTOMIZATION OPTIONS 
     13.4 RELATED REPORTS 
     13.5 AUTHOR DETAILS 

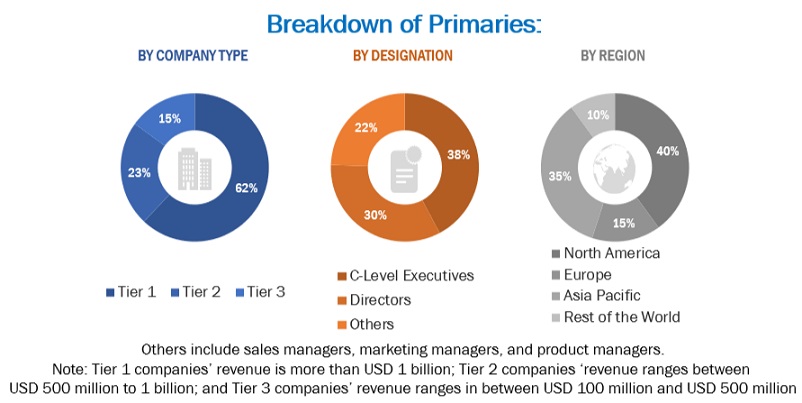
This research study involved the extensive use of secondary sources, directories, and databases, such as Dun & Bradstreet (D&B) Hoovers and Bloomberg BusinessWeek, to identify and collect information useful for a technical, market-oriented, and commercial study of the passenger information system market. The primary sources have been mainly industry experts from the core and related industries and preferred suppliers, manufacturers, distributors, service providers, technology developers, alliances, and organizations related to all segments of the value chain of this market. In-depth interviews have been conducted with various primary respondents, including key industry participants, subject matter experts, C-level executives of key market players, and industry consultants to obtain and verify critical qualitative and quantitative information.

Secondary Research

The market for companies offering passenger information system solutions and services to different verticals has been estimated and projected based on the secondary data made available through paid and unpaid sources, as well as by analyzing their product portfolios in the ecosystem of the passenger information system market. It also involved rating company products based on their performance and quality. In the secondary research process, various sources such as Passenger Terminal EXPO 2023, APTA TRANSform Conference & EXPO 2023, International Conference on Information Systems (ICIS) have been referred to for identifying and collecting information for this study on the passenger information system market. The secondary sources included annual reports, press releases investor presentations of companies, white papers, journals, and certified publications and articles by recognized authors, directories, and databases. Secondary research has been mainly used to obtain key information about the supply chain of the market, the total pool of key players, market classification, segmentation according to industry trends to the bottommost level, regional markets, and key developments from both market- and technology-oriented perspectives that have been further validated by primary sources.

Primary Research

In the primary research process, various primary sources from both the supply and demand sides were interviewed to obtain qualitative and quantitative information on the market. The primary sources from the supply side included various industry experts, including Chief Experience Officers (CXOs); Vice Presidents (VPs); directors from business development, marketing, and product development/innovation teams; related key executives from passenger information system solution vendors, SIs, professional service providers, and industry associations; and key opinion leaders. Primary interviews were conducted to gather insights, such as market statistics, revenue data collected from solutions and services, market breakups, market size estimations, market forecasts, and data triangulation. Primary research also helped understand various trends related to technologies, applications, deployments, and regions. Stakeholders from the demand side, such as Chief Information Officers (CIOs), Chief Technology Officers (CTOs), Chief Strategy Officers (CSOs), and end users using passenger information system solutions, were interviewed to understand the buyer’s perspective on suppliers, products, service providers, and their current usage of passenger information system solutions which would impact the overall passenger information system market.
Passenger Information System  Market Size, and Share

To know about the assumptions considered for the study, download the pdf brochure

Market Size Estimation

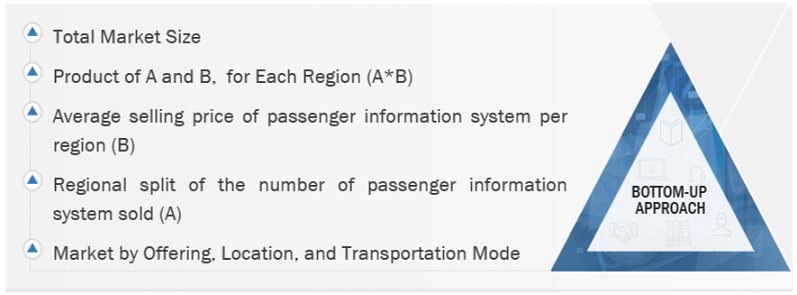
Multiple approaches were adopted to estimate and forecast the size of the passenger information system market. The first approach involves estimating market size by summing up the revenue generated by companies through the sale of passenger information system offerings.

Both top-down and bottom-up approaches were used to estimate and validate the total size of the passenger information system market. These methods were extensively used to estimate the size of various segments in the market. The research methodology used to estimate the market size includes the following:

  • Key players in the market have been identified through extensive secondary research.
  • In terms of value, the industry’s supply chain and market size have been determined through primary and secondary research processes.
  • All percentage shares, splits, and breakups have been determined using secondary sources and verified through primary sources.

Passenger information system Market Size: Bottom-Up Approach
Passenger Information System  Market Bottom Up Approach

To know about the assumptions considered for the study, Request for Free Sample Report

Passenger information system Market Size: Top-Down Approach

Passenger Information System  Market Top Down Approach

Data Triangulation

After arriving at the overall market size, the passenger information system market was divided into several segments and subsegments. A data triangulation procedure was used to complete the overall market engineering process and arrive at the exact statistics for all segments and subsegments, wherever applicable. The data was triangulated by studying various factors and trends from the demand and supply sides. Along with data triangulation and market breakdown, the market size was validated by the top-down and bottom-up approaches.

Market Definition

As per Indra, passenger information system (PIS) is responsible for automatically providing visual and audio information to passengers at stations and transfer facilities, or by programming manually. It includes information management on routes and their display via different display elements deployed at passenger platforms.

The passenger information system (PIS) is an automated system used to offer information about the nature and state of the public transport services to the users of public transport systems. It is an operating tool responsible for providing audio and visual information to passengers at stations and transfer facilities at any time, thereby enhancing the rider's comfort and optimizing the communication between drivers, passengers, operations centers, and maintenance crews. The information such systems provide can be static/scheduled or real-time information, which changes continuously because of real-world events. The PIS comprises many subsystems, such as train communication, backbone network, radio, video surveillance, public address, passenger emergency telephony, multichannel voice recorder, and real-time display.

Key Stakeholders

  • Transportation Service Providers
  • PIS Software providers
  • Hardware Component Providers
  • Networking and Communication Service Providers
  • System Integrators
  • Professional Service Providers
  • Public Transportation Service Providers
  • Transport Operations Management Solution Vendors
  • Transportation Technology Solution Providers
  • Infrastructure Device Suppliers
  • Transportation Research Authorities
  • Mobile Application Developers
  • Consultancy Firms/Advisory Firms
  • Investors and Venture Capitalists
  • Independent Software Vendors
  • Value-added resellers (VARs) and Distributers
  • Governments and Urban Planning Agencies
  • Rail Infrastructure Suppliers
  • Railway Management Companies (private/public)
  • Shipping Operators
  • Airport Authorities
  • Airport Technology Vendors
  • Transport Operators
  • Transport Infrastructure Planners

Report Objectives

  • To determine, segment, and forecast the passenger information system market based on offering (solution and services), location, transportation mode, and region in terms of value
  • To forecast the size of the market segments with respect to 5 main regions: North America, Europe, Asia Pacific, Middle East & Africa, and Latin America
  • To provide detailed information about the major factors (drivers, restraints, opportunities, and challenges) influencing the growth of the market
  • To study the complete value chain and related industry segments and perform a value chain analysis of the market landscape
  • To strategically analyze the macro and micro markets with respect to individual growth trends, prospects, and contributions to the total market
  • To analyze the industry trends, pricing data, patents, and innovations related to the market
  • To analyze the opportunities for stakeholders by identifying the high-growth segments of the market
  • To profile the key players in the market and comprehensively analyze their market share/ranking and core competencies
  • To track and analyze competitive developments, such as mergers & acquisitions, product launches & developments, partnerships, agreements, collaborations, business expansions, and R&D activities

Available Customizations

With the given market data, MarketsandMarkets offers customizations as per the company’s specific needs. The following customization options are available for the report:

Country-wise information

  • Analysis for additional countries (up to five)

Company Information

  • Detailed analysis and profiling of additional market players (up to 5)

Geographic Analysis

  • Further breakup of the Asia Pacific market into countries contributing 75% to the regional market size
  • Further breakup of the North American market into countries contributing 75% to the regional market size
  • Further breakup of the Latin American market into countries contributing 75% to the regional market size
  • Further breakup of the Middle East & Africa market into countries contributing 75% to the regional market size
  • Further breakup of the European market into countries contributing 75% to the regional market size
Custom Market Research Services

We will customize the research for you, in case the report listed above does not meet with your exact requirements. Our custom research will comprehensively cover the business information you require to help you arrive at strategic and profitable business decisions.

Request Customization

Instant Answers with GPT - Ask Now!

Ask real questions. Get complete answers !
Report Code
TC 2279
Published ON
Mar, 2024
Choose License Type
BUY NOW
  • SHARE
X
Request Customization
Speak to Analyst
Speak to Analyst
OR FACE-TO-FACE MEETING
PERSONALIZE THIS RESEARCH
  • Triangulate with your Own Data
  • Get Data as per your Format and Definition
  • Gain a Deeper Dive on a Specific Application, Geography, Customer or Competitor
  • Any level of Personalization
REQUEST A FREE CUSTOMIZATION
LET US HELP YOU!
  • What are the Known and Unknown Adjacencies Impacting the Passenger Informatio
  • What will your New Revenue Sources be?
  • Who will be your Top Customer; what will make them switch?
  • Defend your Market Share or Win Competitors
  • Get a Scorecard for Target Partners
CUSTOMIZED WORKSHOP REQUEST
  • Call Us
  • +1-888-600-6441 (Corporate office hours)
  • +1-888-600-6441 (US/Can toll free)
  • +44-800-368-9399 (UK office hours)
CONNECT WITH US
ABOUT TRUST ONLINE
©2024 MarketsandMarkets Research Private Ltd. All rights reserved
DMCA.com Protection Status Website Feedback