Smart Greenhouse Market by Type (Hydroponics and Non-Hydroponics), Covering Material Type (Polyethylene, Polycarbonate, and Others), Offering (Hardware and Software & Services), Component, Cultivation, End User, Region - Global Forecast to 2036


Smart Greenhouse Market Summary
The global Smart Greenhouse Market was valued at approximately USD 2-3 billion in 2025 and is projected to reach USD 6-8 billion by 2036, expanding at a CAGR of 11%-13% during the forecast period. The market is gaining significant momentum due to the rising demand for sustainable agriculture, increasing food security concerns, and the need to optimize crop yield with minimal resource utilization. Smart greenhouses leverage advanced technologies such as artificial intelligence (AI), Internet of Things (IoT), automation systems, and data analytics to create controlled environments that enhance crop productivity and reduce dependency on external climatic conditions. As climate change continues to impact traditional farming, the shift toward precision agriculture and digital farming ecosystems is accelerating the adoption of smart greenhouse solutions globally.
Key Market Trends & Insights
The Smart Greenhouse Market is witnessing strong growth led by North America, which dominates due to early adoption of precision agriculture and advanced infrastructure. Asia Pacific is emerging as the fastest-growing region, supported by rapid population growth, increasing food demand, and government initiatives promoting smart farming. Hardware components, including sensors and climate control systems, currently dominate the market due to their essential role in greenhouse operations. However, software platforms powered by AI and cloud computing are gaining traction, enabling predictive analytics and real-time monitoring.
Another major trend is the integration of automation technologies such as robotic harvesting and irrigation systems, reducing manual labor and enhancing operational efficiency. The use of AI-driven crop monitoring systems is transforming decision-making processes, allowing farmers to optimize water usage, nutrient supply, and pest control. Additionally, vertical farming and hydroponics integrated with smart greenhouse systems are emerging as key innovations shaping the future of agriculture.
Market Size & Forecast
- Base Year Market Size (2025): USD 2-3 Billion
- Forecast Value (2036): USD 6-8 Billion
- CAGR (2025–2036): 11%-13%
- Growth Drivers: Increasing adoption of AI and IoT in agriculture, rising demand for high-yield crops, water conservation needs, and automation in farming
Smart Greenhouse Market Top 10 key takeaway
- Smart greenhouse adoption is accelerating due to climate change challenges
- AI and IoT technologies are transforming modern agriculture practices
- North America leads due to advanced farming infrastructure
- Asia Pacific is the fastest-growing regional market
- Hardware components dominate, but software is rapidly growing
- Automation reduces labor dependency and operational costs
- Hydroponics and vertical farming are emerging trends
- Government support is boosting smart agriculture adoption
- Data-driven farming improves yield and resource efficiency
- Sustainability and food security are major growth drivers
Product Insights
The hardware segment dominates the Smart Greenhouse Market, particularly climate control systems, sensors, and irrigation systems. These components are fundamental in maintaining optimal growing conditions, including temperature, humidity, light, and soil moisture. Sensors play a crucial role in collecting real-time data, enabling precise monitoring and control of environmental variables. Climate control systems, including heating, ventilation, and air conditioning (HVAC), ensure consistent conditions that are critical for crop growth.
However, the software segment is rapidly gaining traction, driven by the increasing adoption of AI-powered analytics platforms. These platforms enable predictive insights, helping farmers anticipate crop needs, detect diseases early, and optimize resource usage. Emerging product categories include fully automated greenhouse systems equipped with robotics for planting, harvesting, and packaging. These systems are particularly popular in regions facing labor shortages.
The integration of AI with hardware components is enhancing system intelligence, allowing for autonomous decision-making. For instance, AI-driven irrigation systems can adjust water supply based on real-time soil moisture data, reducing water wastage and improving crop health.
Technology / Component Insights
The Smart Greenhouse Market is heavily influenced by technological advancements, particularly in AI, IoT, cloud computing, and automation. IoT devices, including sensors and actuators, form the backbone of smart greenhouse systems by enabling continuous data collection and communication between components. These devices provide real-time insights into environmental conditions, allowing for precise control of greenhouse operations.
Artificial intelligence plays a transformative role by analyzing large volumes of data to generate actionable insights. AI algorithms can predict weather patterns, optimize irrigation schedules, and detect plant diseases at an early stage. Cloud computing further enhances these capabilities by enabling remote monitoring and centralized data management, making it easier for farmers to manage multiple greenhouse facilities.
Automation technologies, including robotic systems and automated irrigation, are reducing the need for manual intervention and improving efficiency. The adoption of digital twins is also emerging as a key trend, allowing farmers to simulate greenhouse environments and optimize operations before implementation. Looking ahead, the integration of edge computing and 5G connectivity is expected to further enhance system responsiveness and scalability.
Application Insights
Commercial farming remains the leading application segment in the Smart Greenhouse Market, driven by the need for high productivity and consistent crop quality. Large-scale greenhouse operators are increasingly adopting smart technologies to optimize yield and reduce operational costs. The growing demand for organic and pesticide-free produce is also encouraging the use of controlled environment agriculture.
Research and educational institutions represent another significant application area, utilizing smart greenhouses for experimental farming and agricultural research. Retail gardens and urban farming initiatives are also gaining popularity, particularly in densely populated cities where space constraints limit traditional farming.
Future opportunities lie in the expansion of smart greenhouses into emerging markets, where food security concerns and population growth are driving demand for efficient agricultural solutions. The integration of AI and automation in these applications is expected to further enhance productivity and sustainability.
Regional Insights
North America holds the largest share of the Smart Greenhouse Market, supported by advanced agricultural practices, high adoption of technology, and strong investment in research and development. The United States, in particular, is a major contributor, with widespread use of precision farming techniques and smart greenhouse systems.
Europe is also a significant market, driven by stringent environmental regulations and a strong focus on sustainable agriculture. Countries such as the Netherlands and Germany are leading in greenhouse technology innovation. Asia Pacific is expected to witness the fastest growth, fueled by rapid urbanization, increasing food demand, and government initiatives promoting smart farming. China and Japan are at the forefront of this growth, investing heavily in agricultural technology.
- North America leads due to advanced infrastructure and technology adoption
- Europe focuses on sustainability and environmental regulations
- Asia Pacific is the fastest-growing region
- Government initiatives support smart farming adoption
- Increasing food demand drives market expansion globally
Country-Specific Market Trends
In Asia Pacific, China is experiencing rapid growth with a CAGR of around 12.5%, driven by government support and large-scale agricultural projects. Japan, with a CAGR of 10.8%, is focusing on high-tech farming solutions due to limited arable land. In North America, the United States leads with a CAGR of 10.5%, supported by strong technological infrastructure, while Canada and Mexico are witnessing steady growth due to increasing adoption of smart farming practices.
In Europe, Germany is leading with a CAGR of 9.8%, driven by industrial innovation and sustainability goals, while France is also expanding its smart greenhouse capabilities to improve agricultural efficiency.
- China leads APAC with strong government support
- Japan focuses on high-tech farming due to land constraints
- United States dominates North America market
- Germany leads Europe with innovation and sustainability focus
- France is expanding smart agriculture initiatives
Key Smart Greenhouse Company Insights
The Smart Greenhouse Market is characterized by the presence of several global players focusing on innovation and technological advancements. Companies are investing heavily in AI-powered solutions, IoT-enabled systems, and automation technologies to enhance greenhouse efficiency and productivity. Strategic collaborations, mergers, and acquisitions are common, enabling companies to expand their product portfolios and market reach.
Key players include Netafim Ltd., Heliospectra AB, Argus Control Systems Ltd., Priva Holding BV, LumiGrow Inc., Rough Brothers Inc., Certhon, and Richel Group. These companies are focusing on developing integrated solutions that combine hardware, software, and services to provide end-to-end smart greenhouse systems.
- Companies focus on AI-driven and IoT-enabled solutions
- Strategic partnerships enhance market presence
- R&D investment drives innovation
- Integrated solutions are gaining popularity
- Automation is a key competitive differentiator
Recent Developments
The Smart Greenhouse Market has witnessed several notable developments in recent years. Companies have introduced AI-powered crop monitoring systems capable of detecting plant diseases with high accuracy. Partnerships between greenhouse technology providers and cloud computing companies have enabled the development of advanced data analytics platforms.
Additionally, new product launches include fully automated greenhouse systems equipped with robotic harvesting and precision irrigation technologies. These innovations are aimed at improving efficiency, reducing costs, and enhancing crop yield, thereby driving market growth.
Market Segmentation
The Smart Greenhouse Market is segmented based on product, technology/component, application, and region. By product, the market includes hardware (sensors, climate control systems, irrigation systems) and software (analytics platforms, control systems). In terms of technology, the market encompasses AI, IoT, cloud computing, and automation technologies. Applications include commercial farming, research institutions, and urban farming. Regionally, the market is divided into North America, Europe, Asia Pacific, and the rest of the world.
- Hardware and software form key product segments
- AI, IoT, and automation drive technological segmentation
- Applications include commercial and research farming
- Regional segmentation highlights global demand patterns
- Integrated solutions dominate across segments
The Smart Greenhouse Market is set to experience significant growth through 2036, driven by advancements in AI, IoT, and automation technologies. As global food demand continues to rise and climate challenges intensify, smart greenhouse solutions will play a critical role in ensuring sustainable and efficient agricultural practices.
The integration of intelligent systems, real-time analytics, and automated processes will enable farmers to optimize resource utilization and maximize crop yield. Businesses investing in smart greenhouse technologies are likely to gain a competitive advantage, as these systems become increasingly essential in modern agriculture. The market’s strong growth trajectory underscores its strategic importance in addressing global food security and sustainability challenges.
FAQs
1. What is the current size of the Smart Greenhouse Market?
The market size is approximately USD 2.1 billion in 2025.
2. What is the expected growth rate of the market?
The market is expected to grow at a CAGR of 11.2% from 2025 to 2036.
3. What are the key drivers of the market?
Key drivers include AI and IoT adoption, automation in agriculture, and increasing food demand.
4. Which region leads the Smart Greenhouse Market?
North America currently leads the market.
5. Who are the major players in the market?
Major companies include Netafim Ltd., Heliospectra AB, and Priva Holding BV
 Exclusive indicates content/data unique to MarketsandMarkets and not available with any competitors.
TABLE OF CONTENTS
1 INTRODUCTION (Page No. - 16)
1.1 STUDY OBJECTIVES
1.2 DEFINITION
1.2.1 INCLUSIONS AND EXCLUSIONS
1.3 STUDY SCOPE
1.3.1 MARKETS COVERED
1.3.2 GEOGRAPHIC SCOPE
1.3.3 YEARS CONSIDERED
1.4 CURRENCY
1.5 STAKEHOLDERS
2 RESEARCH METHODOLOGY (Page No. - 20)
2.1 RESEARCH DATA
2.1.1 SECONDARY DATA
2.1.1.1 Key data from secondary sources
2.1.2 PRIMARY DATA
2.1.2.1 Breakdown of primaries
2.1.2.2 Key data from primary sources
2.1.3 SECONDARY AND PRIMARY RESEARCH
2.2 MARKET SIZE ESTIMATION
2.2.1 BOTTOM-UP APPROACH
2.2.1.1 Approach used to arrive at market size using bottom-up analysis (demand side)
2.2.1.2 Approach for obtaining company-specific information in smart greenhouse value chain
2.2.2 TOP-DOWN APPROACH
2.2.2.1 Approach used to arrive at market size using top-down analysis (supply side)
2.3 MARKET BREAKDOWN AND DATA TRIANGULATION
2.4 RESEARCH ASSUMPTIONS
3 EXECUTIVE SUMMARY (Page No. - 31)
4 PREMIUM INSIGHTS (Page No. - 35)
4.1 ATTRACTIVE GROWTH OPPORTUNITIES IN SMART GREENHOUSE MARKET
4.2 SMART GREENHOUSE MARKET, BY TYPE
4.3 SMART GREENHOUSE MARKET IN APAC, BY END USER AND COUNTRY
4.4 SMART GREENHOUSE MARKET IN NORTH AMERICA, BY COVERING MATERIAL TYPE
4.5 SMART GREENHOUSE MARKET, BY REGION
5 MARKET OVERVIEW (Page No. - 38)
5.1 INTRODUCTION
5.2 MARKET DYNAMICS
5.2.1 DRIVERS
5.2.1.1 Increasing adoption of IoT and AI by farmers and agriculturists
5.2.1.2 Growing demand for food owing to continuously increasing global population
5.2.1.3 Rising number of government initiatives to promote adoption of smart agricultural practices
5.2.1.4 Increasing adoption of indoor farming in urban areas
5.2.2 RESTRAINTS
5.2.2.1 High investment costs owing to deployment of expensive systems in smart greenhouses
5.2.3 OPPORTUNITIES
5.2.3.1 Rising global adoption of vertical farming technology
5.2.3.2 Emerging trend of rooftop farming in urban areas
5.2.4 CHALLENGES
5.2.4.1 Absence of industry standards for managing farm data
5.2.4.2 Integration of different components and technologies used in smart greenhouses
5.3 VALUE CHAIN ANALYSIS
5.4 IMPACT OF COVID-19 ON SMART GREENHOUSE MARKET
6 SMART GREENHOUSE MARKET, BY TYPE (Page No. - 46)
6.1 INTRODUCTION
6.2 HYDROPONICS
6.2.1 HYDROPONICS SEGMENT TO ACCOUNT FOR LARGE SIZE OF SMART GREENHOUSE MARKET FROM 2020 TO 2025
6.3 NON-HYDROPONICS
6.3.1 EUROPE TO HOLD LARGE SIZE OF NON-HYDROPONICS SMART GREENHOUSE MARKET FROM 2020 TO 2025
7 SMART GREENHOUSE MARKET, BY COVERING MATERIAL TYPE (Page No. - 49)
7.1 INTRODUCTION
7.2 POLYETHYLENE
7.2.1 POLYETHYLENE SEGMENT OF SMART GREENHOUSE MARKET EXPECTED TO GROW AT HIGHEST CAGR FROM 2020 TO 2025
7.3 POLYCARBONATE
7.3.1 USE OF POLYCARBONATE OFFERS EXCELLENT INSULATION, DURABILITY, AND FLEXIBILITY TO SMART GREENHOUSES
7.4 OTHERS
7.4.1 EUROPE TO ACCOUNT FOR LARGEST SIZE OF SMART GREENHOUSE MARKET FROM 2020 TO 2025
8 SMART GREENHOUSE MARKET, BY OFFERING (Page No. - 52)
8.1 INTRODUCTION
8.2 HARDWARE
8.2.1 HARDWARE SEGMENT ACCOUNTED FOR LARGE SIZE OF SMART GREENHOUSE MARKET IN 2019
8.3 SOFTWARE & SERVICES
8.3.1 SOFTWARE & SERVICES SEGMENT OF SMART GREENHOUSE MARKET TO GROW AT HIGH CAGR FROM 2020 TO 2025
9 SMART GREENHOUSE MARKET, BY COMPONENT (Page No. - 56)
9.1 INTRODUCTION
9.2 HVAC SYSTEMS
9.2.1 HVAC SYSTEMS PROVIDE AN IMPROVED INDOOR ENVIRONMENT IN SMART GREENHOUSES
9.3 LED GROW LIGHTS
9.3.1 INCREASED ADOPTION OF LED GROW LIGHTS IN SMART GREENHOUSES FOR ENHANCED OPERATIONAL EFFICIENCY AND REDUCED ENERGY CONSUMPTION
9.4 CONTROL SYSTEMS & SENSORS
9.4.1 SENSORS PROVIDE QUANTITATIVE INFORMATION TO GUIDE CULTIVATORS AND ENABLE AUTOMATED DECISION-MAKING RELATED TO CROP CULTIVATION
10 CROPS CULTIVATED IN SMART GREENHOUSES (Page No. - 60)
10.1 INTRODUCTION
10.2 VEGETABLES
10.2.1 VEGETABLES GROWN USING HYDROPONICS TECHNIQUE WITNESS FAST GROWTH THAN VEGETABLES GROWN THROUGH TRADITIONAL FARMING
10.3 FRUITS
10.3.1 FRUITS CAN BE HARVESTED THROUGHOUT YEAR IN SMART GREENHOUSES
10.4 FLOWERS
10.4.1 SMART GREENHOUSES ENABLE FLOWER GROWERS TO HAVE COMPLETE CONTROL OVER NUTRIENT FLOW TO PLANTS
11 SMART GREENHOUSE MARKET, BY END USER (Page No. - 62)
11.1 INTRODUCTION
11.2 COMMERCIAL GROWERS
11.2.1 COMMERCIAL GROWERS SEGMENT OF SMART GREENHOUSE MARKET PROJECTED TO GROW AT HIGHEST CAGR FROM 2020 TO 2025
11.3 RESEARCH & EDUCATIONAL INSTITUTES
11.3.1 RESEARCH & EDUCATIONAL INSTITUTES SEGMENT ACCOUNTED FOR LARGEST SIZE OF SMART GREENHOUSE MARKET IN 2019
11.4 RETAIL GARDENS
11.4.1 EUROPE ACCOUNTED FOR LARGEST SIZE OF SMART GREENHOUSE MARKET FOR RETAIL GARDENS IN 2019
11.5 OTHERS
11.5.1 SMART GREENHOUSES ENABLE GROWTH OF DIFFERENT ALGAE STRAINS USED IN BIOTECHNOLOGY INDUSTRY
12 GEOGRAPHIC ANALYSIS (Page No. - 66)
12.1 INTRODUCTION
12.2 NORTH AMERICA
12.2.1 US
12.2.1.1 US to account for largest size of smart greenhouse market in North America from 2020 to 2025
12.2.2 CANADA
12.2.2.1 Increase in government initiatives and support for automation of greenhouses to fuel growth of greenhouse market in Canada
12.2.3 MEXICO
12.2.3.1 Favorable climate of Mexico promoting adoption of smart greenhouses in country
12.3 EUROPE
12.3.1 NETHERLANDS
12.3.1.1 Netherlands to lead smart greenhouse market in Europe from 2020 to 2025
12.3.2 SPAIN
12.3.2.1 Poor quality of soil to lead to increased establishment of smart greenhouses in Spain
12.3.3 ITALY
12.3.3.1 Increased adoption of smart greenhouses in Italy post-2014–15 drought
12.3.4 GERMANY
12.3.4.1 Cold winters and strong R&D base expected to drive adoption of smart greenhouses in Germany
12.3.5 UK
12.3.5.1 Transformation in smart agriculture landscape of UK to lead to growth of smart greenhouse market in country
12.3.6 REST OF EUROPE
12.4 APAC
12.4.1 CHINA
12.4.1.1 Continuously increasing population in China leading to rise in adoption of smart greenhouses in country
12.4.2 JAPAN
12.4.2.1 Rise in urban farming practices to increase growth of smart greenhouse market in Japan
12.4.3 AUSTRALIA
12.4.3.1 less rainfall and legalization of cannabis to fuel growth of smart greenhouse market in Australia
12.4.4 REST OF APAC
12.5 ROW
12.6 MIDDLE EAST AND AFRICA
12.6.1 MIDDLE EAST AND AFRICA TO LEAD SMART GREENHOUSE MARKET FROM 2020 TO 2025
12.7 SOUTH AMERICA
12.7.1 EXTREME WEATHER CONDITIONS TO DRIVE DEMAND FOR SMART GREENHOUSES IN SOUTH AMERICA
13 COMPETITIVE LANDSCAPE (Page No. - 84)
13.1 OVERVIEW
13.2 RANKING ANALYSIS OF KEY PLAYERS IN SMART GREENHOUSE MARKET
13.3 COMPETITIVE SITUATIONS AND TRENDS
13.3.1 PRODUCT LAUNCHES/DEVELOPMENTS
13.3.2 AGREEMENTS
13.3.3 CONTRACTS
13.3.4 EXPANSIONS
13.3.5 PARTNERSHIPS
13.4 COMPETITIVE LEADERSHIP MAPPING, 2019
13.4.1 VISIONARY LEADERS
13.4.2 DYNAMIC DIFFERENTIATORS
13.4.3 INNOVATORS
13.4.4 EMERGING COMPANIES
14 COMPANY PROFILES (Page No. - 91)
(Business Overview, Products Offered, Recent Developments, SWOT Analysis, MnM View)*
14.1 KEY PLAYERS
14.1.2 ARGUS CONTROLS
14.1.3 CERTHON
14.1.4 ROUGH BROTHERS
14.1.5 GREENTECH AGRO
14.1.6 NETAFIM
14.1.7 SENSAPHONE
14.1.8 CULTIVAR
14.1.9 HELIOSPECTRA AB
14.1.10 LUMIGROW, INC.
14.2 RIGHT TO WIN
14.3 OTHER IMPORTANT PLAYERS
14.3.1 DESERT GROWING
14.3.2 GREENTECH INDIA
14.3.3 PROSPERA TECHNOLOGIES
14.3.4 PURE HARVEST
14.3.5 GROWLINK
14.3.6 MOTORLEAF
14.3.7 KHEYTI
14.3.8 HORT AMERICAS
14.3.9 DELTA T SOLUTIONS
14.3.10 GROWFLUX
*Details on Business Overview, Products Offered, Recent Developments, SWOT Analysis, MnM View might not be captured in case of unlisted companies.
15 APPENDIX (Page No. - 113)
15.1 INSIGHTS FROM INDUSTRY EXPERTS
15.2 DISCUSSION GUIDE
15.3 KNOWLEDGE STORE: MARKETSANDMARKETS’ SUBSCRIPTION PORTAL
15.4 AVAILABLE CUSTOMIZATIONS
15.5 RELATED REPORTS
15.6 AUTHOR DETAILS
LIST OF TABLES (60 Tables)
TABLE 1 SMART GREENHOUSE MARKET, BY TYPE, 2017–2025 (USD MILLION)
TABLE 2 HYDROPONICS SMART GREENHOUSE MARKET, BY REGION, 2017–2025 (USD MILLION)
TABLE 3 NON-HYDROPONICS SMART GREENHOUSE MARKET, BY REGION, 2017–2025 (USD THOUSAND)
TABLE 4 SMART GREENHOUSE MARKET, BY COVERING MATERIAL TYPE, 2017–2025 (USD MILLION)
TABLE 5 POLYETHYLENE SMART GREENHOUSE MARKET, BY REGION, 2017–2025 (USD MILLION)
TABLE 6 POLYCARBONATE SMART GREENHOUSE MARKET, BY REGION, 2017–2025 (USD THOUSAND)
TABLE 7 OTHER COVERING MATERIALS SMART GREENHOUSE MARKET, BY REGION, 2017–2025 (USD THOUSAND)
TABLE 8 SMART GREENHOUSE MARKET, BY OFFERING, 2017–2025 (USD MILLION)
TABLE 9 PRECISION FARMING MARKET, BY OFFERING, 2017–2025 (USD MILLION)
TABLE 10 SMART GREENHOUSE HARDWARE MARKET, BY REGION, 2017–2025 (USD MILLION)
TABLE 11 PRECISION FARMING HARDWARE MARKET, BY REGION, 2017–2025 (USD MILLION)
TABLE 12 SMART GREENHOUSE SOFTWARE & SERVICES MARKET, BY REGION, 2017–2025 (USD THOUSAND)
TABLE 13 PRECISION FARMING SOFTWARE MARKET, BY REGION, 2017–2025 (USD MILLION)
TABLE 14 PRECISION FARMING SERVICES MARKET, BY REGION, 2017–2025 (USD MILLION)
TABLE 15 SMART GREENHOUSE MARKET, BY COMPONENT, 2017–2025 (USD MILLION)
TABLE 16 SMART GREENHOUSE HVAC SYSTEMS MARKET, BY REGION, 2017–2025 (USD MILLION)
TABLE 17 SMART GREENHOUSE LED GROW LIGHTS MARKET, BY REGION, 2017–2025 (USD MILLION)
TABLE 18 SMART GREENHOUSE CONTROL SYSTEMS & SENSORS MARKET, BY REGION, 2017–2025 (USD MILLION)
TABLE 19 SMART GREENHOUSE MARKET, BY END USER, 2017–2025 (USD MILLION)
TABLE 20 SMART GREENHOUSE MARKET FOR COMMERCIAL GROWERS, BY REGION, 2017–2025 (USD MILLION)
TABLE 21 SMART GREENHOUSE MARKET FOR RESEARCH & EDUCATIONAL INSTITUTES, BY REGION, 2017–2025 (USD MILLION)
TABLE 22 SMART GREENHOUSE MARKET FOR RETAIL GARDENS, BY REGION, 2017–2025 (USD MILLION)
TABLE 23 SMART GREENHOUSE MARKET FOR OTHER END USERS, BY REGION, 2017–2025 (USD THOUSAND)
TABLE 24 SMART GREENHOUSE MARKET, BY REGION, 2017–2025 (USD MILLION)
TABLE 25 PRECISION FARMING MARKET, BY REGION, 2017–2025 (USD MILLION)
TABLE 26 PRECISION FARMING MARKET, BY AMERICAS, 2017–2025 (USD MILLION)
TABLE 27 SMART GREENHOUSE MARKET IN NORTH AMERICA, BY TYPE, 2017–2025 (USD MILLION)
TABLE 28 SMART GREENHOUSE MARKET IN NORTH AMERICA, BY COVERING MATERIAL TYPE, 2017–2025 (USD MILLION)
TABLE 29 SMART GREENHOUSE HARDWARE MARKET IN NORTH AMERICA, BY OFFERING, 2017–2025 (USD MILLION)
TABLE 30 SMART GREENHOUSE MARKET IN NORTH AMERICA, BY COMPONENT, 2017–2025 (USD MILLION)
TABLE 31 SMART GREENHOUSE MARKET IN NORTH AMERICA, BY END USER, 2017–2025 (USD MILLION)
TABLE 32 SMART GREENHOUSE MARKET IN NORTH AMERICA, BY COUNTRY, 2017–2025 (USD MILLION)
TABLE 33 PRECISION FARMING MARKET IN NORTH AMERICA, BY COUNTRY, 2017–2025 (USD MILLION)
TABLE 34 SMART GREENHOUSE MARKET IN EUROPE, BY TYPE, 2017–2025 (USD MILLION)
TABLE 35 SMART GREENHOUSE MARKET IN EUROPE, BY COVERING MATERIAL TYPE, 2017–2025 (USD MILLION)
TABLE 36 SMART GREENHOUSE MARKET IN EUROPE, BY OFFERING, 2017–2025 (USD MILLION)
TABLE 37 SMART GREENHOUSE MARKET IN EUROPE, BY COMPONENT, 2017–2025 (USD MILLION)
TABLE 38 SMART GREENHOUSE MARKET IN EUROPE, BY END USER, 2017–2025 (USD MILLION)
TABLE 39 SMART GREENHOUSE MARKET IN EUROPE, BY COUNTRY, 2017–2025 (USD MILLION)
TABLE 40 PRECISION FARMING MARKET IN EUROPE, BY COUNTRY, 2017–2025 (USD MILLION)
TABLE 41 SMART GREENHOUSE MARKET IN APAC, BY TYPE, 2017–2025 (USD MILLION)
TABLE 42 SMART GREENHOUSE MARKET IN APAC, BY COVERING MATERIAL TYPE, 2017–2025 (USD MILLION)
TABLE 43 SMART GREENHOUSE MARKET IN APAC, BY OFFERING, 2017–2025 (USD MILLION)
TABLE 44 SMART GREENHOUSE MARKET IN APAC, BY COMPONENT, 2017–2025 (USD MILLION)
TABLE 45 SMART GREENHOUSE MARKET IN APAC, BY END USER, 2017–2025 (USD MILLION)
TABLE 46 SMART GREENHOUSE MARKET IN APAC, BY COUNTRY, 2017–2025 (USD MILLION)
TABLE 47 PRECISION FARMING MARKET IN APAC, BY COUNTRY, 2017–2025 (USD MILLION)
TABLE 48 SMART GREENHOUSE MARKET IN ROW, BY TYPE, 2017–2025 (USD THOUSAND)
TABLE 49 SMART GREENHOUSE MARKET IN ROW, BY COVERING MATERIAL TYPE, 2017–2025 (USD THOUSAND)
TABLE 50 SMART GREENHOUSE MARKET IN ROW, BY OFFERING, 2017–2025 (USD MILLION)
TABLE 51 SMART GREENHOUSE MARKET IN ROW, BY COMPONENT, 2017–2025 (USD THOUSAND)
TABLE 52 SMART GREENHOUSE MARKET IN ROW, BY END USER, 2017–2025 (USD THOUSAND)
TABLE 53 SMART GREENHOUSE MARKET IN ROW, BY REGION, 2017–2025 (USD MILLION)
TABLE 54 PRECISION FARMING MARKET IN ROW, BY REGION, 2017–2025 (USD MILLION)
TABLE 55 PRECISION FARMING MARKET IN SOUTH AMERICA, BY COUNTRY, 2017–2025 (USD MILLION)
TABLE 56 PRODUCT LAUNCHES/DEVELOPMENTS, 2017–2019
TABLE 57 AGREEMENTS, 2017–2019
TABLE 58 CONTRACTS, 2017–2019
TABLE 59 EXPANSIONS, 2017–2019
TABLE 60 PARTNERSHIPS, 2017–2019
LIST OF FIGURES (34 Figures)
FIGURE 1 MARKET SEGMENTATION
FIGURE 2 SMART GREENHOUSE MARKET: RESEARCH DESIGN
FIGURE 3 MARKET SIZE ESTIMATION METHODOLOGY: APPROACH 1 (SUPPLY SIDE): REVENUE GENERATED FROM SALES OF HARDWARE OF SMART GREENHOUSES
FIGURE 4 MARKET SIZE ESTIMATION METHODOLOGY: APPROACH 2 (SUPPLY SIDE): REVENUE GENERATED FROM SALES OF HARDWARE/SOFTWARE & SERVICES OF SMART GREENHOUSES
FIGURE 5 MARKET SIZE ESTIMATION METHODOLOGY: APPROACH 3 (DEMAND SIZE) – BOTTOM-UP APPROACH FOR ESTIMATION OF SIZE OF SMART GREENHOUSE MARKET BASED ON REGION
FIGURE 6 MARKET SIZE ESTIMATION METHODOLOGY: BOTTOM-UP APPROACH
FIGURE 7 MARKET SIZE ESTIMATION METHODOLOGY: TOP-DOWN APPROACH
FIGURE 8 DATA TRIANGULATION METHODOLOGY
FIGURE 9 HYDROPONICS SEGMENT TO LEAD SMART GREENHOUSE MARKET FROM 2020 TO 2025
FIGURE 10 HARDWARE SEGMENT TO ACCOUNT FOR LARGE SIZE OF SMART GREENHOUSE MARKET FROM 2020 TO 2025
FIGURE 11 POLYETHYLENE SEGMENT TO ACCOUNT FOR LARGEST SIZE OF SMART GREENHOUSE MARKET FROM 2020 TO 2025
FIGURE 12 RESEARCH & EDUCATIONAL INSTITUTES SEGMENT HELD LARGEST SHARE OF SMART GREENHOUSE MARKET IN 2019
FIGURE 13 EUROPE ACCOUNTED FOR LARGEST SHARE OF SMART GREENHOUSE MARKET IN 2019
FIGURE 14 INCREASING GLOBAL DEMAND FOR FOOD DRIVING GROWTH OF SMART GREENHOUSE MARKET
FIGURE 15 HYDROPONICS SEGMENT TO ACCOUNT FOR LARGE SIZE OF SMART GREENHOUSE MARKET FROM 2020 TO 2025
FIGURE 16 RESEARCH & EDUCATIONAL INSTITUTES SEGMENT AND CHINA ACCOUNTED FOR LARGEST SHARES OF SMART GREENHOUSE MARKET IN APAC IN 2019
FIGURE 17 POLYETHYLENE SEGMENT TO LEAD SMART GREENHOUSE MARKET IN NORTH AMERICA FROM 2020 TO 2025
FIGURE 18 SMART GREENHOUSE MARKET IN APAC TO GROW AT HIGHEST CAGR FROM 2020 TO 2025
FIGURE 19 SMART GREENHOUSE MARKET: DRIVERS, RESTRAINTS, OPPORTUNITIES, AND CHALLENGES
FIGURE 20 GLOBAL FOOD CONSUMPTION IN KCAL/PERSON/DAY BY 2030
FIGURE 21 IMPACT ANALYSIS OF DRIVERS ON SMART GREENHOUSE MARKET
FIGURE 22 IMPACT ANALYSIS OF RESTRAINTS ON SMART GREENHOUSE MARKET
FIGURE 23 IMPACT ANALYSIS OF OPPORTUNITIES ON SMART GREENHOUSE MARKET
FIGURE 24 IMPACT ANALYSIS OF CHALLENGES ON SMART GREENHOUSE MARKET
FIGURE 25 VALUE CHAIN ANAYSIS: SMART GREENHOUSE MARKET
FIGURE 26 SMART GREENHOUSE MARKET IN CANADA TO GROW AT HIGHEST CAGR FROM 2020 TO 2025
FIGURE 27 NORTH AMERICA: SMART GREENHOUSE MARKET SNAPSHOT
FIGURE 28 EUROPE: SMART GREENHOUSE MARKET SNAPSHOT
FIGURE 29 APAC: SMART GREENHOUSE MARKET SNAPSHOT
FIGURE 30 PRODUCT LAUNCHES/DEVELOPMENTS ADOPTED AS KEY GROWTH STRATEGY FROM 2017 TO 2019
FIGURE 31 SMART GREENHOUSE MARKET: RANKING OF KEY COMPANIES IN 2019
FIGURE 32 COMPETITIVE LEADERSHIP MAPPING FOR SMART GREENHOUSE SOLUTION PROVIDERS, 2019
FIGURE 33 COMPETITIVE LEADERSHIP MAPPING FOR SMART GREENHOUSE HARDWARE PROVIDERS, 2019
FIGURE 34 HELIOSPECTRA AB: COMPANY SNAPSHOT
The study involved 4 major activities for estimating the current size of the smart greenhouse market. Exhaustive secondary research was carried out to collect information on the market, peer markets, and the parent market. The next step was to validate these findings, assumptions, and sizing with the industry experts across the value chain through primary research. Both top-down and bottom-up approaches were employed to estimate the complete market size. Thereafter, market breakdown and data triangulation procedures were used to estimate the size of segments and subsegments of the market.
Secondary Research
Secondary sources referred to for this research study included corporate filings (such as annual reports, investor presentations, and financial statements); trade, business, and professional associations; white papers, smart greenhouse-related journals, The Institute of Environmental Sciences and Technology (IEST) publications; directories; and databases. The secondary data was collected and analyzed to arrive at the overall market size estimations, which was further validated through the primary research.
Primary Research
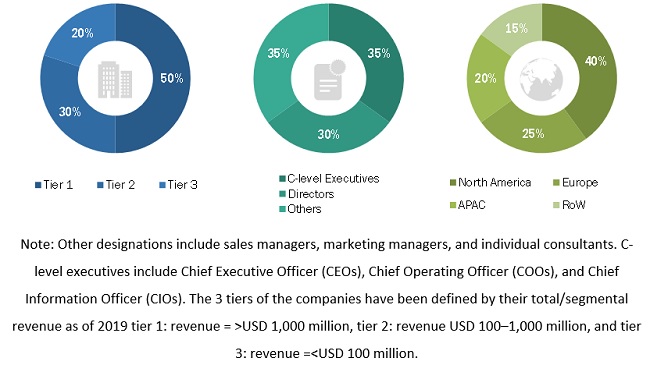
In the primary research process, various primary sources from both supply and demand sides were interviewed to obtain qualitative and quantitative information relevant to this report. Extensive primary research was conducted after understanding and analyzing the smart greenhouse market through secondary research. Several primary interviews were conducted with the key opinion leaders from both demand and supply side across 4 regions: North America, Europe, Asia Pacific (APAC), and the Rest of the World (RoW). RoW comprises the Middle East and Africa and South America. Approximately 25% of the primary interviews were conducted with the demand side, while approximately 75% with the supply side. This primary data was collected mainly through telephonic interviews, which accounted for approximately 80% of the total primary interviews. Besides, questionnaires and emails were also used to collect the data.
To know about the assumptions considered for the study, download the pdf brochure
Market Size Estimation
Both top-down and bottom-up approaches were implemented to estimate and validate the total size of the smart greenhouse market. These methods were also used extensively to estimate the size of the markets based on various segments. The research methodology used to estimate the market size included the following steps:
- The key players in the industry and markets were identified through extensive secondary research
- The industry’s supply chain and market size, in terms of value, were determined through primary and secondary research processes
- All percentage shares, splits, and breakdowns were determined using secondary sources and verified through primary sources
Data Triangulation
After arriving at the overall market size—using the market size estimation processes as explained above—the market was split into several segments and subsegments. Data triangulation and market breakdown procedures were employed, wherever applicable, to complete the overall market engineering process and arrive at the exact statistics for each market segment and subsegment. The data was triangulated by studying various factors and trends from demand and supply sides across different end users.
Study Objectives
- To describe and forecast the smart greenhouse market, in terms of value, based on type, covering material type, end user, offering, and component
- To describe and forecast the market for 4 major regions—North America, Europe, Asia Pacific (APAC), and the Rest of the World (RoW)
- To provide detailed information regarding major factors such as drivers, restraints, opportunities, and challenges influencing the growth of the market
- To describe the types of crops cultivated in smart greenhouses
- To strategically analyze micromarkets1 with respect to the individual growth trends, prospects, and their contributions to the overall market
- To analyze opportunities in the market for the stakeholders and provide a detailed competitive landscape of the market
- To strategically profile the key players in the market and comprehensively analyze their market ranking and core competencies2
- To analyze competitive developments such as contracts, partnerships, product launches/developments, expansions, acquisitions, agreements, and research and development (R&D) activities carried out by players in the smart greenhouse market
Available Customizations
With the given market data, MarketsandMarkets offers customizations according to the specific requirements of companies. The following customization options are available for this report:
Regional Analysis
- Country-wise breakdown of the smart greenhouse market for North America, Europe, APAC, and RoW
Company Informations
- Detailed analysis and profiling of additional market players (up to 5)


Growth opportunities and latent adjacency in Smart Greenhouse Market
Hello, I am a researcher and I am interested to put up a smart greenhouse in a school. How much do I need to put up such a project. Thank you.
Yes, we do track such type of data for different type of crops. I would request you to go through this linkhttps://www.marketsandmarkets.com/Market-Reports/commercial-greenhouse-market-221045451.htmlIn case of any concern, feel free to mail us at [email protected]
I am seeking marekt data which tells protected horticulture crop area country by countriy especially that of China and EU member states. Do your market data include such data ?
I am interested in understanding the market for smart greenhouse in APAC. Also, I would like to know more about the smart green house market for specific countries in APAC and technologies of smart green house in same region. Could you please explain me the scope of your report ?
In smart greenhouse factors such as air, light, temperature, soil, etc. are controlled for plant growth. I am trying to understand the different types of smart green houses. Does your report cover this specific interest of mine?
I am looking for in-depth analysis of the snart green house market. I would like to know more about the segments covered in the report. I would also like to understand the research methodology used to arrive at the market size. Can you help me with the scope of the Smart green house Market?
Hi, I am a post-doctoral researcher in US This market report appears to be very interesting. Can I get a sample of this report?
I am a student doing a research paper on the viability of the residential hydroponic systems in the US. Does your report cover this information?