VCSEL Market

VCSEL Market by Type (Single-mode, Multimode), Material (Gallium Arsenide, Indium Phosphide), Data Rate (Up to 10 Gbps, 10.1 to 25 Gbps, Above 25 Gbps), Wavelength (Red, Near-Infrared (NIR), Shortwave Infrared (SWIR)) & Region – Global Forecast to 2029

Report Code: SE 3835 Jul, 2024, by marketsandmarkets.com

[307 Pages Report] The VCSEL market was valued at USD 1.3 billion in 2024 and is expected to reach USD 1.9 billion by 2029, registering a CAGR of 8.1% during the forecast period.

The VCSEL market is witnessing significant growth owing to a confluence of factors propelling its expansion. One of the major factor driving  the VCSEL market growth is the rise in adoption of 3D sensing applications in smartphones such as proximity sensing and facial recognition. In smartphones, the facial recognition systems rely on VCSELs to create accurate depth maps for secure and reliable user authentication. Adding to this, the escalating demand for high-speed and efficient data transmission fuels the adoption of VCSELs in data communication applications. VCSELs with their capability to support high data rates and dense integration, are suited to meet these demands in data communication applications. Moreover, the higher market investments for VCSEL manufacturing, and expanding use of biometric security systems are expected to amplify the VCSEL market growth over the forecast timeframe.

VCSEL Market

VCSEL Market

VCSEL Market Forecast to 2029

To know about the assumptions considered for the study, Request for Free Sample Report

Market Dynamics:

Drivers: Expanding use of facial recognition and biometric security systems

The expanding use of facial recognition and biometric security systems is a significant growth driver for the VCSEL market. VCSELs are critical components in these advanced security technologies due to their ability to emit precise, coherent light which is used to create detailed 3D maps of objects and faces. As privacy and security concerns become increasingly prominent in both consumer and enterprise sectors, the demand for reliable and accurate biometric systems continues to rise, propelling the growth of the VCSEL market. Security breaches and identity theft are primary concerns for which facial recognition and biometric security systems offer robust solutions. VCSELs enable high-resolution depth sensing and accurate facial recognition. Apple’s Face ID technology, which uses VCSELs to project a structured light pattern onto the user’s face, has set a new standard for biometric security in smartphones. The Face ID uses a TrueDepth camera along with machine learning for secure authentication. The precision and reliability of VCSELs in these applications enhance user trust and drive broader adoption of biometric technologies.

The application of VCSELs in biometric security is not limited to smartphones. Access control systems in offices, airports, and other high-security environments increasingly rely on facial recognition for secure entry. In October 2023, SITA (Germany) published an article highlighting that Frankfurt Airport is now the first in Europe to offer biometric touchpoints to all airline passengers. This initiative allows passengers to use face biometrics as identification from check-in to boarding, eliminating the need to show physical documents. This seamless, frictionless passage through the airport showcases the practical applications of biometric security systems on a large scale. Implementing biometric systems at Frankfurt Airport highlights the rising demand for advanced facial recognition technology, which relies on VCSELs. As more airports and high-security environments adopt these technologies, the need for VCSELs will grow substantially.

Restraint: Limitations of semiconductor materials hampering performance

VCSELs typically rely on compound semiconductor materials namely, gallium arsenide (GaAs) and indium phosphide (InP), which have inherent material limitations that can hamper their performance. These limitations include issues related to thermal management, wavelength range, and manufacturing challenges. Thermal management is a critical factor in the performance of VCSELs. The efficiency of VCSELs can degrade significantly due to heat generation during operation, leading to thermal rollover—a condition where the output power decreases with increasing temperature. This thermal sensitivity is particularly problematic for high-power applications and dense integration in data centers, where maintaining optimal operating temperatures is challenging. Ineffective thermal management can result in reduced reliability and lifespan of the VCSELs, thereby limiting their appeal for demanding applications.

Opportunities: Rise in adoption of VCSEL into medical imaging and biomedical sensing applications

VCSELs offer unique advantages, such as precise wavelength control, high beam quality, and compact size, making them ideal for various medical and biomedical applications. As the healthcare industry continually seeks advanced technologies to improve patient accuracy and diagnostic accuracy, the adoption of VCSELs in these areas is set to expand rapidly. VCSELs offer significant advantages for medical imaging and biomedical sensing applications, particularly in pulse oximetry and tissue oximetry. Traditionally, these applications have used LEDs at specific wavelengths to measure blood oxygenation. However, VCSELs present improvements such as narrower spectral linewidth emission, smaller wavelength shifts with temperature changes, and significantly reduced power consumption, which is especially beneficial for developing wireless and home-monitoring medical devices. In optical sensing, VCSELs outperform LEDs by offering precisely chosen wavelengths less sensitive to temperature changes, faster modulation for noise reduction, and lower power consumption. This makes them ideal for wireless or implantable sensors. VCSELs are now available in wavelengths ranging from 670–980 nm and above 1,300 nm, facilitating a wide range of biomedical applications.

Challenge: Managing intellectual property rights and patent issues

VCSEL technology, being highly specialized and innovative, is subject to numerous patents and intellectual property protections. Navigating the complex landscape of IP rights can hinder the development, production, and commercialization of VCSELs, impacting market growth and competition. The VCSEL market is characterized by a dense web of patents held by various companies and research institutions. These patents cover a wide range of aspects, from the fundamental design and manufacturing processes of VCSELs to specific applications and integration methods.

Fear of patent infringement can stifle innovation and collaboration. Companies may be reluctant to explore new applications for VCSEL technology or share knowledge due to the risk of legal repercussions. In April 2023, Ouster Inc. (US) filed a patent infringement lawsuit against rival Hesai Group (China), seeking to ban US imports of Hesai’s products. Ouster accused Hesai of infringing five US patents co-invented by Ouster’s CEO, Angus Pacala, and is requesting the US International Trade Commission (ITC) to issue a limited exclusion order and cease-and-desist order. Both companies sell digital lidar sensors for automotive and industrial markets, with Hesai’s “AT128” sensors utilizing 905 nm VCSELs. Ouster has also filed a complaint in the US District Court, Delaware, seeking an injunction and monetary damages. This lawsuit between Ouster and Hesai exemplifies the complexities and high stakes involved in navigating the IP landscape. These challenges include high costs of licensing and litigation, potential inhibition of innovation, and difficulties in collaboration. Strategic IP management and collaborative agreements could help mitigate these challenges, fostering a more dynamic and competitive market environment for VCSEL technology.

VCSEL Ecosystem

VCSEL Market by Ecosystem

Multimode segment to hold major market share during the forecast period.

The multimode VCSEL segment to hold high market share during the forecast period. Multimode VCSELs are capable of supporting high data transmission rates over short distances. This makes them ideal for applications in data centers, which require rapid and efficient data transfer between servers and storage systems. In data center environments, optical transceivers are incorporated with multimode VCSELs for data transfer applications. Transceivers with multimode VCSELs are ideally suited for short-reach connectivity in data centers, spanning artificial intelligence (AI), high-performance computing (HPC), and networking applications. Companies emphasize developing technically advanced multimode VCSELs to cater to growing demand from next-gen AI networking applications. In March 2024, Coherent Corp. (US) announced developments in its multimode VCSELs by improving the bandwidth, paving its way for the adoption of next-generation optical interconnects that will operate at 200 Gbps per lane and thereby enabling optical transceivers with 1.6 Tbps capacity. The company has developed lithographic aperture multimode VCSELs that help to achieve a device bandwidth of approximately 45 GHz suitable for AI networking applications across data center environments. Such innovative product launches will foster the multimode VCSEL segment growth over the forecast period.

Near-infrared (NIR) segment account for the largest share of the VCSEL market for during the forecast period

The near-infrared (NIR) VCSEL segment hold high market share during forecast period. The growth is primarily driven by its adoption in smartphones for 3D sensing applications such as gesture and facial recognition, as well as automotive in-cabin sensing. The NIR VCSEL with 850 nm wavelength is a preferred solution incorporated by smartphone manufacturers. Large smartphone manufacturers such as Apple, Inc. (US), OPPO (China), Huawei Technologies Co., Ltd. (China), Samsung (South Korea), and Xiaomi (China) are increasingly integrating these technologies, driving significant demand for NIR VCSELs. NIR VCSELs are also incorporated into automotive for cockpit monitoring and advanced in-cabin sensing applications. Companies emphasize developing NIR VCSELs to cater to automotive use cases and stay competitive. In June 2023, ams-OSRAM AG (Austria) launched a new AEC-Q102 certified NIR VCSEL through its TARA2000-AUT-SAFE family of VCSELs. The new VCSEL generates a tightly controlled beam of infrared (IR) light at a peak wavelength of 940 nm and is suitable for applications such as driver monitoring, gesture sensing, and in-cabin monitoring.

Gallium Arsenide (GaAs) segment account for the largest share of the VCSEL market for during the forecast period

The GaAs segment hold high market share during forecast timeframe. The high market share is attributed to its material properties, i.e., superior electron mobility and direct bandgap, making it highly suitable for VCSEL manufacturing. These exceptional properties enhance the performance and efficiency of VCSELs, particularly in high-speed data transmission and optical communication applications. Companies are extensively focusing on volume manufacturing of VCSELs to stay competitive. For instance, in January 2023, TRUMPF (Germany) developed a new industrial production platform to expand its portfolio of GaAs-based VCSELs, covering the 760 nm to 1,300 nm range for near-infrared (NIR) applications. This new platform offers greater flexibility in the longer wavelength spectrum while maintaining the compactness, robustness, and cost-effectiveness of GaAs light sources. Such investments by market players are expected to fuel market growth over the forecast period.

Sensing segment account for the largest share of the VCSEL market for during the forecast period

The sensing segment to hold high market share during the forecast period. VCSELs are widely used in advanced sensing applications such as facial recognition, gesture recognition, proximity sensing, and 3D depth sensing, all of which have become integral features in modern consumer electronics such as smartphones, tablets, and wearables. The rapid adoption of these devices globally has significantly fueled the demand for VCSEL-based sensors. In January 2023, Lumentum Operations LLC (US) announced they had shipped over one billion VCSEL arrays for 3D sensing applications. These arrays are used in facial recognition and augmented reality (AR) applications. Lumentum's achievement of shipping over one billion VCSEL arrays for 3D sensing applications underscores the rapid growth and increasing demand for VCSEL technology in sensing applications, particularly smartphones. The adoption of VCSELs in facial recognition, augmented reality (AR), and other advanced applications has been a significant driver of this growth.

10.1 to 25 Gbps segment account for the largest share of the VCSEL market during the forecast period

The market for VCSELs with a data rate of 10.1 to 25 Gbps hold high market share during forecast period. The high market share is driven by the ability of these VCSELs to transmit data at high speeds over short to medium distances, making them ideal for interconnects within and between servers. The VCSELs operating within the 10.1 to 25 Gbps range serve as a bridge between standard and high-speed data communication requirements. These devices are suitable for environments where moderate to high-speed data transfer is necessary, such as high-performance computing (HPC) clusters, telecommunications, and enterprise data centers. The key features of VCSELs in this category include improved thermal stability, enhanced modulation speeds, and higher power output compared to the lower segment. These improvements allow for longer reach and higher data throughput, meeting the demands of more data-intensive applications, thus fueling the segment growth.

Consumer electronics segment account for the largest share of the VCSEL market during the forecast period

The market for consumer electronics accounted for a high market share during the forecast period. Consumer electronics industries are increasingly seeking smarter components that improve device performance and illumination quality. Major smartphone manufacturers such as Apple Inc. (US), Huawei Technologies Co., Ltd. (China), SAMSUNG (South Korea), and Xiaomi (China) have already integrated VCSELs into their devices. Many smartphone companies are also adopting 3D sensing technology, and more are likely to follow this trend. VCSELs are crucial for facial and gesture recognition in smartphones and are also used in time-of-flight (ToF) rear cameras to enhance image quality. Additionally, the growing popularity of AR/VR devices, which rely on VCSELs, is anticipated to drive further growth in this segment as these technologies become more widely adopted. Companies are also developing VCSELs with features such as polarization-controlled light, offering advantages in applications such as OLED screens and virtual/augmented reality. This is expected to further fuel the VCSEL market growth over the forecast period.

VCSEL market in Asia Pacific is expected to grow at high CAGR during the forecast period

The Asia Pacific VCSEL market is expected to grow at high rate during the forecast period. The market growth is credited to a large consumer electronics manufacturing industry in major economies such as China, South Korea, and Japan. China is one of the biggest consumer electronics manufacturers and the biggest consumer electronics consumer in the region, followed by South Korea, a key country for manufacturing portable consumer devices. The region has a strong presence of smartphone manufacturers such as SAMSUNG (South Korea), Xiaomi (China), OPPO (China), and Huawei Technologies, Co., Ltd. (China) that are already implementing VCSELs in their smartphones. Adding to this, the region has led the adoption of 5G communication technology. The VCSELs play a crucial role in developing and deploying 5G networks by providing high-speed data transmission and improving the performance of optical fiber communications. The VCSELs are highly incorporated into 5G infrastructure solutions, including optical transceivers, telecom servers, and wireless infrastructure that enhances the backhaul connectivity, which is vital for the seamless functioning of 5G networks. According to a June 2024 press release by the Ministry of Industry and Information Technology (MIIT), China, there were more than 3.8 million 5G base stations across China as of May 2024. The proliferation of 5G base station infrastructure will further fuel the VCSEL market growth across Asia Pacific.

VCSEL Market by Region

VCSEL Market by Region

To know about the assumptions considered for the study, download the pdf brochure

Key Market Players

Major vendors in the VCSEL companies are Coherent Corp. (US), Lumentum Operations LLC (US), ams-OSRAM AG (Austria), TRUMPF (Germany), Broadcom (US), MKS Instruments (US), Santec Holdings Corporation (Japan), Leonardo Electronics US, Inc. (US), VERTILAS GmbH (Germany), and Vertilite (China). Apart from this,  Sony Semiconductor Solutions Corporation (Japan), Alight Technologies (Denmark), Teledyne FLIR LLC (US), Inneos LLC (US), IQE PLC (UK), Thorlabs, Inc. (US), TT Electronics (UK), Ushio America, Inc. (US), WIN Semiconductors (Taiwan), Frankfurt Laser Company (Germany), Inphenix, Inc. (US), Bandwidth10 (US), Zhejiang RaySea Technology Co., Ltd. (China), Wuhan Qianmu Laser Co., Ltd. (China), OCTLIGHT (Denmark), Sanan IC (China), and Brightlaser Ltd. (Hong Kong) are among a few emerging companies in the VCSEL market.

Get online access to the report on the World's First Market Intelligence Cloud

  • Easy to Download Historical Data & Forecast Numbers
  • Company Analysis Dashboard for high growth potential opportunities
  • Research Analyst Access for customization & queries
  • Competitor Analysis with Interactive dashboard
  • Latest News, Updates & Trend analysis
Request Sample

Scope of the Report

Report Metric

Details

Market size available for years

2020—2029

Base year

2023

Forecast period

2024—2029

Segments covered

Type, Material, Data Rate, Wavelength, Applications, Vertical, and Region

Geographic regions covered

North America, Europe, Asia Pacific, and RoW

Companies covered

The major players include Coherent Corp. (US), Lumentum Operations LLC (US), ams-OSRAM AG (Austria), TRUMPF (Germany), Broadcom (US), MKS Instruments (US), Santec Holdings Corporation (Japan), Leonardo Electronics US, Inc. (US), VERTILAS GmbH (Germany), Vertilite (China), and Others- total 27 players have been covered.

VCSEL Market Highlights

This research report categorizes the VCSEL market based on Type, Wavelength, Material, Application, Data Rate, Industry, and Region.

Segment

Subsegment

By Type:

  • Single-mode
  • Multimode

By Wavelength:

  • Red
  • Near-Infrared (NIR)
  • Shortwave Infrared (SWIR)

By Material:

  • Gallium Arsenide (GaAs)
  • Indium Phosphide (InP)
  • Other Materials

By Application:

  • Sensing
  • Data Communication
  • Industrial Heating and Laser Printing
  • Emerging and other appliations

By Data Rate:

  • Up to 10 Gbps
  • 10.1 to 25 Gbps
  • Above 25 Gbps

By Vertical:

  • Consumer Electronics
  • Data Center
  • Automotive
  • Commercial & Industrial
  • Healthcare
  • Military

By Region:

  • North America
    • US
    • Canada
    • Mexico
  • Europe
    • Germany
    • UK
    • France
    • Rest of Europe
  • Asia Pacific
    • China
    • Japan
    • South Korea
    • Rest of Asia Pacific
  • Rest of the World (RoW)
    • South America
    • Middle East
      • GCC Countries
      • Rest of Middle East
    • Africa

Recent Developments

  • In March 2024, Coherent Corp. (US) announced a significant advancement in VCSEL technology, enhancing bandwidth to support next-generation optical interconnects at 200 Gbps per lane, enabling 1.6 Tbps optical transceivers. This breakthrough involved lithographic-aperture VCSELs, a significant improvement over the current oxide-aperture VCSELs limited to 100G per lane and 27 GHz bandwidth. The new VCSELs would offer smaller, more reproducible, and reliable apertures.
  • In January 2024, Coherent Corp. (US) introduced a new illumination module platform for short- and mid-range LiDAR aimed at enhancing automotive safety and robotic vision in industrial applications. It supported advanced driver assistance systems (ADAS) and depth sensing in robots, offering up to 30 meters of depth sensing in bright daylight with over 30% power conversion efficiency.
  • In January 2024, TRUMPF (Germany) developed its latest TruHeat VCSEL laser heating systems for surface heating and e-mobility applications. These systems offered efficient, controllable heat treatment optimized for thermal design with multi-junction VCSEL arrays. The 980 nm wavelength enhanced drying efficiency for battery electrode materials.
  • In September 2023, Coherent Corp. (US) and Windstream Intellectual Property Services, LLC (US) extended their partnership to include 100G services at the network edge, using Coherent’s new 100G QSFP28 0 dBm digital coherent optics (DCO) transceiver. This extension aimed to address the growing data traffic demands from enterprise and cloud networks, particularly with the emergence of artificial intelligence (AI) and mackine learning (ML) applications.
  • In September 2023, Metalenz, Inc. (US) and Vertilite (China) announced the Starlight projector at the CIOE tradeshow in Shenzhen, China. This compact, high-performance, low-cost structured light projector combined Metalenz’s “Orion 18K” meta-optic with Vertilite’s “Dolphin” VCSEL. It generated ~18,000 pseudorandom dots at 940 nm, ideal for 3D sensing applications such as smartphone face authentication, contactless access control, security, gesture recognition, obstacle avoidance, and automotive in-cabin monitoring.

Key Questions Addressed in the Report:

To speak to our analyst for a discussion on the above findings, click Speak to Analyst

TABLE OF CONTENTS
 
1 INTRODUCTION (Page No. - 37)
    1.1 STUDY OBJECTIVES 
    1.2 MARKET DEFINITION 
           1.2.1 MARKETS COVERED
                    FIGURE 1 VCSEL MARKET SEGMENTATION
           1.2.2 INCLUSIONS AND EXCLUSIONS
                    TABLE 1 STUDY INCLUSIONS AND EXCLUSIONS
           1.2.3 REGIONAL SCOPE
                    FIGURE 2 VCSEL MARKET SEGMENTATION, BY REGION
           1.2.4 YEARS CONSIDERED
                    FIGURE 3 STUDY PERIOD CONSIDERED
    1.3 UNITS CONSIDERED 
           1.3.1 CURRENCY UNIT
           1.3.2 VOLUME UNIT
    1.4 LIMITATIONS 
    1.5 STAKEHOLDERS 
    1.6 SUMMARY OF CHANGES 
           TABLE 2 SUMMARY OF CHANGES
    1.7 RECESSION IMPACT 
           FIGURE 4 GDP GROWTH PROJECTION DATA FOR MAJOR ECONOMIES, 2021–2023
    1.8 GDP GROWTH PROJECTIONS FOR LARGE ECONOMIES UNTIL 2024 
 
2 RESEARCH METHODOLOGY (Page No. - 44)
    2.1 RESEARCH DATA 
           FIGURE 5 VCSEL MARKET: RESEARCH DESIGN
           2.1.1 SECONDARY DATA
                    2.1.1.1 List of key secondary sources
                               TABLE 3 LIST OF KEY SECONDARY SOURCES
                    2.1.1.2 Key data from secondary sources
                               FIGURE 6 KEY DATA FROM SECONDARY SOURCES
           2.1.2 PRIMARY DATA
                    2.1.2.1 List of primary interview participants
                               TABLE 4 LIST OF KEY PRIMARY PARTICIPANTS
                    2.1.2.2 Breakdown of primaries
                               FIGURE 7 BREAKDOWN OF PRIMARIES, BY COMPANY TYPE, DESIGNATION, AND REGION
                    2.1.2.3 Key data from primary sources
                               TABLE 5 KEY DATA FROM PRIMARY SOURCES
                    2.1.2.4 Key industry insights
                              FIGURE 8 KEY INSIGHTS FROM INDUSTRY EXPERTS
           2.1.3 SECONDARY AND PRIMARY RESEARCH
                    FIGURE 9 PRIMARY AND SECONDARY RESEARCH APPROACHES
    2.2 MARKET SIZE ESTIMATION 
           FIGURE 10 VCSEL MARKET: RESEARCH FLOW
           FIGURE 11 APPROACH 1 (SUPPLY SIDE): REVENUE GENERATED FROM SALES OF VCSELS IN 2023
           FIGURE 12 APPROACH 2 (DEMAND SIDE): ESTIMATION OF VCSEL MARKET SIZE
           2.2.1 BOTTOM-UP APPROACH
           FIGURE 13 BOTTOM-UP APPROACH
                    2.2.1.1 Approach to arrive at market size using bottom-up analysis (demand side)
           2.2.2 TOP-DOWN APPROACH
                    FIGURE 14 TOP-DOWN APPROACH
                    2.2.2.1 Approach to arrive at market size using top-down analysis (supply side)
    2.3 DATA TRIANGULATION 
           FIGURE 15 DATA TRIANGULATION
    2.4 RESEARCH ASSUMPTIONS 
           TABLE 6 RESEARCH ASSUMPTIONS
    2.5 PARAMETERS CONSIDERED TO ANALYZE IMPACT OF RECESSION ON VCSEL MARKET 
           TABLE 7 RECESSION IMPACT
    2.6 RISK ASSESSMENT 
           TABLE 8 RISK ASSESSMENT
    2.7 RESEARCH LIMITATIONS 
           FIGURE 16 RESEARCH LIMITATIONS
 
3 EXECUTIVE SUMMARY (Page No. - 59)
    FIGURE 17 MULTIMODE VCSEL TO ACCOUNT FOR LEADING MARKET SHARE THROUGH PROJECTION PERIOD
    FIGURE 18 NEAR-INFRARED (NIR) VCSEL TO DOMINATE MARKET THROUGH PROJECTION PERIOD
    FIGURE 19 GALLIUM ARSENIDE (GAAS)-BASED VCSELS TO RECORD HIGHER CAGR DURING FORECAST PERIOD
    FIGURE 20 SENSING TO BE LARGEST APPLICATION OF VCSELS DURING FORECAST PERIOD
    FIGURE 21 VCSELS WITH 10.1 TO 25 GBPS DATA RATES TO LEAD MARKET THROUGH FORECAST PERIOD
    FIGURE 22 CONSUMER ELECTRONICS TO BE MOST DOMINANT ADOPTER OF VCSELS DURING FORECAST PERIOD
    FIGURE 23 NORTH AMERICA LED GLOBAL VCSEL MARKET IN 2023
 
4 PREMIUM INSIGHTS (Page No. - 65)
    4.1 ATTRACTIVE OPPORTUNITIES FOR PLAYERS IN VCSEL MARKET 
           FIGURE 24 ADVANTAGES OF SOLID-STATE TECHNOLOGY, COMPACT DESIGN, AND ROBUSTNESS TO DRIVE VCSEL MARKET
    4.2 VCSEL MARKET, BY WAVELENGTH AND MATERIAL 
           FIGURE 25 NEAR-INFRARED (NIR) AND GALLIUM ARSENIDE (GAAS) TO ACCOUNT FOR LARGEST RESPECTIVE SEGMENTAL SHARES IN 2024
    4.3 VCSEL MARKET, BY TYPE 
           FIGURE 26 MULTIMODE VCSELS TO FORM FASTER-GROWING MARKET BETWEEN 2024 AND 2029
    4.4 VCSEL MARKET, BY APPLICATION 
           FIGURE 27 DATA COMMUNICATION TO BE FASTEST-GROWING INDIVIDUAL APPLICATION SEGMENT
    4.5 VCSEL MARKET, BY DATA RATE 
           FIGURE 28 VCSELS PROVIDING MORE THAN 25 GBPS DATA RATE TO GROW AT HIGHEST CAGR
    4.6 VCSEL MARKET, BY VERTICAL 
           FIGURE 29 AUTOMOTIVE VERTICAL TO SEE HIGHEST GROWTH OF VCSEL ADOPTION THROUGH 2029
    4.7 VCSEL MARKET, BY REGION 
           FIGURE 30 NORTH AMERICA TO SECURE LARGEST MARKET SHARE IN 2024
    4.8 VCSEL MARKET, BY KEY COUNTRY 
           FIGURE 31 CHINA TO RECORD HIGHEST CAGR DURING FORECAST PERIOD
 
5 MARKET OVERVIEW (Page No. - 69)
    5.1 INTRODUCTION 
    5.2 MARKET DYNAMICS 
           FIGURE 32 VCSEL MARKET: DRIVERS, RESTRAINTS, OPPORTUNITIES, AND CHALLENGES
           5.2.1 DRIVERS
                    5.2.1.1 Rise in adoption of 3D sensing applications in smartphones
                    5.2.1.2 Increase in application of VCSELs in data communication
                    5.2.1.3 Higher market investment for VCSEL manufacturing
                    5.2.1.4 Expanding use of facial recognition and biometric security systems
                               FIGURE 33 IMPACT OF DRIVERS ON VCSEL MARKET
           5.2.2 RESTRAINTS
                    5.2.2.1 Limited data transmission range
                    5.2.2.2 Limitations of semiconductor materials hampering performance
                               FIGURE 34 IMPACT OF RESTRAINTS ON VCSEL MARKET
           5.2.3 OPPORTUNITIES
                    5.2.3.1 Use in LiDAR systems for automotive applications
                    5.2.3.2 Growth in IoT market and data processing across commercial and government sectors
                    5.2.3.3 Higher adoption of VCSELs in consumer electronic devices
                    5.2.3.4 Rise in adoption of VCSEL into medical imaging and biomedical sensing applications
                               FIGURE 35 IMPACT OF OPPORTUNITIES ON VCSEL MARKET
           5.2.4 CHALLENGES
                    5.2.4.1 Manufacturing defects in epitaxial layers
                    5.2.4.2 Managing intellectual property rights and patent issues
                               FIGURE 36 IMPACT OF CHALLENGES ON VCSEL MARKET
    5.3 TRENDS/DISRUPTIONS IMPACTING CUSTOMERS’ BUSINESSES 
           FIGURE 37 EYE TRACKING AND GESTURE RECOGNITION SYSTEMS TO PRESENT NEW GROWTH OPPORTUNITIES FOR VCSEL COMPANIES
    5.4 PRICING ANALYSIS 
           TABLE 9 INDICATIVE PRICING ANALYSIS OF VCSELS, BY INDUSTRY, 2023 (USD)
           5.4.1 PRICING ANALYSIS OF CONSUMER ELECTRONICS INDUSTRY, BY KEY PLAYERS, 2023
                    FIGURE 38 PRICING ANALYSIS OF CONSUMER ELECTRONICS INDUSTRY, BY KEY PLAYERS, 2023 (USD)
                    TABLE 10 PRICING ANALYSIS OF CONSUMER ELECTRONICS INDUSTRY, BY KEY PLAYERS, 2023 (USD)
           5.4.2 AVERAGE SELLING PRICE TREND, BY REGION
                    FIGURE 39 AVERAGE SELLING PRICE TREND OF VCSEL FOR CONSUMER ELECTRONICS, BY REGION, 2020–2023 (USD)
                    TABLE 11 AVERAGE SELLING PRICE TREND OF VCSEL FOR CONSUMER ELECTRONICS, BY REGION, 2020–2023 (USD)
    5.5 VALUE CHAIN ANALYSIS 
           FIGURE 40 VCSEL MARKET: VALUE CHAIN
    5.6 ECOSYSTEM ANALYSIS 
           FIGURE 41 VCSEL MARKET: ECOSYSTEM MAPPING
           TABLE 12 VCSEL MARKET: ECOSYSTEM
    5.7 INVESTMENT AND FUNDING SCENARIO 
           FIGURE 42 INVESTMENT AND FUNDING IN LASER INDUSTRY, 2023–2024 (USD MILLION)
    5.8 TECHNOLOGY ANALYSIS 
           5.8.1 KEY TECHNOLOGIES
                    5.8.1.1 3D Camera
                    5.8.1.2 LiDAR
                    5.8.1.3 Backside Emitting VCSEL
                    5.8.1.4 Zonal Illumination
                    5.8.1.5 Polarization Multiplexing
           5.8.2 COMPLEMENTARY TECHNOLOGIES
                    5.8.2.1 Augmented Reality (AR) and Virtual Reality (VR)
                    5.8.2.2 Biometric Systems
           5.8.3 ADJACENT TECHNOLOGIES
                    5.8.3.1 Edge Emitting Lasers (EELs)
                    5.8.3.2 Silicon Photonics
    5.9 PATENT ANALYSIS 
           FIGURE 43 NUMBER OF PATENTS GRANTED PER YEAR, 2013–2023
           FIGURE 44 TOP 10 COMPANIES WITH HIGHEST NUMBER OF PATENT APPLICATIONS IN LAST 10 YEARS
           TABLE 13 VCSEL MARKET: TOP PATENT OWNERS IN LAST 10 YEARS
           5.9.1 KEY PATENTS
                    TABLE 14 VCSEL MARKET: LIST OF KEY PATENTS
    5.10 TRADE ANALYSIS 
           5.10.1 IMPORT SCENARIO
                    FIGURE 45 IMPORT DATA FOR HS CODE 854140, BY COUNTRY, 2018–2022 (USD MILLION)
                    TABLE 15 IMPORT DATA FOR HS CODE 854140, BY COUNTRY, 2018–2022 (USD MILLION)
           5.10.2 EXPORT SCENARIO
                    FIGURE 46 EXPORT DATA FOR HS CODE 854140, BY COUNTRY, 2018–2022 (USD MILLION)
                    TABLE 16 EXPORT DATA FOR HS CODE 854140, BY COUNTRY, 2018–2022 (USD MILLION)
    5.11 KEY CONFERENCES AND EVENTS 
           TABLE 17 VCSEL MARKET: DETAILED LIST OF CONFERENCES AND EVENTS, 2024–2025
    5.12 CASE STUDY ANALYSIS 
           5.12.1 TRUMPF EMPOWERED SICK AG’S SPEETEC SENSORS WITH VCSEL DIODES FOR MODERN PRODUCTION NEEDS
           5.12.2 TRUMPF AND BOSCH SENSORTEC COLLABORATED TO DEVELOP ADVANCED VCSEL-POWERED FINE DUST DETECTION SOLUTION
           5.12.3 AMS-OSRAM AG’S LOW-POWER IR VCSEL LASER ENABLED FACE RECOGNITION IN XIAOMI MI8 EXPLORER EDITION
    5.13 STANDARDS AND REGULATORY LANDSCAPE 
           5.13.1 REGULATORY BODIES, GOVERNMENT AGENCIES, AND OTHER ORGANIZATIONS
                    TABLE 18 NORTH AMERICA: LIST OF REGULATORY BODIES, GOVERNMENT AGENCIES, AND OTHER ORGANIZATIONS
                    TABLE 19 EUROPE: LIST OF REGULATORY BODIES, GOVERNMENT AGENCIES, AND OTHER ORGANIZATIONS
                    TABLE 20 ASIA PACIFIC: LIST OF REGULATORY BODIES, GOVERNMENT AGENCIES, AND OTHER ORGANIZATIONS
                    TABLE 21 ROW: LIST OF REGULATORY BODIES, GOVERNMENT AGENCIES, AND OTHER ORGANIZATIONS
           5.13.2 REGULATORY STANDARDS
                    5.13.2.1 European Union (EU) Directives
                    5.13.2.2 AS9100D/ISO 9001
                    5.13.2.3 IATF 16949: Quality Management System for Automotive Industry
                    5.13.2.4 ISO 14001: Environmental Management System (EMS) Standard
                    5.13.2.5 IEC 60335 series
                    5.13.2.6 Import-Export Laws
           5.13.3 GOVERNMENT REGULATIONS
                    5.13.3.1 US
                    5.13.3.2 Europe
                    5.13.3.3 China
                    5.13.3.4 Japan
    5.14 PORTER’S FIVE FORCES ANALYSIS 
           TABLE 22 IMPACT OF PORTER’S FIVE FORCES ON VCSEL MARKET
           FIGURE 47 VCSEL MARKET: PORTER’S FIVE FORCES MODEL
           5.14.1 INTENSITY OF COMPETITIVE RIVALRY
           5.14.2 BARGAINING POWER OF SUPPLIERS
           5.14.3 BARGAINING POWER OF BUYERS
           5.14.4 THREAT OF SUBSTITUTES
           5.14.5 THREAT OF NEW ENTRANTS
    5.15 KEY STAKEHOLDERS AND BUYING CRITERIA 
           5.15.1 KEY STAKEHOLDERS IN BUYING PROCESS
                    FIGURE 48 INFLUENCE OF STAKEHOLDERS ON BUYING PROCESS FOR TOP THREE VERTICALS
                    TABLE 23 INFLUENCE OF STAKEHOLDERS ON BUYING PROCESS FOR TOP THREE VERTICALS
           5.15.2 BUYING CRITERIA
                    FIGURE 49 KEY BUYING CRITERIA FOR TOP THREE VERTICALS
                    TABLE 24 KEY BUYING CRITERIA FOR TOP THREE VERTICALS
 
6 VCSEL FABRICATION METHODS (Page No. - 113)
    6.1 INTRODUCTION 
    6.2 SELECTIVE OXIDIZATION 
    6.3 ION IMPLANTATION 
 
7 APPLICATIONS OF VCSEL TECHNOLOGY IN SMARTPHONES (Page No. - 115)
    7.1 INTRODUCTION 
    7.2 DOT PROJECTOR 
    7.3 TIME-OF-FLIGHT (TOF) 
           7.3.1 PROXIMITY SENSING
    7.4 FLOOD ILLUMINATOR 
 
8 VCSEL MARKET, BY TYPE (Page No. - 117)
    8.1 INTRODUCTION 
           FIGURE 50 MULTIMODE VCSELS TO BE SIGNIFICANTLY LARGER TYPE MARKET DURING FORECAST PERIOD
           TABLE 25 VCSEL MARKET, BY TYPE, 2020–2023 (USD MILLION)
           TABLE 26 VCSEL MARKET, BY TYPE, 2024–2029 (USD MILLION)
    8.2 SINGLE-MODE 
           8.2.1 MINIMAL LATENCY AND LONG-RANGE COMMUNICATION REQUIREMENTS OFFERED BY SINGLE-MODE VCSELS WITHIN DATA CENTER OPERATIONS
                    TABLE 27 SINGLE-MODE VCSEL MARKET, BY MATERIAL, 2020–2023 (USD MILLION)
                    TABLE 28 SINGLE-MODE VCSEL MARKET, BY MATERIAL, 2024–2029 (USD MILLION)
                    TABLE 29 SINGLE-MODE VCSEL MARKET, BY WAVELENGTH, 2020–2023 (USD MILLION)
                    TABLE 30 SINGLE-MODE VCSEL MARKET, BY WAVELENGTH, 2024–2029 (USD MILLION)
    8.3 MULTIMODE 
           8.3.1 INCREASE IN ADOPTION OF MULTIMODE VCSELS IN HIGH POWER APPLICATIONS
                    TABLE 31 MULTIMODE VCSEL MARKET, BY MATERIAL, 2020–2023 (USD MILLION)
                    TABLE 32 MULTIMODE VCSEL MARKET, BY MATERIAL, 2024–2029 (USD MILLION)
                    TABLE 33 MULTIMODE VCSEL MARKET, BY WAVELENGTH, 2020–2023 (USD MILLION)
                    TABLE 34 MULTIMODE: VCSEL MARKET, BY WAVELENGTH, 2024–2029 (USD MILLION)
 
9 VCSEL MARKET, BY WAVELENGTH (Page No. - 124)
    9.1 INTRODUCTION 
           FIGURE 51 NEAR-INFRARED (NIR) TO BE DOMINANT SEGMENT AMONG WAVELENGTHS DURING FORECAST PERIOD
           TABLE 35 VCSEL MARKET, BY WAVELENGTH, 2020–2023 (USD MILLION)
           TABLE 36 VCSEL MARKET, BY WAVELENGTH, 2024–2029 (USD MILLION)
    9.2 RED 
           9.2.1 ENHANCED SCANNING AND TRACKING CAPABILITIES HELPFUL IN PRINTING AND IMAGING TECHNOLOGIES
                    TABLE 37 RED VCSEL MARKET, BY TYPE, 2020–2023 (USD MILLION)
                    TABLE 38 RED VCSEL MARKET, BY TYPE, 2024–2029 (USD MILLION)
    9.3 NEAR-INFRARED (NIR) 
           9.3.1 RISE IN DEMAND FOR NEAR-INFRARED VCSELS IN ADAS
                    TABLE 39 NIR VCSEL MARKET, BY TYPE, 2020–2023 (USD MILLION)
                    TABLE 40 NIR VCSEL MARKET, BY TYPE, 2024–2029 (USD MILLION)
    9.4 SHORTWAVE INFRARED (SWIR) 
           9.4.1 FOCUS ON HIGH-VOLUME MANUFACTURE OF SWIR VCSELS TO MEET DEMAND IN SMARTPHONE APPLICATIONS
                    TABLE 41 SWIR VCSEL MARKET, BY TYPE, 2020–2023 (USD MILLION)
                    TABLE 42 SWIR VCSEL MARKET, BY TYPE, 2024–2029 (USD MILLION)
 
10 VCSEL MARKET, BY MATERIAL (Page No. - 129)
     10.1 INTRODUCTION 
             FIGURE 52 GALLIUM ARSENIDE (GAAS) TO BE MATERIAL MOST UTILIZED IN VCSEL MANUFACTURE DURING FORECAST PERIOD
             TABLE 43 VCSEL MARKET, BY MATERIAL, 2020–2023 (USD MILLION)
             TABLE 44 VCSEL MARKET, BY MATERIAL, 2024–2029 (USD MILLION)
     10.2 GALLIUM ARSENIDE (GAAS) 
             10.2.1 HIGH PERFORMANCE AND THERMAL CONDUCTIVITY OFFERED BY GAAS MATERIAL
                        TABLE 45 GAAS-BASED VCSEL MARKET, BY TYPE, 2020–2023 (USD MILLION)
                        TABLE 46 GAAS-BASED VCSEL MARKET, BY TYPE, 2024–2029 (USD MILLION)
     10.3 INDIUM PHOSPHIDE (INP) 
             10.3.1 RISE IN ADOPTION OF INP VCSELS FOR HIGH-SPEED OPTICAL COMMUNICATIONS AND DATA CENTERS
                        TABLE 47 INP-BASED VCSEL MARKET, BY TYPE, 2020–2023 (USD MILLION)
                        TABLE 48 INP-BASED VCSEL MARKET, BY TYPE, 2024–2029 (USD MILLION)
     10.4 OTHER MATERIALS 
             TABLE 49 OTHER MATERIAL-BASED VCSEL MARKET, BY TYPE, 2020–2023 (USD MILLION)
             TABLE 50 OTHER MATERIAL-BASED VCSEL MARKET, BY TYPE, 2024–2029 (USD MILLION)
 
11 VCSEL MARKET, BY APPLICATION (Page No. - 135)
     11.1 INTRODUCTION 
             FIGURE 53 SENSING APPLICATIONS TO BE DOMINANT MARKET DURING FORECAST PERIOD
             TABLE 51 VCSEL MARKET, BY APPLICATION, 2020–2023 (USD MILLION)
             TABLE 52 VCSEL MARKET, BY APPLICATION, 2024–2029 (USD MILLION)
     11.2 SENSING 
             11.2.1 3D SENSING
                        11.2.1.1 ToF Camera
                                     11.2.1.1.1 Proximity Sensing
                                                    11.2.1.1.1.1 Increase in adoption of proximity sensors in smartphones
                        11.2.1.2 Structured light illumination
                                     11.2.1.2.1 Increase in adoption of facial recognition technologies in smart devices
                        11.2.1.3 Facial & gesture recognition
                                     11.2.1.3.1 Increase in adoption of biometric technologies in smart devices
             11.2.2 GAS SENSING
                        11.2.2.1 Adoption of single-mode VCSELs for gas sensing in industrial environment
             11.2.3 OPTICAL MICE
                        11.2.3.1 Advancements in VCSEL technology in optical mice aimed at enhanced precision and efficiency
     11.3 DATA COMMUNICATION 
             11.3.1 OPTICAL TRANSCEIVERS & ACTIVE OPTICAL CABLES
                        11.3.1.1 Demand for high-data-rate optical components in data centers
     11.4 INDUSTRIAL HEATING AND LASER PRINTING 
             11.4.1 ADDITIVE MANUFACTURING
                        11.4.1.1 Implementation of VCSEL heating to reduce thermal gradient in additive manufacturing
             11.4.2 LASER PRINTING
                        11.4.2.1 Enhanced precision and higher resolution outputs offered
     11.5 EMERGING & OTHER APPLICATIONS 
             11.5.1 LIDAR
                        11.5.1.1 Developments in autonomous vehicles to create opportunities for applications of VCSELs in automotive LiDAR
             11.5.2 IN-CABIN SENSING
                        11.5.2.1 Innovations in vehicle infotainment systems
             11.5.3 ATOMIC CLOCK & GPS
                        11.5.3.1 Preference for compact and low-cost solutions for use in atomic clocks
             11.5.4 MAGNETOMETER
                        11.5.4.1 Highly accurate detection of magnetic fields made possible with use of VCSEL-based magnetometers
             11.5.5 INFRARED ILLUMINATION FOR SURVEILLANCE
                        11.5.5.1 Demand for improved performance and visibility in security and surveillance applications to fuel adoption of VCSELs
             11.5.6 PULSE OXIMETRY
                        11.5.6.1 Rise in demand for VCSELs in pulse oximetry driven by critical healthcare needs
 
12 VCSEL MARKET, BY DATA RATE (Page No. - 145)
     12.1 INTRODUCTION 
             FIGURE 54 VCSELS WITH ABOVE 25 GBPS TO GROW AT HIGHEST CAGR DURING FORECAST PERIOD
             TABLE 53 VCSEL MARKET FOR DATA COMMUNICATION, BY DATA RATE, 2020–2023 (USD MILLION)
             TABLE 54 VCSEL MARKET FOR DATA COMMUNICATION, BY DATA RATE, 2024–2029 (USD MILLION)
     12.2 UP TO 10 GBPS 
             12.2.1 GROWTH IN DEMAND FOR UP TO 10 GBPS VCSELS IN SHORT-RANGE DATA COMMUNICATION APPLICATIONS
           TABLE 55 VCSELS WITH DATA RATES OF UP TO 10 GBPS
     12.3 10.1 TO 25 GBPS 
             12.3.1 HIGH-SPEED DATA DEMANDS DRIVE GROWTH OF 10.1 TO 25 GBPS VCSEL MARKET ACROSS DATA CENTERS AND 5G NETWORKS
           TABLE 56 VCSELS WITH DATA RATES OF 10.1 TO 25 GBPS
     12.4 ABOVE 25 GBPS 
             12.4.1 CRUCIAL FOR APPLICATIONS DEMANDING HIGHEST DATA RATES, SUCH AS HYPERSCALE DATA CENTERS AND 5G BACKHAUL
           TABLE 57 VCSELS WITH DATA RATES OF ABOVE 25 GBPS
 
13 VCSEL MARKET, BY VERTICAL (Page No. - 151)
     13.1 INTRODUCTION 
             FIGURE 55 ADOPTION OF VCSELS IN CONSUMER ELECTRONICS VERTICAL TO ACCOUNT FOR MARKEDLY LARGE SEGMENT DURING FORECAST PERIOD
             TABLE 58 VCSEL MARKET, BY VERTICAL, 2020–2023 (USD MILLION)
             TABLE 59 VCSEL MARKET, BY VERTICAL, 2024–2029 (USD MILLION)
             TABLE 60 VCSEL MARKET, BY VERTICAL, 2020–2023 (MILLION UNITS)
             TABLE 61 VCSEL MARKET, BY VERTICAL, 2024–2029 (MILLION UNITS)
     13.2 CONSUMER ELECTRONICS 
             13.2.1 RISE IN DEMAND FOR ENHANCED SECURITY AND USER EXPERIENCE INCLUDING FACIAL AND GESTURE RECOGNITION
                        TABLE 62 VCSEL MARKET IN CONSUMER ELECTRONICS VERTICAL, BY REGION, 2020–2023 (USD MILLION)
                        TABLE 63 VCSEL MARKET IN CONSUMER ELECTRONICS VERTICAL, BY REGION, 2024–2029 (USD MILLION)
                        TABLE 64 NORTH AMERICA: VCSEL MARKET IN CONSUMER ELECTRONICS VERTICAL, BY COUNTRY, 2020–2023 (USD MILLION)
                        TABLE 65 NORTH AMERICA: VCSEL MARKET IN CONSUMER ELECTRONICS VERTICAL, BY COUNTRY, 2024–2029 (USD MILLION)
                        TABLE 66 EUROPE: VCSEL MARKET IN CONSUMER ELECTRONICS VERTICAL, BY COUNTRY, 2020–2023 (USD MILLION)
                        TABLE 67 EUROPE: VCSEL MARKET IN CONSUMER ELECTRONICS VERTICAL, BY COUNTRY, 2024–2029 (USD MILLION)
                        TABLE 68 ASIA PACIFIC: VCSEL MARKET IN CONSUMER ELECTRONICS VERTICAL, BY COUNTRY, 2020–2023 (USD MILLION)
                        TABLE 69 ASIA PACIFIC: VCSEL MARKET IN CONSUMER ELECTRONICS VERTICAL, BY COUNTRY, 2024–2029 (USD MILLION)
                        TABLE 70 ROW: VCSEL MARKET IN CONSUMER ELECTRONICS VERTICAL, BY REGION, 2020–2023 (USD THOUSAND)
                        TABLE 71 ROW: VCSEL MARKET IN CONSUMER ELECTRONICS VERTICAL, BY REGION, 2024–2029 (USD THOUSAND)
     13.3 DATA CENTER 
             13.3.1 INCREASE IN DATA BANDWIDTH IN DATA CENTERS TO DRIVE DEMAND FOR VCSELS
                        TABLE 72 VCSEL MARKET IN DATA CENTER VERTICAL, BY REGION, 2020–2023 (USD MILLION)
                        TABLE 73 VCSEL MARKET IN DATA CENTER VERTICAL, BY REGION, 2024–2029 (USD MILLION)
                        TABLE 74 NORTH AMERICA: VCSEL MARKET IN DATA CENTER VERTICAL, BY COUNTRY, 2020–2023 (USD MILLION)
                        TABLE 75 NORTH AMERICA: VCSEL MARKET IN DATA CENTER VERTICAL, BY COUNTRY, 2024–2029 (USD MILLION)
                        TABLE 76 EUROPE: VCSEL MARKET IN DATA CENTER VERTICAL, BY COUNTRY, 2020–2023 (USD MILLION)
                        TABLE 77 EUROPE: VCSEL MARKET IN DATA CENTER VERTICAL, BY COUNTRY, 2024–2029 (USD MILLION)
                        TABLE 78 ASIA PACIFIC: VCSEL MARKET IN DATA CENTER VERTICAL, BY COUNTRY, 2020–2023 (USD MILLION)
                        TABLE 79 ASIA PACIFIC: VCSEL MARKET IN DATA CENTER VERTICAL, BY COUNTRY, 2024–2029 (USD MILLION)
                        TABLE 80 ROW: VCSEL MARKET IN DATA CENTER VERTICAL, BY REGION, 2020–2023 (USD THOUSAND)
                        TABLE 81 ROW: VCSEL MARKET IN DATA CENTER VERTICAL, BY REGION, 2024–2029 (USD THOUSAND)
     13.4 AUTOMOTIVE 
             13.4.1 GROWTH IN ADOPTION OF VCSELS IN AUTOMOTIVE LIDAR
                        TABLE 82 VCSEL MARKET IN AUTOMOTIVE VERTICAL, BY REGION, 2020–2023 (USD MILLION)
                        TABLE 83 VCSEL MARKET IN AUTOMOTIVE VERTICAL, BY REGION, 2024–2029 (USD MILLION)
                        TABLE 84 NORTH AMERICA: VCSEL MARKET IN AUTOMOTIVE VERTICAL, BY COUNTRY, 2020–2023 (USD THOUSAND)
                        TABLE 85 NORTH AMERICA: VCSEL MARKET IN AUTOMOTIVE VERTICAL, BY COUNTRY, 2024–2029 (USD THOUSAND)
                        TABLE 86 EUROPE: VCSEL MARKET IN AUTOMOTIVE VERTICAL, BY COUNTRY, 2020–2023 (USD THOUSAND)
                        TABLE 87 EUROPE: VCSEL MARKET IN AUTOMOTIVE VERTICAL, BY COUNTRY, 2024–2029 (USD THOUSAND)
                        TABLE 88 ASIA PACIFIC: VCSEL MARKET IN AUTOMOTIVE VERTICAL, BY COUNTRY, 2020–2023 (USD THOUSAND)
                        TABLE 89 ASIA PACIFIC: VCSEL MARKET IN AUTOMOTIVE VERTICAL, BY COUNTRY, 2024–2029 (USD THOUSAND)
                        TABLE 90 ROW: VCSEL MARKET IN AUTOMOTIVE VERTICAL, BY REGION, 2020–2023 (USD THOUSAND)
                        TABLE 91 ROW: VCSEL MARKET IN AUTOMOTIVE VERTICAL, BY REGION, 2024–2029 (USD THOUSAND)
     13.5 COMMERCIAL & INDUSTRIAL 
             13.5.1 ESPOUSAL OF VCSELS ACROSS VARIOUS INDUSTRIAL APPLICATIONS INVOLVING DIFFERENT THERMAL PROCESSES
                        TABLE 92 VCSEL MARKET IN COMMERCIAL & INDUSTRIAL VERTICAL, BY REGION, 2020–2023 (USD MILLION)
                        TABLE 93 VCSEL MARKET IN COMMERCIAL & INDUSTRIAL VERTICAL, BY REGION, 2024–2029 (USD MILLION)
                        TABLE 94 NORTH AMERICA: VCSEL MARKET IN COMMERCIAL & INDUSTRIAL VERTICAL, BY COUNTRY, 2020–2023 (USD MILLION)
                        TABLE 95 NORTH AMERICA: VCSEL MARKET IN COMMERCIAL & INDUSTRIAL VERTICAL, BY COUNTRY, 2024–2029 (USD MILLION)
                        TABLE 96 EUROPE: VCSEL MARKET IN COMMERCIAL & INDUSTRIAL VERTICAL, BY COUNTRY, 2020–2023 (USD MILLION)
                        TABLE 97 EUROPE: VCSEL MARKET IN COMMERCIAL & INDUSTRIAL VERTICAL, BY COUNTRY, 2024–2029 (USD MILLION)
                        TABLE 98 ASIA PACIFIC: VCSEL MARKET IN COMMERCIAL & INDUSTRIAL VERTICAL, BY COUNTRY, 2020–2023 (USD MILLION)
                        TABLE 99 ASIA PACIFIC: VCSEL MARKET IN COMMERCIAL & INDUSTRIAL VERTICAL, BY COUNTRY, 2024–2029 (USD MILLION)
                        TABLE 100 ROW: VCSEL MARKET IN COMMERCIAL & INDUSTRIAL VERTICAL, BY REGION, 2020–2023 (USD THOUSAND)
                        TABLE 101 ROW: VCSEL MARKET IN COMMERCIAL & INDUSTRIAL VERTICAL, BY REGION, 2024–2029 (USD THOUSAND)
     13.6 HEALTHCARE 
             13.6.1 HIGH ADOPTION IN SCANNING AND IMAGING APPLICATIONS ACROSS HEALTHCARE INDUSTRY
                        TABLE 102 VCSEL MARKET IN HEALTHCARE VERTICAL, BY REGION, 2020–2023 (USD MILLION)
                        TABLE 103 VCSEL MARKET IN HEALTHCARE VERTICAL, BY REGION, 2024–2029 (USD MILLION)
                        TABLE 104 NORTH AMERICA: VCSEL MARKET IN HEALTHCARE VERTICAL, BY COUNTRY, 2020–2023 (USD THOUSAND)
                        TABLE 105 NORTH AMERICA: VCSEL MARKET IN HEALTHCARE VERTICAL, BY COUNTRY, 2024–2029 (USD THOUSAND)
                        TABLE 106 EUROPE: VCSEL MARKET IN HEALTHCARE VERTICAL, BY COUNTRY, 2020–2023 (USD THOUSAND)
                        TABLE 107 EUROPE: VCSEL MARKET IN HEALTHCARE VERTICAL, BY COUNTRY, 2024–2029 (USD THOUSAND)
                        TABLE 108 ASIA PACIFIC: VCSEL MARKET IN HEALTHCARE VERTICAL, BY COUNTRY, 2020–2023 (USD THOUSAND)
                        TABLE 109 ASIA PACIFIC: VCSEL MARKET IN HEALTHCARE VERTICAL, BY COUNTRY, 2024–2029 (USD THOUSAND)
                        TABLE 110 ROW: VCSEL MARKET IN HEALTHCARE VERTICAL, BY REGION, 2020–2023 (USD THOUSAND)
                        TABLE 111 ROW: VCSEL MARKET IN HEALTHCARE VERTICAL, BY REGION, 2024–2029 (USD THOUSAND)
     13.7 MILITARY 
             13.7.1 HIGHER DEMAND FOR VCSELS IN MODERN MILITARY OPERATIONS
                        TABLE 112 VCSEL MARKET IN MILITARY VERTICAL, BY REGION, 2020–2023 (USD MILLION)
                        TABLE 113 VCSEL MARKET IN MILITARY VERTICAL, BY REGION, 2024–2029 (USD MILLION)
                        TABLE 114 NORTH AMERICA: VCSEL MARKET IN MILITARY VERTICAL, BY COUNTRY, 2020–2023 (USD THOUSAND)
                        TABLE 115 NORTH AMERICA: VCSEL MARKET IN MILITARY VERTICAL, BY COUNTRY, 2024–2029 (USD THOUSAND)
                        TABLE 116 EUROPE: VCSEL MARKET IN MILITARY VERTICAL, BY COUNTRY, 2020–2023 (USD THOUSAND)
                        TABLE 117 EUROPE: VCSEL MARKET IN MILITARY VERTICAL, BY COUNTRY, 2024–2029 (USD THOUSAND)
                        TABLE 118 ASIA PACIFIC: VCSEL MARKET IN MILITARY VERTICAL, BY COUNTRY, 2020–2023 (USD THOUSAND)
                        TABLE 119 ASIA PACIFIC: VCSEL MARKET IN MILITARY VERTICAL, BY COUNTRY, 2024–2029 (USD THOUSAND)
                        TABLE 120 ROW: VCSEL MARKET IN MILITARY VERTICAL, BY REGION, 2020–2023 (USD THOUSAND)
                        TABLE 121 ROW: VCSEL MARKET IN MILITARY VERTICAL, BY REGION, 2024–2029 (USD THOUSAND)
 
14 VCSEL MARKET, BY REGION (Page No. - 176)
     14.1 INTRODUCTION 
             FIGURE 56 VCSEL MARKET IN ASIA PACIFIC TO GROW AT HIGHEST CAGR DURING FORECAST PERIOD
             TABLE 122 VCSEL MARKET, BY REGION, 2020–2023 (USD MILLION)
             TABLE 123 VCSEL MARKET, BY REGION, 2024–2029 (USD MILLION)
     14.2 NORTH AMERICA 
             14.2.1 NORTH AMERICA: RECESSION IMPACT ON VCSEL MARKET
                        FIGURE 57 NORTH AMERICA: VCSEL MARKET SNAPSHOT
                        FIGURE 58 US TO ACCOUNT FOR LARGEST MARKET IN NORTH AMERICA IN 2024 AND 2029
                        TABLE 124 NORTH AMERICA: VCSEL MARKET, BY COUNTRY, 2020–2023 (USD MILLION)
                        TABLE 125 NORTH AMERICA: VCSEL MARKET, BY COUNTRY, 2024–2029 (USD MILLION)
                        TABLE 126 US: VCSEL MARKET, BY VERTICAL, 2020–2023 (USD MILLION)
                        TABLE 127 US: VCSEL MARKET, BY VERTICAL, 2024–2029 (USD MILLION)
                        TABLE 128 CANADA: VCSEL MARKET, BY VERTICAL, 2020–2023 (USD MILLION)
                        TABLE 129 CANADA: VCSEL MARKET, BY VERTICAL, 2024–2029 (USD MILLION)
                        TABLE 130 MEXICO: VCSEL MARKET, BY VERTICAL, 2020–2023 (USD MILLION)
                        TABLE 131 MEXICO: VCSEL MARKET, BY VERTICAL, 2024–2029 (USD MILLION)
             14.2.2 US
                        14.2.2.1 Proliferation of smartphones in US
             14.2.3 CANADA
                        14.2.3.1 Rise in investment in data center infrastructure development in Canada
             14.2.4 MEXICO
                        14.2.4.1 Increase in adoption of VCSELs in automobile, aerospace, and consumer electronics in Mexico
     14.3 EUROPE 
             14.3.1 EUROPE: RECESSION IMPACT ON VCSEL MARKET
                        FIGURE 59 EUROPE: VCSEL MARKET SNAPSHOT
                        FIGURE 60 GERMANY TO BE LARGEST EUROPEAN MARKET FOR VCSELS IN 2024 AND 2029
                        TABLE 132 EUROPE: VCSEL MARKET, BY COUNTRY, 2020–2023 (USD MILLION)
                        TABLE 133 EUROPE: VCSEL MARKET, BY COUNTRY, 2024–2029 (USD MILLION)
                        TABLE 134 UK: VCSEL MARKET, BY VERTICAL, 2020–2023 (USD MILLION)
                        TABLE 135 UK: VCSEL MARKET, BY VERTICAL, 2024–2029 (USD MILLION)
                        TABLE 136 GERMANY: VCSEL MARKET, BY VERTICAL, 2020–2023 (USD MILLION)
                        TABLE 137 GERMANY: VCSEL MARKET, BY VERTICAL, 2024–2029 (USD MILLION)
                        TABLE 138 FRANCE: VCSEL MARKET, BY VERTICAL, 2020–2023 (USD MILLION)
                        TABLE 139 FRANCE: VCSEL MARKET, BY VERTICAL, 2024–2029 (USD MILLION)
                        TABLE 140 REST OF EUROPE: VCSEL MARKET, BY VERTICAL, 2020–2023 (USD MILLION)
                        TABLE 141 REST OF EUROPE: VCSEL MARKET, BY VERTICAL, 2024–2029 (USD MILLION)
             14.3.2 UK
                        14.3.2.1 Notable presence of large-scale telecom service providers in UK
             14.3.3 GERMANY
                        14.3.3.1 Flourishing automotive manufacturing industry in Germany
             14.3.4 FRANCE
                        14.3.4.1 Expansion of telecom infrastructure in France
             14.3.5 REST OF EUROPE
     14.4 ASIA PACIFIC 
             14.4.1 ASIA PACIFIC: RECESSION IMPACT ON VCSEL MARKET
                        FIGURE 61 ASIA PACIFIC: VCSEL MARKET SNAPSHOT
                        FIGURE 62 CHINA TO BE LARGEST MARKET IN ASIA PACIFIC IN 2024 AND 2029
                        TABLE 142 ASIA PACIFIC: VCSEL MARKET, BY COUNTRY, 2020–2023 (USD MILLION)
                        TABLE 143 ASIA PACIFIC: VCSEL MARKET, BY COUNTRY, 2024–2029 (USD MILLION)
                        TABLE 144 CHINA: VCSEL MARKET, BY VERTICAL, 2020–2023 (USD MILLION)
                        TABLE 145 CHINA: VCSEL MARKET, BY VERTICAL, 2024–2029 (USD MILLION)
                        TABLE 146 JAPAN: VCSEL MARKET, BY VERTICAL, 2020–2023 (USD MILLION)
                        TABLE 147 JAPAN: VCSEL MARKET, BY VERTICAL, 2024–2029 (USD MILLION)
                        TABLE 148 SOUTH KOREA: VCSEL MARKET, BY VERTICAL, 2020–2023 (USD MILLION)
                        TABLE 149 SOUTH KOREA: VCSEL MARKET, BY VERTICAL, 2024–2029 (USD MILLION)
                        TABLE 150 REST OF ASIA PACIFIC: VCSEL MARKET, BY VERTICAL, 2020–2023 (USD MILLION)
                        TABLE 151 REST OF ASIA PACIFIC: VCSEL MARKET, BY VERTICAL, 2024–2029 (USD MILLION)
             14.4.2 CHINA
                        14.4.2.1 Presence of large smartphone manufacturers in China
             14.4.3 JAPAN
                        14.4.3.1 Booming automotive and industrial sectors in Japan
             14.4.4 SOUTH KOREA
                        14.4.4.1 Demand from technologically advanced consumer electronics and telecom industries in South Korea
             14.4.5 REST OF ASIA PACIFIC
     14.5 REST OF THE WORLD (ROW) 
             14.5.1 ROW: RECESSION IMPACT ON VCSEL MARKET
                        FIGURE 63 SOUTH AMERICA TO DOMINATE ROW VCSEL MARKET IN 2024 AND 2029
                        TABLE 152 ROW: VCSEL MARKET, BY REGION, 2020–2023 (USD MILLION)
                        TABLE 153 ROW: VCSEL MARKET, BY REGION, 2024–2029 (USD MILLION)
                        TABLE 154 SOUTH AMERICA: VCSEL MARKET, BY VERTICAL, 2020–2023 (USD THOUSAND)
                        TABLE 155 SOUTH AMERICA: VCSEL MARKET, BY VERTICAL, 2024–2029 (USD THOUSAND)
                        TABLE 156 MIDDLE EAST: VCSEL MARKET, BY VERTICAL, 2020–2023 (USD THOUSAND)
                        TABLE 157 MIDDLE EAST: VCSEL MARKET, BY VERTICAL, 2024–2029 (USD THOUSAND)
                        TABLE 158 AFRICA: VCSEL MARKET, BY VERTICAL, 2020–2023 (USD THOUSAND)
                        TABLE 159 AFRICA: VCSEL MARKET, BY VERTICAL, 2024–2029 (USD THOUSAND)
             14.5.2 MIDDLE EAST
                        14.5.2.1 Increase in defense spending in Middle East
                        14.5.2.2 GCC Countries
                                     14.5.2.2.1 Rise in healthcare investments in GCC Countries
                        14.5.2.3 Rest of Middle East
             14.5.3 AFRICA
                        14.5.3.1 Expansion of mobile technology in Africa
             14.5.4 SOUTH AMERICA
                        14.5.4.1 Expansion of data centers in South America
 
15 COMPETITIVE LANDSCAPE (Page No. - 206)
     15.1 OVERVIEW 
     15.2 KEY STRENGTHS/RIGHT TO WIN 
             TABLE 160 VCSEL MARKET: OVERVIEW OF STRATEGIES DEPLOYED BY KEY PLAYERS, 2019–2024
     15.3 REVENUE ANALYSIS 
             FIGURE 64 VCSEL MARKET: REVENUE ANALYSIS OF TOP FIVE PLAYERS, 2021–2023 (USD MILLION)
     15.4 MARKET SHARE ANALYSIS 
             FIGURE 65 VCSEL MARKET SHARE ANALYSIS, 2023
             TABLE 161 VCSEL MARKET: DEGREE OF COMPETITION, 2023
     15.5 COMPANY VALUATION AND FINANCIAL METRICS 
             FIGURE 66 COMPANY VALUATION, 2024 (USD BILLION)
             FIGURE 67 FINANCIAL METRICS (EV/EBITDA), 2024
     15.6 BRAND/PRODUCT COMPARISON 
             FIGURE 68 BRAND/PRODUCT COMPARISON
     15.7 COMPANY EVALUATION MATRIX: KEY PLAYERS, 2023 
             15.7.1 STARS
             15.7.2 EMERGING LEADERS
             15.7.3 PERVASIVE PLAYERS
             15.7.4 PARTICIPANTS
                        FIGURE 69 VCSEL MARKET: COMPANY EVALUATION MATRIX (KEY PLAYERS), 2023
             15.7.5 COMPANY FOOTPRINT: KEY PLAYERS, 2023
                        15.7.5.1 Company footprint
                                     FIGURE 70 COMPANY FOOTPRINT, 2023
                        15.7.5.2 Type footprint
                                     TABLE 162 VCSEL MARKET: TYPE FOOTPRINT, 2023
                        15.7.5.3 Wavelength footprint
                                     TABLE 163 VCSEL MARKET: WAVELENGTH FOOTPRINT, 2023
                        15.7.5.4 Material footprint
                                     TABLE 164 VCSEL MARKET: MATERIAL FOOTPRINT, 2023
                        15.7.5.5 Application footprint
                                     TABLE 165 VCSEL MARKET: APPLICATION FOOTPRINT, 2023
                        15.7.5.6 Data Rate footprint
                                     TABLE 166 VCSEL MARKET: DATA RATE FOOTPRINT, 2023
                        15.7.5.7 Vertical footprint
                                     TABLE 167 VCSEL MARKET: VERTICAL FOOTPRINT, 2023
                        15.7.5.8 Region footprint
                                     TABLE 168 VCSEL MARKET: REGION FOOTPRINT, 2023
     15.8 COMPANY EVALUATION MATRIX: STARTUPS/SMES, 2023 
             15.8.1 PROGRESSIVE COMPANIES
             15.8.2 RESPONSIVE COMPANIES
             15.8.3 DYNAMIC COMPANIES
             15.8.4 STARTING BLOCKS
                        FIGURE 71 VCSEL MARKET: COMPANY EVALUATION MATRIX (STARTUPS/SMES), 2023
             15.8.5 COMPETITIVE BENCHMARKING: STARTUPS/SMES, 2023
                        15.8.5.1 List of key startups/SMEs
                                     TABLE 169 VCSEL MARKET: DETAILED LIST OF KEY STARTUPS/SMES, 2023
                        15.8.5.2 Competitive benchmarking of key startups/SMEs
                                     TABLE 170 VCSEL MARKET: COMPETITIVE BENCHMARKING OF KEY STARTUPS/SMES, BY TYPE, 2023
                                     TABLE 171 VCSEL MARKET: COMPETITIVE BENCHMARKING OF KEY STARTUPS/SMES, BY WAVELENGTH, 2023
                                     TABLE 172 VCSEL MARKET: COMPETITIVE BENCHMARKING OF KEY STARTUPS/SMES, BY APPLICATION, 2023
                                     TABLE 173 VCSEL MARKET: COMPETITIVE BENCHMARKING OF KEY STARTUPS/SMES, BY VERTICAL, 2023
                                     TABLE 174 VCSEL MARKET: COMPETITIVE BENCHMARKING OF KEY STARTUPS/SMES, BY REGION, 2023
     15.9 COMPETITIVE SCENARIOS AND TRENDS 
             15.9.1 PRODUCT LAUNCHES
                        TABLE 175 VCSEL MARKET: PRODUCT LAUNCHES, FEBRUARY 2019–MARCH 2024
             15.9.2 DEALS
                        TABLE 176 VCSEL MARKET: DEALS, MARCH 2018–NOVEMBER 2023
 
16 COMPANY PROFILES (Page No. - 242)
     16.1 KEY PLAYERS 
     (Business Overview, Products/Services/Solutions Offered, Recent Developments, MnM View, Key Strengths and Right to Win, Strategic Choices Made, Weaknesses and Competitive Threats)*  
             16.1.1 COHERENT CORP.
                        TABLE 177 COHERENT CORP.: BUSINESS OVERVIEW
                        FIGURE 72 COHERENT CORP.: COMPANY SNAPSHOT
                        TABLE 178 COHERENT CORP.: PRODUCTS/SERVICES/SOLUTIONS OFFERED
                        TABLE 179 COHERENT CORP.: PRODUCT LAUNCHES
                        TABLE 180 COHERENT CORP.: DEALS
             16.1.2 LUMENTUM OPERATIONS LLC
                        TABLE 181 LUMENTUM OPERATIONS LLC: BUSINESS OVERVIEW
                        FIGURE 73 LUMENTUM OPERATIONS LLC: COMPANY SNAPSHOT
                        TABLE 182 LUMENTUM OPERATIONS LLC: PRODUCTS/SERVICES/SOLUTIONS OFFERED
                        TABLE 183 LUMENTUM OPERATIONS LLC: PRODUCT LAUNCHES
                        TABLE 184 LUMENTUM OPERATIONS LLC: DEALS
             16.1.3 AMS-OSRAM AG
                        TABLE 185 AMS-OSRAM AG: BUSINESS OVERVIEW
                        FIGURE 74 AMS-OSRAM AG: COMPANY SNAPSHOT
                        TABLE 186 AMS-OSRAM AG: PRODUCTS/SERVICES/SOLUTIONS OFFERED
                        TABLE 187 AMS-OSRAM AG: PRODUCT LAUNCHES
                        TABLE 188 AMS-OSRAM AG: DEALS
             16.1.4 TRUMPF
                        TABLE 189 TRUMPF: BUSINESS OVERVIEW
                        FIGURE 75 TRUMPF: COMPANY SNAPSHOT
                        TABLE 190 TRUMPF: PRODUCTS/SERVICES/SOLUTIONS OFFERED
                        TABLE 191 TRUMPF: PRODUCT LAUNCHES
                        TABLE 192 TRUMPF: DEALS
                        TABLE 193 TRUMPF: EXPANSIONS
             16.1.5 BROADCOM
                        TABLE 194 BROADCOM: BUSINESS OVERVIEW
                        FIGURE 76 BROADCOM: COMPANY SNAPSHOT
                        TABLE 195 BROADCOM: PRODUCTS/SERVICES/SOLUTIONS OFFERED
                        TABLE 196 BROADCOM: PRODUCT LAUNCHES
                        TABLE 197 BROADCOM: DEALS
             16.1.6 MKS INSTRUMENTS
                        TABLE 198 MKS INSTRUMENTS: BUSINESS OVERVIEW
                        FIGURE 77 MKS INSTRUMENTS: COMPANY SNAPSHOT
                        TABLE 199 MKS INSTRUMENTS: PRODUCTS/SERVICES/SOLUTIONS OFFERED
                        TABLE 200 MKS INSTRUMENTS: PRODUCT LAUNCHES
                        TABLE 201 MKS INSTRUMENTS: DEALS
             16.1.7 SANTEC HOLDINGS CORPORATION
                        TABLE 202 SANTEC HOLDINGS CORPORATION: BUSINESS OVERVIEW
                        FIGURE 78 SANTEC HOLDINGS CORPORATION: COMPANY SNAPSHOT
                        TABLE 203 SANTEC HOLDINGS CORPORATION: PRODUCTS/SERVICES/SOLUTIONS OFFERED
                        TABLE 204 SANTEC HOLDINGS CORPORATION: PRODUCT LAUNCHES
                                     16.1.7.3.2 Deals
                                                    TABLE 205 SANTEC HOLDINGS CORPORATION: DEALS
             16.1.8 LEONARDO ELECTRONICS US INC.
                        TABLE 206 LEONARDO ELECTRONICS US INC.: BUSINESS OVERVIEW
                        TABLE 207 LEONARDO ELECTRONICS US INC.: PRODUCTS/SERVICES/SOLUTIONS OFFERED
                        TABLE 208 LEONARDO ELECTRONICS US INC.: PRODUCT LAUNCHES
                        TABLE 209 LEONARDO ELECTRONICS US INC.: DEALS
             16.1.9 VERTILAS GMBH
                        TABLE 210 VERTILAS GMBH: BUSINESS OVERVIEW
                        TABLE 211 VERTILAS GMBH: PRODUCTS/SERVICES/SOLUTIONS OFFERED
             16.1.10 VERTILITE
                        TABLE 212 VERTILITE: BUSINESS OVERVIEW
                        TABLE 213 VERTILITE: PRODUCTS/SERVICES/SOLUTIONS OFFERED
                        TABLE 214 VERTILITE: DEALS
*Business Overview, Products/Services/Solutions Offered, Recent Developments, MnM View, Key Strengths and Right to Win, Strategic Choices Made, Weaknesses and Competitive Threats might not be captured in case of unlisted companies.  
     16.2 OTHER PLAYERS 
             16.2.1 SONY SEMICONDUCTOR SOLUTIONS CORPORATION
             16.2.2 ALIGHT TECHNOLOGIES APS
             16.2.3 TELEDYNE FLIR LLC
             16.2.4 INNEOS LLC
             16.2.5 IQE PLC
             16.2.6 THORLABS, INC.
             16.2.7 TT ELECTRONICS
             16.2.8 USHIO AMERICA, INC.
             16.2.9 WIN SEMICONDUCTORS
             16.2.10 FRANKFURT LASER COMPANY
             16.2.11 INPHENIX, INC.
             16.2.12 BANDWIDTH10
             16.2.13 ZHEJIANG RAYSEA TECHNOLOGY CO., LTD.
             16.2.14 WUHAN QIANMU LASER CO., LTD.
             16.2.15 OCTLIGHT
             16.2.16 SANAN IC
             16.2.17 BRIGHTLASER LTD.
 
17 APPENDIX (Page No. - 300)
     17.1 DISCUSSION GUIDE 
     17.2 KNOWLEDGESTORE: MARKETSANDMARKETS’ SUBSCRIPTION PORTAL 
     17.3 CUSTOMIZATION OPTIONS 
     17.4 RELATED REPORTS 
     17.5 AUTHOR DETAILS 


The study involved four major activities in estimating the size for VCSEL market. Exhaustive secondary research was done to collect information on the market, peer market, and parent market. The next step was to validate these findings, assumptions, and sizing with industry experts across value chains through primary research. The bottom-up approach was employed to estimate the overall market size. After that, market breakdown and data triangulation were used to estimate the market size of segments and subsegments.

Secondary Research

In the secondary research process, various sources such as press releases, annual reports, investor presentations of companies, articles, and white papers by recognized authors were referred to. Secondary research was done to obtain key information about the market’s value chain, supply chain, pool of key players, and segmentation according to industry trends, regions, and developments from both technology and market perspectives.

Primary Research

Extensive primary research has been conducted after acquiring knowledge about the VCSEL market scenario through secondary research. Several primary interviews have been conducted with market experts from both the demand and supply sides across four major geographies: North America, Europe, Asia Pacific, and RoW (the Middle East, Africa, and South America). Approximately 60% and 40% of primary interviews were conducted with both the supply and demand sides, respectively. This primary data has been collected through emails, questionnaires, and telephonic interviews.

VCSEL Market
 Size, and Share

To know about the assumptions considered for the study, download the pdf brochure

Market Size Estimation

In the complete market engineering process, both top-down and bottom-up approaches, along with several data triangulation methods, have been used to perform the market size estimation and forecasting for the overall market segments and subsegments listed in this report. Extensive qualitative and quantitative analyses have been conducted on the complete market engineering process to list the key information/insights throughout the report.

The key players in the market have been identified through secondary research, and their market shares in the respective regions have been determined through primary and secondary research. This entire procedure includes the study of annual and financial reports of the top players as well as extensive interviews with industry experts (such as CEOs, VPs, directors, and marketing executives) for key insights (both quantitative and qualitative) on the VCSEL market. All percentage shares, splits, and breakdowns have been determined using secondary sources and verified through primary sources. All the possible parameters that affect the markets covered in this research study have been accounted for, viewed in extensive detail, verified through primary research, and analyzed to get the final quantitative and qualitative data. This data has been consolidated and supplemented with detailed inputs and analysis from MarketsandMarkets and presented in this report.

VCSEL Market: Bottom-Up Approach

VCSEL Market
 Size, and Bottom-Up Approach

The bottom-up procedure has been employed to arrive at the overall size of the VCSEL market. From the revenues of the key players (companies), the size of the VCSEL market has been estimated at the first stage. The market has been further narrowed to obtain splits for various VCSEL types, wavelengths, materials, applications, data rates, industries, and regions. These splits have been validated through primary interviews with industry stakeholders and subject-matter experts.

VCSEL Market: Top-Down Approach

VCSEL Market
 Size, and Top-Down Approach

In the top-down approach, the overall market size was used to estimate the size of individual markets (mentioned in the market segmentation) through percentage splits obtained from secondary and primary research. For the calculation of the size of specific market segments, the size of the most appropriate parent market was considered to implement the top-down approach. The bottom-up approach was also implemented for data extracted from secondary research to validate the market size of different segments.

The market share of each company was estimated to verify the revenue share used in the bottom-up approach earlier. With data triangulation and data validation through primaries, the size of the parent market and each segment was determined and confirmed in this study. The data triangulation procedure used for this study has been explained in the next section.

Data Triangulation

After arriving at the overall size of the VCSEL market through the process explained above, the overall market has been split into several segments. To complete the overall market engineering process and arrive at the exact statistics for all the segments, data triangulation procedures have been employed wherever applicable. The data has been triangulated by studying various factors and trends from both the demand and supply sides. The market has also been validated using both top-down and bottom-up approaches.

Definition

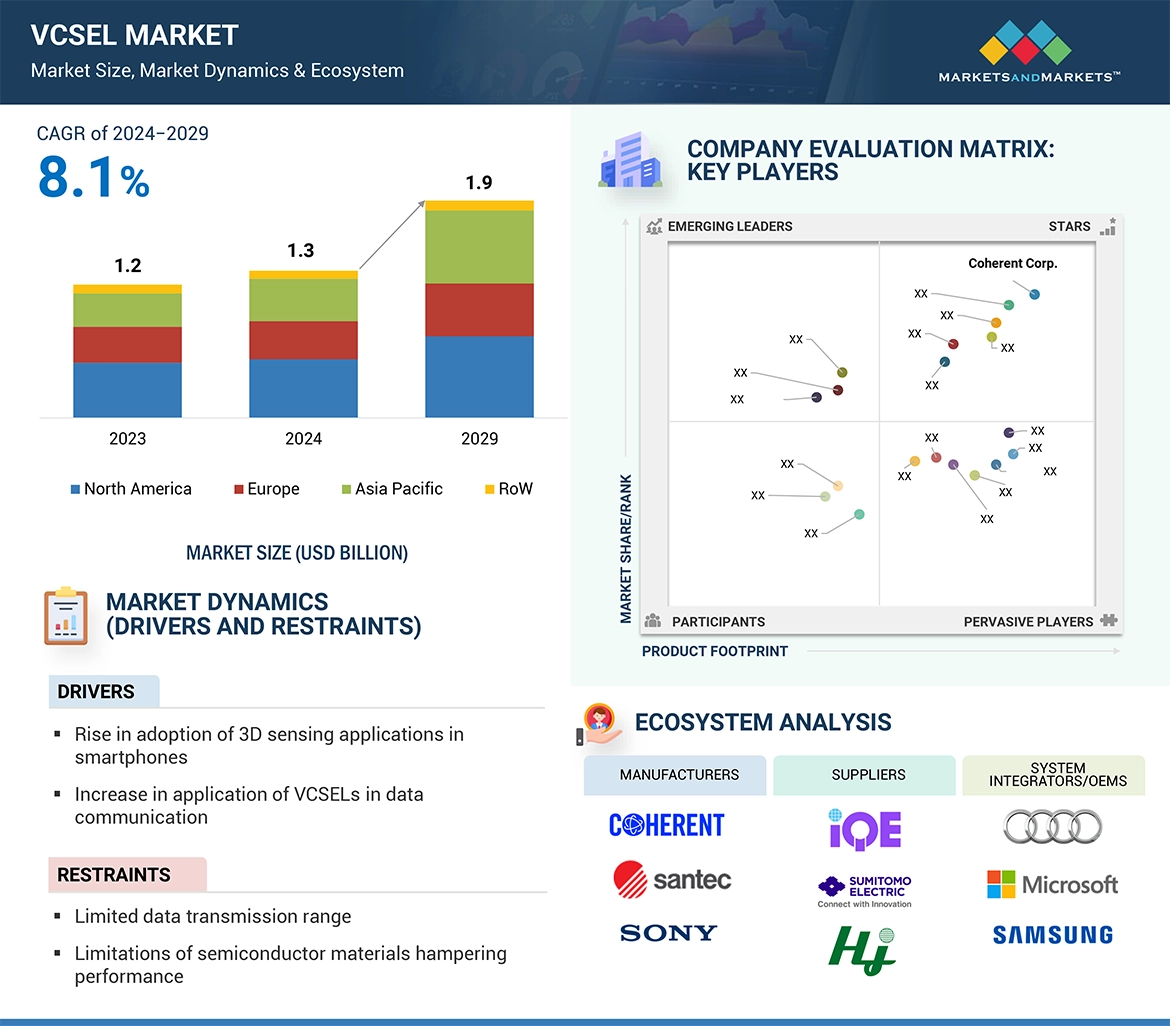
A vertical-cavity surface-emitting laser (VCSEL) is a monolithic semiconductor laser diode in which the laser beam is emitted perpendicularly/vertically to its top surface. VCSELs are made of gallium arsenide (GaAs) and indium phosphide (InP) with single-mode and multimode functionalities. VCSELs are highly efficient and cost-effective for use in various applications, such as data communication and 3D sensing. The increasing application of 3D sensing in smartphones is projected to be a significant factor driving the growth of the VCSEL market.

Key Stakeholders

  • Raw material & wafer suppliers
  • Foundry & fabless players
  • Integrated device manufacturers (IDMS)
  • VCSEL manufacturers
  • Equipment providers
  • Original equipment manufacturers (OEMS)
  • Assembling, testing, and packaging vendors
  • Technology, service, and solution providers
  • Suppliers and distributors
  • Government and other regulatory bodies
  • Research institutes and organizations
  • Market research and consulting firms

Report Objectives

  • To define, describe, segment, and forecast the size of the VCSEL market, in terms of value, based on type, material, wavelength, application, data rate, vertical, and region
  • To forecast the market size, in terms of value, for various segments with respect to four main regions, namely, North America, Europe, Asia Pacific, and the Rest of the World (RoW)
  • To define, describe, segment, and forecast the size of the VCSEL market, in terms of volume, based on vertical
  • To provide detailed information regarding drivers, restraints, opportunities, and challenges influencing the growth of the market
  • To provide an ecosystem analysis, case study analysis, patent analysis, technology analysis, pricing analysis, Porter’s five forces analysis, investment and funding scenario, and regulations pertaining to the market
  • To provide a detailed overview of the value chain analysis of the VCSEL ecosystem
  • To strategically analyze micro markets with regard to individual growth trends, prospects, and contributions to the total market
  • To analyze opportunities for stakeholders by identifying high-growth segments of the market
  • To strategically profile the key players, comprehensively analyze their market positions in terms of ranking and core competencies, and provide a competitive landscape of the market
  • To analyze strategic approaches such as product launches, acquisitions, agreements, and partnerships in the VCSEL market
  • To study and analyze the impact of the recession on the VCSEL market

Available Customizations

With the given market data, MarketsandMarkets offers customizations according to the company’s specific needs. The following customization options are available for the report:

Company Information

  • Detailed analysis and profiling of additional market players (up to 7)
Custom Market Research Services

We will customize the research for you, in case the report listed above does not meet with your exact requirements. Our custom research will comprehensively cover the business information you require to help you arrive at strategic and profitable business decisions.

Request Customization

Instant Answers with GPT - Ask Now!

Ask real questions. Get complete answers !
Report Code
SE 3835
Published ON
Jul, 2024
Choose License Type
BUY NOW
  • SHARE
X
Request Customization
Speak to Analyst
Speak to Analyst
OR FACE-TO-FACE MEETING
PERSONALIZE THIS RESEARCH
  • Triangulate with your Own Data
  • Get Data as per your Format and Definition
  • Gain a Deeper Dive on a Specific Application, Geography, Customer or Competitor
  • Any level of Personalization
REQUEST A FREE CUSTOMIZATION
LET US HELP YOU!
  • What are the Known and Unknown Adjacencies Impacting the VCSEL Market
  • What will your New Revenue Sources be?
  • Who will be your Top Customer; what will make them switch?
  • Defend your Market Share or Win Competitors
  • Get a Scorecard for Target Partners
CUSTOMIZED WORKSHOP REQUEST
  • Call Us
  • +1-888-600-6441 (Corporate office hours)
  • +1-888-600-6441 (US/Can toll free)
  • +44-800-368-9399 (UK office hours)
CONNECT WITH US
ABOUT TRUST ONLINE
©2024 MarketsandMarkets Research Private Ltd. All rights reserved
DMCA.com Protection Status Website Feedback