1 Introduction (Page No. - 18)
1.1 Objectives of the Study
1.2 Market Definition
1.3 Market Scope
1.4
Years Considered for the Study
1.5 Currency Considered
1.6
Stakeholders
2 Research Methodology (Page No. - 22)
2.1 Research Data
2.1.1 Secondary
Data
2.1.2 Primary
Data
2.1.2.1 Breakup of
Primaries
2.1.2.2 Key Industry Insights
2.2 Market Size Estimation
2.3 Market
Forecast
2.4 Competitive Leadership Mapping Research Methodology
2.5
Research Assumptions and Limitations
2.5.1
Assumptions for the Study
2.5.2 Limitations of the
Study
3 Executive Summary (Page No. - 31)
4 Premium Insights (Page No. - 36)
4.1 Attractive Market Opportunities in the
Fleet Management Market
4.2 Market By Component, 2018
4.3 Market By
Solution, 2015–2023
4.4 Market By Service, 2018 vs 2023
4.5 Market By
Deployment Type, 2018–2023
4.6 Market By Fleet Type, 2018–2023
4.7
Market Investment Scenario
5 Market Overview and Industry Trends (Page No. - 40)
5.1 Introduction
5.2 Market Dynamics
5.2.1
Drivers
5.2.1.1 Fleet Owners’ Increasing Focus on Operational
Efficiency
5.2.1.2 Growing Adoption of Cloud Computing and Big Data Analytics Solutions for Streamlining Fleet Management
Operations
5.2.1.3 Declining Hardware and IoT Connectivity Costs Leading to Increased Deployment of Fleet Management
Solutions
5.2.1.4 Strict Government Mandates Creating New Revenue Streams for
Vendors
5.2.2
Opportunities
5.2.2.1 Harnessing Telematics Data for Making Informed Business
Decisions
5.2.2.2 Green Fleet Initiatives for Reducing the Environmental Impact and Ensuring Efficient Functioning of
Fleets
5.2.2.3 Introduction of Autonomous Fleets to Provide Multiple Partnership
Opportunities
5.2.3
Challenges
5.2.3.1 Driver Safety and Productivity Affecting Vehicle
Uptime
5.2.3.2 Inaccurate
Geocoding
5.2.3.3 Blind Spots in the Network
Coverage
5.2.3.4 Rapidly Growing Data Volumes and Increasing Cyber Threats
5.3 Industry Trends
5.3.1 Unfulfilled
Services
5.3.2 Future Trends
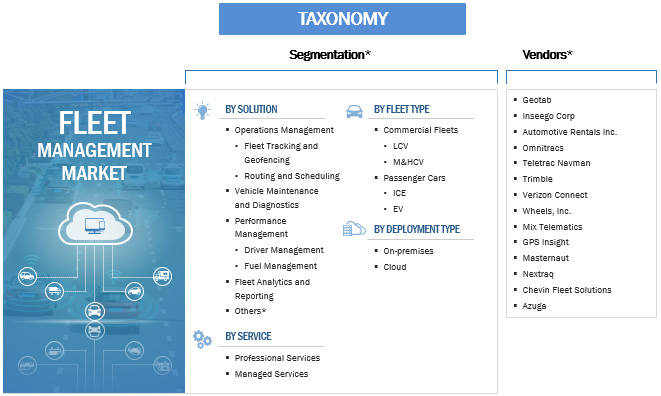
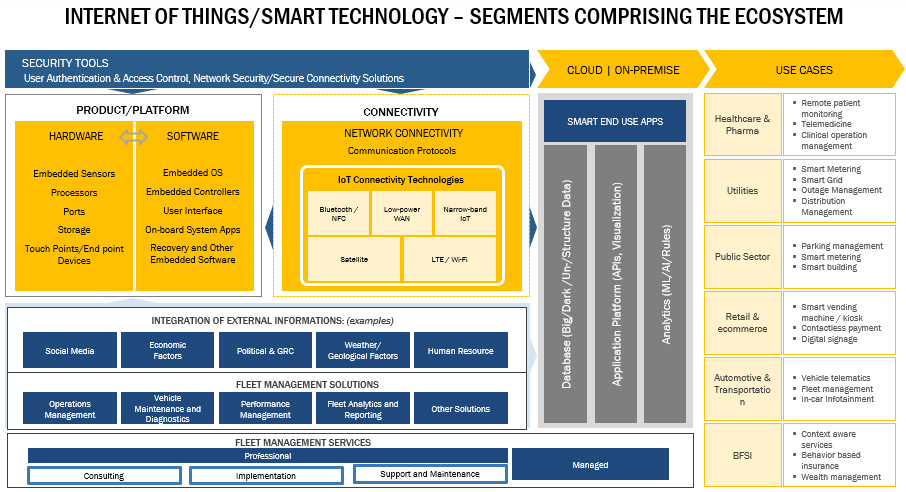
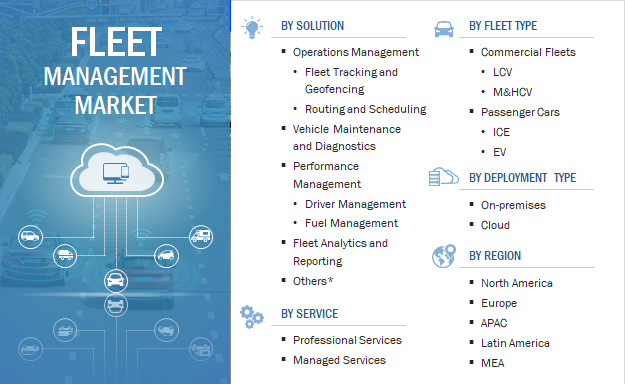
6 Fleet Management Market, By Component (Page No. - 47)
6.1 Introduction
6.2 Solutions
6.2.1
Operations
Management
6.2.1.1 Fleet Tracking and
Geofencing
6.2.1.1.1 Idle Time Monitoring of Drivers Helps in Increasing
Productivity
6.2.1.2 Routing and
Scheduling
6.2.1.2.1 Efficient Routing Helps in Minimizing the Fuel Consumption Leading to Improved
Efficiency
6.2.2 Vehicle Maintenance and
Diagnostics
6.2.2.1 Proactive Maintenance and Proper Scheduling Reduces the Vehicle
Downtime
6.2.3 Performance
Management
6.2.3.1 Driver
Management
6.2.3.1.1 Driver Management Leads to Faster Delivery and Improved Vehicle
Utilization
6.2.3.2 Fuel
Management
6.2.3.2.1 Fuel Management to Support Fleet Performance Optimization and Help Maintain Environmental
Sustainability
6.2.4 Fleet Analytics and
Reporting
6.2.4.1 Real-Time Analytics Help Optimize Fleet Management Operations By Decreasing Vehicle Downtime and Reducing
Fuel Consumption
6.2.5 Others
6.3 Services
6.3.1 Professional
Services
6.3.1.1
Consulting
6.3.1.1.1 Consulting Helps in Effective Utilization of Time and Resources Through Proper Analysis of Impacting
Factors
6.3.1.2
Implementation
6.3.1.2.1 Implementation Services to Witness the Highest Growth in Asia
Pacific
6.3.1.3 Support and
Maintenance
6.3.1.3.1 Rapid Deployment of Solutions Leading to Increased Requirement for Support and Maintenance
Services
6.3.2 Managed
Services
6.3.2.1 Managed Services Help Reduce Cost, Provide In-Time Delivery, and Decrease Complexities
7 Fleet Management Market Size, By Deployment Type (Page No. - 65)
7.1
Introduction
7.2 On-Premises
7.2.1 On-Premises Deployment Ensures Full Control Over the Infrastructure But is Expensive
7.3
Cloud
7.3.1 Cost Effectiveness and Flexibility
Provided By Cloud-Based Deployment Leading to Increased Adoption of Cloud-Based Fleet Management Solutions and
Services
8 Fleet Management Market, By Fleet Type (Page No. - 69)
8.1 Introduction
8.2 Commercial Fleets
8.2.1
Light Commercial
Vehicles
8.2.1.1 North America is the Largest Contributor of Fleet Management in the LCV
Segment
8.2.2 Medium and Heavy Commercial
Vehicles
8.2.2.1 Fleet Management in M&HCV to Grow at the Highest Rate in APAC
8.3 Passenger Cars
8.3.1 Internal Combustion
Engine
8.3.1.1 The Adoption Ice-Based Vehicles to Witness A Gradual Decline During the Forecast
Period
8.3.2 Electric
Vehicles
8.3.2.1 Electric Vehicles to Witness A Rapid Adoption During the Forecast Period
9 Fleet Management Market, By Region (Page No. - 76)
9.1 Introduction
9.2 North America
9.2.1
United
States
9.2.1.1 Adoption of Latest Fleet Management Solutions By Fleet Managers to Drive the Growth of Fleet Management in
the US
9.2.2
Canada
9.2.2.1 Increasing Acquisitions of Companies in Canada By Major Fleet Management Players to Drive the Market Growth
in Canada
9.3 Europe
9.3.1
United
Kingdom
9.3.1.1 Integration of Telematics By Organizations in Their Fleet Businesses to Drive the Growth of the Market in
This Region
9.3.2
Germany
9.3.2.1 Implementation of Euro 6 Emission Standards Set By the European Union to Hamper the Growth of the Market in
Germany
9.3.3 Rest of Europe
9.4 Asia Pacific
9.4.1
China
9.4.1.1 Increase in Corporate Fleet Sales Across the Country to Drive the Growth of the Market in
China
9.4.2
Japan
9.4.2.1 Advent of Electric Vehicles/Hybrid Cars to Drive the Market in
Japan
9.4.3 Rest of Asia
Pacific
9.5 Latin America
9.5.1
Brazil
9.5.1.1 Security and Theft Protection Regulation in Brazil to Drive the Growth of the Market in
Brazil
9.5.2
Mexico
9.5.2.1 Lack of Knowledge of Fleet Management Benefits to Impact the Growth of Fleet Management Solutions By
Organizations in Mexico
9.5.3 Rest of Latin
America
9.6 Middle East and Africa
9.6.1 Kingdom of Saudi
Arabia
9.6.1.1 Lack of Good Operational and Remarketing Structure of Fleet Management in the Country to Affect the Growth
of the Market in Kingdom of Saudi Arabia
9.6.2 South
Africa
9.6.2.1 Lack of Technology Infrastructure and Political Instability to Affect the Growth of the Fleet Management
Market in South Africa
9.6.3 Rest of MEA
10 Competitive Landscape (Page No. - 109)
10.1 Competitive Leadership
Mapping
10.1.1 Visionary
Leaders
10.1.2
Innovators
10.1.3 Dynamic
Differentiators
10.1.4 Emerging
Companies
10.2 Ranking of Key Players for the Fleet Management Market, 2018
10.3 Competitive Leadership Mapping (Startup)
10.3.1 Progressive
Companies
10.3.2 Responsive
Companies
10.3.3 Dynamic
Companies
10.3.4 Starting Blocks
11 Company Profiles (Page No. - 113)
11.1 Donlen Corporation
(Business Overview, Products, Solutions & Services, Key Insights, Recent Developments, SWOT Analysis, MnM
View)*
11.2 Geotab
11.3 Inseego Corp
11.4 Automotive Rentals Inc.
11.5 Omnitracs
11.6 Teletrac Navman
11.7 Trimble
11.8 Verizon Connect
11.9 Wheels, Inc.
11.10 Mix Telematics
11.11 GPS Insight
11.12 Masternaut
11.13 Nextraq
11.14 Chevin Fleet Solutions
11.15 Azuga
*Details on Business Overview, Solutions, Products & Services, Key Insights, Recent Developments, SWOT Analysis, MnM View Might Not Be Captured in Case of Unlisted Companies.
12 Appendix (Page No. - 148)
12.1 Discussion Guide
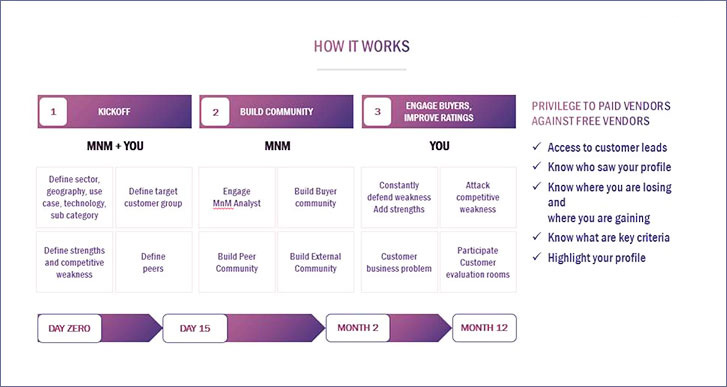
12.2 Knowledge Store: Marketsandmarkets’ Subscription Portal
12.3 Available Customization
12.4 Related Reports
12.5 Author Details
List of Tables (94 Tables)
Table 1 United States Dollar Exchange Rate, 2016–2018
Table 2 Factor Analysis
Table 3 Factors Outlining the
Unfulfilled Services in the Fleet Management Market
Table 4 Trends Shaping Up Fleet Management
Table 5 Fleet
Management Market Size, By Component, 2016–2023 (USD Million)
Table 6 Market Size By Solution, 2016–2023 (USD
Million)
Table 7 Solutions: Market Size By Region, 2016–2023 (USD Million)
Table 8 Operations Management
Market Size, By Type, 2016–2023 (USD Million)
Table 9 Operations Management Market Size, By Region, 2016–2023
(USD Million)
Table 10 Fleet Tracking and Geofencing Market Size, By Region, 2016–2023 (USD Million)
Table 11
Routing and Scheduling Market Size, By Region, 2016–2023 (USD Million)
Table 12 Vehicle Maintenance and
Diagnostics Market Size, By Region, 2016–2023 (USD Million)
Table 13 Performance Management Market Size, By Type,
2016–2023 (USD Million)
Table 14 Performance Management Market Size, By Region, 2016–2023 (USD Million)
Table
15 Driver Management Market Size, By Region, 2016–2023 (USD Million)
Table 16 Fuel Management Market Size, By
Region, 2016–2023 (USD Million)
Table 17 Fleet Analytics and Reporting Market Size, By Region, 2016–2023 (USD
Million)
Table 18 Others Market Size, By Region, 2016–2023 (USD Million)
Table 19 Services: Fleet Management
Market Size, By Type, 2016–2023 (USD Million)
Table 20 Services: Market Size By Region, 2016–2023 (USD
Million)
Table 21 Professional Services Market Size, By Type, 2016–2023 (USD Million)
Table 22 Professional
Services Market Size, By Region, 2016–2023 (USD Million)
Table 23 Consulting Market Size, By Region, 2016–2023
(USD Million)
Table 24 Implementation Market Size, By Region, 2016–2023 (USD Million)
Table 25 Support and
Maintenance Market Size, By Region, 2016–2023 (USD Million)
Table 26 Managed Services Market Size, By Region,
2016–2023 (USD Million)
Table 27 Fleet Management Market Size, By Deployment Type, 2016–2023 (USD
Million)
Table 28 On-Premises: Market Size By Region, 2016–2023 (USD Million)
Table 29 Cloud: Market Size By
Region, 2016–2023 (USD Million)
Table 30 Fleet Management Market Size, By Fleet Type, 2016–2023 (USD
Million)
Table 31 Commercial Fleets: Market Size By Type, 2016–2023 (USD Million)
Table 32 Commercial Fleets:
Market Size By Region, 2016–2023 (USD Million)
Table 33 Light Commercial Vehicles Market Size, By Region,
2016–2023 (USD Million)
Table 34 Medium and Heavy Commercial Vehicles Market Size, By Region, 2016–2023 (USD
Million)
Table 35 Passenger Cars: Market Size By Type, 2016–2023 (USD Million)
Table 36 Passenger Cars: Market
Size By Region, 2016–2023 (USD Million)
Table 37 Internal Combustion Engine Market Size, By Region, 2016–2023
(USD Million)
Table 38 Electric Vehicles Market Size, By Region, 2016–2023 (USD Million)
Table 39 Fleet
Management Market Size, By Region, 2016–2023 (USD Million)
Table 40 North America: Market Size By Component,
2016–2023 (USD Million)
Table 41 North America: Market Size By Solution, 2016–2023 (USD Million)
Table 42
North America: Operations Management Market Size, By Type, 2016–2023 (USD Million)
Table 43 North America:
Performance Management Market Size, By Type, 2016–2023 (USD Million)
Table 44 North America: Market Size By
Service, 2016–2023 (USD Million)
Table 45 North America: Market Size By Professional Service, 2016–2023 (USD
Million)
Table 46 North America: Market Size By Deployment Type, 2016–2023 (USD Million)
Table 47 North
America: Market Size By Fleet Type, 2016–2023 (USD Million)
Table 48 North America: Commercial Fleets Market
Size, By Type, 2016–2023 (USD Million)
Table 49 North America: Passenger Cars Market Size, By Type, 2016–2023
(USD Million)
Table 50 North America: Market Size By Country, 2016–2023 (USD Million)
Table 51 Europe: Fleet
Management Market Size, By Type, 2016–2023 (USD Million)
Table 52 Europe: Market Size By Solution, 2016–2023 (USD
Million)
Table 53 Europe: Operations Management Market Size, By Type, 2016–2023 (USD Million)
Table 54 Europe:
Performance Management Market Size, By Type, 2016–2023 (USD Million)
Table 55 Europe: Market Size By Service,
2016–2023 (USD Million)
Table 56 Europe: Market Size By Professional Service, 2016–2023 (USD Million)
Table 57
Europe: Market Size By Deployment Type, 2016–2023 (USD Million)
Table 58 Europe: Market Size By Fleet Type,
2016–2023 (USD Million)
Table 59 Europe: Commercial Fleets Market Size, By Type, 2016–2023 (USD Million)
Table
60 Europe: Passenger Cars Market Size, By Type, 2016–2023 (USD Million)
Table 61 Europe: Fleet Management Market
Size, By Country, 2016–2023 (USD Million)
Table 62 Asia Pacific: Market Size By Type, 2016–2023 (USD
Million)
Table 63 Asia Pacific: Market Size By Solution, 2016–2023 (USD Million)
Table 64 Asia Pacific:
Operations Management Market Size, By Type, 2016–2023 (USD Million)
Table 65 Asia Pacific: Performance Management
Market Size, By Type, 2016–2023 (USD Million)
Table 66 Asia Pacific: Market Size By Service, 2016–2023 (USD
Million)
Table 67 Asia Pacific: Market Size By Professional Service, 2016–2023 (USD Million)
Table 68 Asia
Pacific: Market Size By Deployment Type, 2016–2023 (USD Million)
Table 69 Asia Pacific: Market Size By Fleet
Type, 2016–2023 (USD Million)
Table 70 Asia Pacific: Commercial Fleets Market Size, By Type, 2016–2023 (USD
Million)
Table 71 Asia Pacific: Passenger Cars Market Size, By Type, 2016–2023 (USD Million)
Table 72 Asia
Pacific: Market Size By Country, 2016–2023 (USD Million)
Table 73 Latin America: Fleet Management Market Size, By
Type, 2016–2023 (USD Million)
Table 74 Latin America: Market Size By Solution, 2016–2023 (USD Million)
Table
75 Latin America: Operations Management Market Size, By Type, 2016–2023 (USD Million)
Table 76 Latin America:
Performance Management Market Size, By Type, 2016–2023 (USD Million)
Table 77 Latin America: Market Size By
Service, 2016–2023 (USD Million)
Table 78 Latin America: Market Size By Professional Service, 2016–2023 (USD
Million)
Table 79 Latin America: Market Size By Deployment Type, 2016–2023 (USD Million)
Table 80 Latin
America: Market Size By Fleet Type, 2016–2023 (USD Million)
Table 81 Latin America: Commercial Fleets Market
Size, By Type, 2016–2023 (USD Million)
Table 82 Latin America: Passenger Cars Market Size, By Type, 2016–2023
(USD Million)
Table 83 Latin America: Market Size By Country, 2016–2023 (USD Million)
Table 84 Middle East and
Africa: Fleet Management Market Size, By Component, 2016–2023 (USD Million)
Table 85 Middle East and Africa:
Market Size By Solution, 2016–2023 (USD Million)
Table 86 Middle East and Africa: Operations Management Market
Size, By Type, 2016–2023 (USD Million)
Table 87 Middle East and Africa: Performance Market Size, By Type,
2016–2023 (USD Million)
Table 88 Middle East and Africa: Market Size By Service, 2016–2023 (USD Million)
Table
89 Middle East and Africa: Market Size By Professional Service, 2016–2023 (USD Million)
Table 90 Middle East and
Africa: Market Size By Deployment Type, 2016–2023 (USD Million)
Table 91 Middle East and Africa: Market Size By
Fleet Type, 2016–2023 (USD Million)
Table 92 Middle East and Africa: Commercial Fleets Market Size, By Type,
2016–2023 (USD Million)
Table 93 Middle East and Africa: Passenger Cars Market Size, By Type, 2016–2023 (USD
Million)
Table 94 Middle East and Africa: Market Size By Country, 2016–2023 (USD Million)
List of Figures (34 Figures)
Figure 1 Fleet Management Market Segmentation
Figure 2 Regions Covered
Figure 3 Market Research
Design
Figure 4 Market Breakup and Data Triangulation
Figure 5 Fleet Management Market: Top-Down and Bottom-Up
Approaches
Figure 6 Competitive Leadership Mapping: Criteria Weightage
Figure 7 Competitive Leadership Mapping
(Start-Up): Criteria Weightage
Figure 8 Fleet Management Market to Witness Significant Growth During the Forecast
Period
Figure 9 Top 3 Leading Segments in the Fleet Management Market in 2018
Figure 10 Fleet Management
Regional Market Scenario
Figure 11 Strict Regulatory Mandates in North America and Europe to Drive the Market
Growth
Figure 12 Solutions Segment to Hold A Larger Market Share in the Market in 2018
Figure 13 Operations
Management Segment to Lead the Market During the Forecast Period
Figure 14 Professional Services Segment to Lead
the Market in Terms of Market Share During the Forecast Period
Figure 15 Cloud Segment to Lead the Market in
Terms of Market Share During the Forecast Period
Figure 16 Passenger Cars Segment to Lead the Market in Terms of
Market Share During the Forecast Period
Figure 17 Market Investment Scenario
Figure 18 Drivers, Opportunities,
and Challenges: Fleet Management Market
Figure 19 Solutions Segment to Hold A Higher Share in the Market During
the Forecast Period
Figure 20 Operations Management Segment to Account for the Largest Market Size in the Market
By Solution
Figure 21 Professional Services Segment to Account for A Larger Market Size During the Forecast
Period
Figure 22 Cloud Segment to Account for A Larger Market Size in 2023
Figure 23 Passenger Cars Segment to
Account for A Larger Market Size During the Forecast Period
Figure 24 North America to Account for the Largest
Market Size in the Fleet Management Market During the Forecast Period
Figure 25 Market in Asia Pacific to Grow at
the Highest CAGR During the Forecast Period
Figure 26 North America: Market Snapshot
Figure 27 Asia Pacific:
Market Snapshot
Figure 28 Fleet Management Market (Global) Competitive Leadership Mapping
Figure 29 Ranking of
Key Players, 2018
Figure 30 Startup Microquadrant
Figure 31 Inseego Corp: Company Snapshot
Figure 32
Trimble: Company Snapshot
Figure 33 Verizon Communications: Company Snapshot
Figure 34 Mix Telematics: Company
Snapshot