1 Introduction (Page No. - 23)
1.1 Objectives of the Study
1.2 Market Definition
1.3 Market Scope
1.4 Years Considered for the Study
1.5 Currency Considered
1.6 Stakeholders
2 Research Methodology (Page No. - 27)
2.1 Research Data
2.1.1 Secondary Data
2.1.2 Primary Data
2.1.2.1 Breakup of Primaries
2.1.2.2 Key Industry Insights
2.1.2.3 Key Industry Insights By Focus Area
2.2 Market Breakup and Data Triangulation
2.3 Market Size Estimation
2.4 Factor Analysis
2.5 Assumptions for the Study
2.6 Limitations of the Study
3 Executive Summary (Page No. - 37)
4 Premium Insights (Page No. - 45)
4.1 Attractive Market Opportunities in the Global Smart Cities Market
4.2 Smart Cities Market, By Focus Area, 2018
4.3 Asia Pacific: Smart Cities Market, By Smart Transportation Type and Service
4.4 Asia Pacific: Smart Cities Market, By Smart Buildings Type and Service
4.5 Asia Pacific: Smart Cities Market, By Smart Utilities Solution and Service
5 Market Overview and Industry Trends (Page No. - 49)
5.1 Introduction
5.2 Market Dynamics
5.2.1 Drivers
5.2.1.1 Need for Public Safety and Communications Infrastructure
5.2.1.2 Increasing Number of Government Initiatives and Ppp Models for Smart Cities
5.2.1.3 Growing Adoption of Connected and Smart Technologies in Smart Cities Initiatives
5.2.1.4 Optimizing the Use of Energy During Peak Hours
5.2.1.5 Citizen Empowerment and Engagement
5.2.2 Restraints
5.2.2.1 Privacy and Security Concerns
5.2.2.2 Lack of Standardized and Uniform Technology
5.2.2.3 Poor Operational Efficiency in Developing Countries
5.2.2.4 Lack of Technology Advancement in Developing Economies
5.2.3 Opportunities
5.2.3.1 Increasing Environmental Concerns and Demand for Green Initiatives
5.2.3.2 Developing Economies and Booming It Sectors to Promote the Smart Cities Growth
5.2.3.3 Rising Demand for System Integrators to Offer End-To-End Solutions
5.2.3.4 Growing Demand for Iot
5.2.3.5 Emerging 5G Technology
5.2.4 Challenges
5.2.4.1 Unclear Strategic Goals and Lack of Structural Kpis
5.2.4.2 Huge Initial Investments
5.2.4.3 Lack of Knowledge Among People
5.3 Value Chain Analysis
5.4 Ecosystem Analysis
5.4.1 Smart Transportation
5.4.2 Smart Buildings
5.4.3 Smart Utilities
6 Smart Transportation Market (Page No. - 60)
6.1 Introduction
6.2 Types
6.2.1 Roadways
6.2.2 Railways
6.2.3 Airways
6.3 Solutions
6.3.1 Smart Ticketing
6.3.2 Traffic Management System
6.3.2.1 Parking Management
6.3.2.2 Traffic Surveillance
6.3.3 Passenger Information Management System
6.3.4 Freight Information System
6.3.5 Connected Vehicle
6.3.6 Others
6.4 Services
6.4.1 Consulting
6.4.2 Deployment and Integration
6.4.3 Infrastructure Monitoring and Management
7 Smart Buildings Market (Page No. - 70)
7.1 Introduction
7.2 Types
7.3 Solutions
7.3.1 Building Energy Optimization
7.3.1.1 Hvac Control
7.3.1.2 Lighting Management
7.3.1.3 Energy Information Management
7.3.2 Emergency Management
7.3.2.1 Video Surveillance
7.3.2.2 Fire Protection
7.3.2.3 Environmental Control
7.3.2.4 Access Control System
7.3.3 Parking Management System
7.3.4 Others
7.4 Services
7.4.1 Consulting
7.4.2 Deployment and Integration
7.4.3 Infrastructure Monitoring and Management
8 Smart Utilities Market (Page No. - 81)
8.1 Introduction
8.2 Types
8.3 Solutions
8.3.1 Advanced Metering Infrastructure
8.3.1.1 Meter Data Management
8.3.1.2 Meter Data Analytics
8.3.1.3 Smart Meters
8.3.2 Distribution Management System
8.3.3 Substation Automation
8.3.4 Others
8.4 Services
8.4.1 Consulting
8.4.2 Deployment and Integration
8.4.3 Infrastructure Monitoring and Management
9 Smart Citizen Services Market (Page No. - 91)
9.1 Introduction
9.1.1 Smart Education
9.1.2 Smart Healthcare
9.1.3 Public Safety
9.1.4 Smart Street Lighting
10 Smart Cities Market, By Region (Page No. - 98)
10.1 Introduction
10.2 North America
10.2.1 Smart Transportation
10.2.2 Smart Buildings
10.2.3 Smart Utilities
10.2.4 Smart Citizen Services
10.2.5 North America: Use Cases
10.2.6 North America: Competitive Scenario
10.3 Europe
10.3.1 Smart Transportation
10.3.2 Smart Buildings
10.3.3 Smart Utilities
10.3.4 Smart Citizen Services
10.3.5 Europe: Use Cases
10.3.6 Europe: Competitive Scenario
10.4 Asia Pacific
10.4.1 Smart Transportation
10.4.2 Smart Buildings
10.4.3 Smart Utilities
10.4.4 Smart Citizen Services
10.4.5 Asia Pacific: Use Cases
10.4.6 Asia Pacific: Competitive Scenario
10.5 Latin America
10.5.1 Smart Transportation
10.5.2 Smart Buildings
10.5.3 Smart Utilities
10.5.4 Smart Citizen Services
10.5.5 Latin America: Use Cases
10.5.6 Latin America: Competitive Scenario
10.6 Middle East and Africa
10.6.1 Smart Transportation
10.6.2 Smart Buildings
10.6.3 Smart Utilities
10.6.4 Smart Citizen Services
10.6.5 Middle East and Africa: Use Cases
10.6.6 Middle East and Africa: Competitive Scenario
11 Competitive Landscape (Page No. - 161)
11.1 Overview
11.2 Competitive Scenario
11.2.1 Smart Transportation
11.2.1.1 Partnerships and Collaborations
11.2.1.2 Acquisitions
11.2.2 Smart Utilities
11.2.2.1 Partnerships and Collaborations
11.2.2.2 New Product Launches
11.2.2.3 Acquisitions
11.2.2.4 Business Expansions
11.2.3 Smart Buildings
11.2.3.1 Partnerships and Collaborations
11.2.3.2 New Product Launches
11.2.3.3 Acquisitions
11.2.3.4 Business Expansions
11.2.4 Smart Citizen Services
11.2.4.1 Partnerships
11.2.4.2 New Product Launches, Product Enhancements, and New Service Launches
11.2.4.3 Acquisitions
11.2.4.4 Business Expansions
12 Company Profiles (Page No. - 172)
12.1 Cisco Systems
12.1.1 Business Overview
12.1.2 Products Offered
12.1.3 Recent Developments
12.1.4 MnM View
12.2 Schneider Electric
12.2.1 Business Overview
12.2.2 Solutions Offered
12.2.3 Recent Developments
12.2.4 MnM View
12.3 IBM
12.3.1 Business Overview
12.3.2 Solutions Offered
12.3.3 Recent Developments
12.3.4 MnM View
12.4 Microsoft
12.4.1 Business Overview
12.4.2 Solutions Offered
12.4.3 Recent Developments
12.4.4 MnM View
12.5 Hitachi
12.5.1 Business Overview
12.5.2 Products Offered
12.5.3 Recent Developments
12.5.4 MnM View
12.6 Siemens AG
12.7 Huawei
12.8 NEC
12.9 Intel
12.10 Oracle
12.11 GE
12.12 AT&T
12.13 Ericsson
12.14 Nokia
12.15 Vodafone
12.16 Itron
12.17 Verizon
12.18 Toshiba Corporation
12.19 SAP SE
12.20 ABB
12.21 Alstom SA
12.22 KAPSCH Group
12.23 Honeywell
12.24 AGT International
12.25 Bentley Systems
12.26 Key Innovators
12.26.1 Smart Transportation
12.26.1.1 Veson Nautical
12.26.1.2 Bass Software
12.26.2 Smart Utilities
12.26.2.1 Aclara
12.26.2.2 Takadu
12.26.3 Smart Buildings
12.26.3.1 Flamencotech
12.26.3.2 Delta Controls
12.26.4 Smart Citizen Services
12.26.4.1 Blackboard
12.26.5 Telensa
13 Appendix (Page No. - 248)
13.1 Discussion Guide
13.2 Knowledge Store: Marketsandmarkets’ Subscription Portal
13.3 Available Customizations
13.4 Related Reports
13.5 Author Details
List of Tables (141 Tables)
Table 1 United States Dollar Exchange Rate, 2015–2017
Table 2 Factors: Impact Analysis
Table 3 Smart Transportation Market Size, By Region, 2016–2023 (USD Billion)
Table 4 Smart Transportation Market Size, By Type, 2016–2023 (USD Billion)
Table 5 Roadways: Smart Transportation Market Size, By Region, 2016–2023 (USD Billion)
Table 6 Railways: Smart Transportation Market Size, By Region, 2016–2023 (USD Billion)
Table 7 Airways: Smart Transportation Market Size, By Region, 2016–2023 (USD Billion)
Table 8 Smart Transportation Market Size, By Solution, 2016–2023 (USD Billion)
Table 9 Smart Ticketing Market Size, By Region, 2016–2023 (USD Billion)
Table 10 Traffic Management System Market Size, By Region, 2016–2023 (USD Billion)
Table 11 Passenger Information Management System Market Size, By Region, 2016–2023 (USD Billion)
Table 12 Freight Information System Market Size, By Region, 2016–2023 (USD Billion)
Table 13 Connected Vehicle Market Size, By Region, 2016–2023 (USD Billion)
Table 14 Others Smart Transportation Solutions Market Size, By Region, 2016–2023 (USD Billion)
Table 15 Traffic Management Market Size, By Solution, 2016–2023 (USD Billion)
Table 16 Smart Transportation Market Size, By Service, 2016–2023 (USD Billion)
Table 17 Consulting Market Size, By Region, 2016–2023 (USD Billion)
Table 18 Deployment and Integration Market Size, By Region, 2016–2023 (USD Billion)
Table 19 Infrastructure Monitoring and Management Market Size, By Region, 2016–2023 (USD Billion)
Table 20 Smart Building Market Size, By Region, 2016–2023 (USD Billion)
Table 21 Smart Buildings Market Size, By Type, 2016–2023 (USD Billion)
Table 22 Commercial: Smart Buildings Market Size, By Region, 2016–2023 (USD Billion)
Table 23 Residential: Smart Buildings Market Size, By Region, 2016–2023 (USD Billion)
Table 24 Smart Buildings Market Size, By Solution, 2016–2023 (USD Billion)
Table 25 Building Energy Optimization Market Size, By Region, 2016–2023 (USD Billion)
Table 26 Emergency Management Market Size, By Region, 2016–2023 (USD Billion)
Table 27 Parking Management System Market Size, By Region, 2016–2023 (USD Billion)
Table 28 Other Smart Building Solutions Market Size, By Region, 2016–2023 (USD Billion)
Table 29 Building Energy Optimization Market Size, By Type, 2016–2023 (USD Billion)
Table 30 Emergency Management Market Size, By Type, 2016–2023 (USD Billion)
Table 31 Smart Buildings Market Size, By Service, 2016–2023 (USD Billion)
Table 32 Consulting Market Size, By Region, 2016–2023 (USD Billion)
Table 33 Deployment and Integration Market Size, By Region, 2016–2023 (USD Billion)
Table 34 Infrastructure Monitoring and Management Market Size, By Region, 2016–2023 (USD Billion)
Table 35 Smart Utilities Market Size, By Region, 2016–2023 (USD Billion)
Table 36 Smart Utilities Market Size, By Type, 2016–2023 (USD Billion)
Table 37 Energy: Smart Utilities Market Size, By Region, 2016–2023 (USD Billion)
Table 38 Gas: Smart Utilities Market Size, By Region, 2016–2023 (USD Billion)
Table 39 Water: Smart Utilities Market Size, By Region, 2016–2023 (USD Billion)
Table 40 Others: Smart Utilities Market Size, By Region, 2016–2023 (USD Billion)
Table 41 Smart Utilities Market Size, By Solution, 2016–2023 (USD Billion)
Table 42 Advanced Metering Infrastructure Market Size, By Region, 2016–2023 (USD Billion)
Table 43 Distribution Management System Market Size, By Region, 2016–2023 (USD Billion)
Table 44 Substation Automation Market Size, By Region, 2016–2023 (USD Billion)
Table 45 Other Smart Utilities Solutions Market Size, By Region, 2016–2023 (USD Billion)
Table 46 Advanced Metering Infrastructure Market Size, By Type, 2016–2023 (USD Billion)
Table 47 Smart Utilities Market Size, By Service, 2016–2023 (USD Billion)
Table 48 Consulting Market Size, By Region, 2016–2023 (USD Billion)
Table 49 Deployment and Integration Market Size, By Region, 2016–2023 (USD Billion)
Table 50 Infrastructure Monitoring and Management Market Size, By Region, 2016–2023 (USD Billion)
Table 51 Smart Citizen Services Market Size, By Region, 2016–2023 (USD Billion)
Table 52 Smart Citizen Services Market Size, By Solution, 2016–2023 (USD Billion)
Table 53 Smart Public Safety Market Size, By Region, 2016–2023 (USD Billion)
Table 54 Smart Healthcare Market Size, By Region, 2016–2023 (USD Billion)
Table 55 Smart Education Market Size, By Region, 2016–2023 (USD Billion)
Table 56 Smart Street Lighting Market Size, By Region, 2016–2023 (USD Billion)
Table 57 Smart Cities Market Size, By Region, 2016–2023 (USD Billion)
Table 58 North America: Smart Cities Market Size, By Focus Area, 2016–2023 (USD Billion)
Table 59 North America: Smart Transportation Market Size, By Type, 2016–2023 (USD Billion)
Table 60 North America: Smart Transportation Market Size, By Component, 2016–2023 (USD Billion)
Table 61 North America: Smart Transportation Market Size, By Solution, 2016–2023 (USD Billion)
Table 62 North America: Smart Transportation Market Size, By Service, 2016–2023 (USD Billion)
Table 63 North America: Smart Buildings Market Size, By Type, 2016–2023 (USD Billion)
Table 64 North America: Smart Buildings Market Size, By Component, 2016–2023 (USD Billion)
Table 65 North America: Smart Buildings Market Size, By Solution, 2016–2023 (USD Billion)
Table 66 North America: Smart Buildings Market Size, By Service, 2016–2023 (USD Billion)
Table 67 North America: Smart Utilities Market Size, By Type, 2016–2023 (USD Billion)
Table 68 North America: Smart Utilities Market Size, By Component, 2016–2023 (USD Billion)
Table 69 North America: Smart Utilities Market Size, By Solution, 2016–2023 (USD Billion)
Table 70 North America: Smart Utilities Market Size, By Service, 2016–2023 (USD Billion)
Table 71 North America: Smart Citizen Services Market Size, By Solution, 2016–2023 (USD Billion)
Table 72 Europe: Smart Cities Market Size, By Focus Area, 2016–2023 (USD Billion)
Table 73 Europe: Smart Transportation Market Size, By Type, 2016–2023 (USD Billion)
Table 74 Europe: Smart Transportation Market Size, By Component, 2016–2023 (USD Billion)
Table 75 Europe: Smart Transportation Market Size, By Solution, 2016–2023 (USD Billion)
Table 76 Europe: Smart Transportation Market Size, By Service, 2016–2023 (USD Billion)
Table 77 Europe: Smart Buildings Market Size, By Type, 2016–2023 (USD Billion)
Table 78 Europe: Smart Buildings Market Size, By Component, 2016–2023 (USD Billion)
Table 79 Europe: Smart Buildings Market Size, By Solution, 2016–2023 (USD Billion)
Table 80 Europe: Smart Buildings Market Size, By Service, 2016–2023 (USD Billion)
Table 81 Europe: Smart Utilities Market Size, By Type, 2016–2023 (USD Billion)
Table 82 Europe: Smart Utilities Market Size, By Component, 2016–2023 (USD Billion)
Table 83 Europe: Smart Utilities Market Size, By Solution, 2016–2023 (USD Billion)
Table 84 Europe: Smart Utilities Market Size, By Service, 2016–2023 (USD Billion)
Table 85 Europe: Smart Citizen Services Market Size, By Solution, 2016–2023 (USD Billion)
Table 86 Asia Pacific: Smart Cities Market Size, By Focus Area, 2016–2023 (USD Billion)
Table 87 Asia Pacific: Smart Transportation Market Size, By Type, 2016–2023 (USD Billion)
Table 88 Asia Pacific: Smart Transportation Market Size, By Component, 2016–2023 (USD Billion)
Table 89 Asia Pacific: Smart Transportation Market Size, By Solution, 2016–2023 (USD Billion)
Table 90 Asia Pacific: Smart Transportation Market Size, By Service, 2016–2023 (USD Billion)
Table 91 Asia Pacific: Smart Buildings Market Size, By Type, 2016–2023 (USD Billion)
Table 92 Asia Pacific: Smart Buildings Market Size, By Component, 2016–2023 (USD Billion)
Table 93 Asia Pacific: Smart Buildings Market Size, By Solution, 2016–2023 (USD Billion)
Table 94 Asia Pacific: Smart Buildings Market Size, By Service, 2016–2023 (USD Billion)
Table 95 Asia Pacific: Smart Utilities Market Size, By Type, 2016–2023 (USD Billion)
Table 96 Asia Pacific: Smart Utilities Market Size, By Component, 2016–2023 (USD Billion)
Table 97 Asia Pacific: Smart Utilities Market Size, By Solution, 2016–2023 (USD Billion)
Table 98 Asia Pacific: Smart Utilities Market Size, By Service, 2016–2023 (USD Billion)
Table 99 Asia Pacific: Smart Citizen Services Market Size, By Solution, 2016–2023 (USD Billion)
Table 100 Latin America: Smart Cities Market Size, By Focus Area, 2016–2023 (USD Billion)
Table 101 Latin America: Smart Transportation Market Size, By Type, 2016–2023 (USD Billion)
Table 102 Latin America: Smart Transportation Market Size, By Component, 2016–2023 (USD Billion)
Table 103 Latin America: Smart Transportation Market Size, By Solution, 2016–2023 (USD Billion)
Table 104 Latin America: Smart Transportation Market Size, By Service, 2016–2023 (USD Billion)
Table 105 Latin America: Smart Buildings, By Type, 2016–2023 (USD Billion)
Table 106 Latin America: Smart Buildings Market Size, By Component, 2016–2023 (USD Billion)
Table 107 Latin America: Smart Buildings Market Size, By Solution, 2016–2023 (USD Billion)
Table 108 Latin America: Smart Buildings Market Size, By Service, 2016–2023 (USD Billion)
Table 109 Latin America: Smart Utilities Market Size, By Type, 2016–2023 (USD Billion)
Table 110 Latin America: Smart Utilities Market Size, By Component, 2016–2023 (USD Billion)
Table 111 Latin America: Smart Utilities Market Size, By Solution, 2016–2023 (USD Billion)
Table 112 Latin America: Smart Utilities Market Size, By Service, 2016–2023 (USD Billion)
Table 113 Latin America: Smart Citizen Services Market Size, By Solution, 2016–2023 (USD Billion)
Table 114 Middle East and Africa: Smart Cities Market Size, By Focus Area, 2016–2023 (USD Billion)
Table 115 Middle East and Africa: Smart Transportation Market Size, By Type, 2016–2023 (USD Billion)
Table 116 Middle East and Africa: Smart Transportation Market Size, By Component, 2016–2023 (USD Billion)
Table 117 Middle East and Africa: Smart Transportation Market Size, By Solution, 2016–2023 (USD Billion)
Table 118 Middle East and Africa: Smart Transportation Market Size, By Service, 2016–2023 (USD Billion)
Table 119 Middle East and Africa: Smart Buildings Market Size, By Type, 2016–2023 (USD Billion)
Table 120 Middle East and Africa: Smart Buildings Market Size, By Component, 2016–2023 (USD Billion)
Table 121 Middle East and Africa: Smart Buildings Market Size, By Solution, 2016–2023 (USD Billion)
Table 122 Middle East and Africa: Smart Buildings Market Size, By Service, 2016–2023 (USD Billion)
Table 123 Middle East and Africa: Smart Utilities Market Size, By Type, 2016–2023 (USD Billion)
Table 124 Middle East and Africa: Smart Utilities Market Size, By Component, 2016–2023 (USD Billion)
Table 125 Middle East and Africa: Smart Utilities Market Size, By Solution, 2016–2023 (USD Billion)
Table 126 Middle East and Africa: Smart Utilities Market Size, By Service, 2016–2023 (USD Billion)
Table 127 Middle East and Africa: Smart Citizen Services Market Size, By Solution, 2016–2023 (USD Billion)
Table 128 Partnerships and Collaborations, 2018
Table 129 Acquisitions, 2017–2018
Table 130 Partnerships and Collaborations, 2018
Table 131 New Product Launches, 2017–2018
Table 132 Acquisitions, 2018
Table 133 Business Expansions, 2018
Table 134 Partnerships and Collaborations, 2017–2018
Table 135 New Product Launches, 2018
Table 136 Acquisitions, 2018
Table 137 Business Expansions, 2017–2018
Table 138 Partnerships, 2018
Table 139 New Product Launches, Product Enhancements, and New Service Launches, 2017–2018
Table 140 Acquisitions, 2018
Table 141 Business Expansions, 2017–2018
List of Figures (113 Figures)
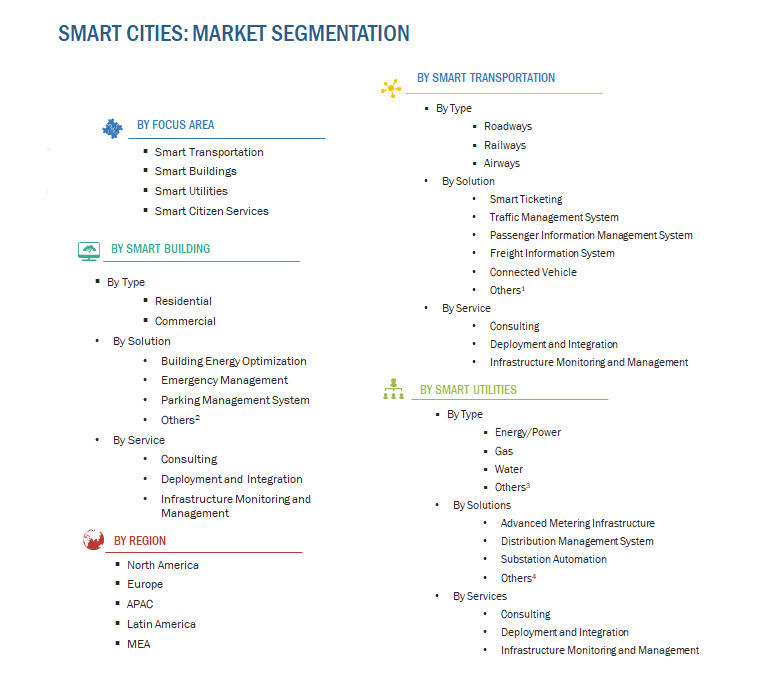
Figure 1 Smart Cities: Market Segmentation
Figure 2 Smart Cities Market: Research Design
Figure 3 Research Methodology
Figure 4 Smart Cities Market: Bottom-Up and Top-Down Approaches
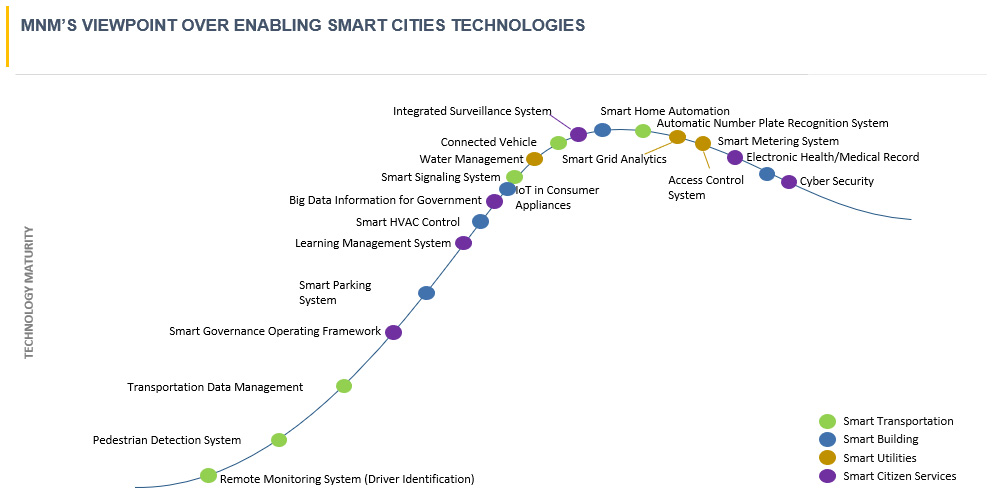
Figure 5 Smart Cities Holistic View
Figure 6 Smart Cities Growth Trend
Figure 7 Asia Pacific to Grow at the Highest Rate During the Forecast Period
Figure 8 Smart Transportation Market Size, 2018 (USD Billion)
Figure 9 Smart Buildings Regional Market Size, 2018 (USD Billion)
Figure 10 Smart Utilities Regional Market Size, 2018 (USD Billion)
Figure 11 Smart Citizen Services Regional Market Size, 2018 (USD Billion)
Figure 12 Growing Adoption of Smart Technologies to Drive the Growth of the Smart Cities Market
Figure 13 Smart Citizen Services Segment to Hold the Highest Market Share in 2018
Figure 14 Roadways, and Deployment and Integration Services to Account for the Highest Market Shares for Smart Transportation in 2018
Figure 15 Commercial, and Deployment and Integration Services to Account for the Highest Market Shares for Smart Buildings in 2018
Figure 16 Advanced Metering Infrastructure, and Deployment and Integration Services to Account for the Highest Market Shares in 2018
Figure 17 Drivers, Restraints, Opportunities, and Challenges: Smart Cities Market
Figure 18 Smart Cities Market: Value Chain Analysis
Figure 19 Smart Cities Market: Smart Transportation Ecosystem Analysis
Figure 20 Smart Cities Market: Smart Buildings Ecosystem Analysis
Figure 21 Smart Cities Market: Smart Utilities Ecosystem Analysis
Figure 22 Middle East and Africa to Grow at the Highest CAGR During the Forecast Period
Figure 23 Airways Segment to Grow at the Highest CAGR During the Forecast Period
Figure 24 Connected Vehicle Segment to Grow at the Highest CAGR During the Forecast Period
Figure 25 Parking Management Segment to Grow at A Higher CAGR During the Forecast Period
Figure 26 Deployment and Integration Segment to Grow at the Highest CAGR During the Forecast Period
Figure 27 Middle East and Africa to Grow at the Highest CAGR During the Forecast Period
Figure 28 Residential Segment to Grow at A Higher CAGR During the Forecast Period
Figure 29 Emergency Management Segment to Dominate During the Forecast Period
Figure 30 Lighting Management Segment to Grow at the Highest CAGR During the Forecast Period
Figure 31 Access Control System Segment to Grow at the Highest CAGR During the Forecast Period
Figure 32 Infrastructure Monitoring and Management Segment to Grow at the Highest Rate During the Forecast Period
Figure 33 Asia Pacific to Grow at the Highest CAGR During the Forecast Period
Figure 34 Gas Segment to Grow at the Highest CAGR During the Forecast Period
Figure 35 Distribution Management System Segment to Grow at the Highest CAGR During the Forecast Period
Figure 36 Deployment and Integration Segment to Grow at the Highest CAGR During the Forecast Period
Figure 37 Asia Pacific to Grow at the Highest CAGR During the Forecast Period
Figure 38 Smart Healthcare Segment to Grow at the Highest CAGR During the Forecast Period
Figure 39 Asia Pacific to Grow at the Highest CAGR During the Forecast Period
Figure 40 Global Smart Cities Market: Focus Areas
Figure 41 North America: Focus Areas
Figure 42 North America: Market Snapshot
Figure 43 Use Case: Public Safety and Traffic Management
Figure 44 Use Case: Smart City Project, Kansas City
Figure 45 Use Case: Smart City Project, Las Vegas
Figure 46 Use Case: Smart City Project, City of Atlanta
Figure 47 Use Case: Smart City Project, City of Chula Vista
Figure 48 Use Case: Smart City Project, City of Dallas
Figure 49 Use Case: AT&T Smart City Framework
Figure 50 Europe: Focus Areas
Figure 51 Europe: Market Snapshot
Figure 52 Use Case: Smart City Tourism
Figure 53 Use Case: Connected Street Lighting
Figure 54 Use Case: Smart City Project, Vasteras Sweden
Figure 55 Use Case: Smart City Project, Cityverve
Figure 56 Use Case: Smart City Project, Bristol, UK
Figure 57 Use Case: Steep
Figure 58 Use Case: Smart City Project, Newcastle, UK
Figure 59 Use Case: Smart City Project, Hamburg, Germany
Figure 60 Use Case: Smart Grid Project
Figure 61 Use Case: Mysmartlife
Figure 62 Use Case: Smart City Berlin 2030
Figure 63 Use Case: Smart City Project, Barcelona, Spain
Figure 64 Use Case: Smart Stadium
Figure 65 Use Case: Smart City Project, Copenhagen, Denmark
Figure 66 Asia Pacific: Focus Areas
Figure 67 Asia Pacific: Market Snapshot
Figure 68 Use Case: Smart City Project, Singapore
Figure 69 Use Case: Smart Mobility
Figure 70 Use Case: Autonomous Taxi Project
Figure 71 Use Case: Advanced Traffic Management
Figure 72 Use Case: Path Initiative
Figure 73 Use Case: Belt and Road Initiative
Figure 74 Use Case: Wireless Surveillance
Figure 75 Use Case: Video Analytics City Surveillance
Figure 76 Latin America: Focus Areas
Figure 77 Use Case: Smart City Project, Mexico
Figure 78 Use Case: Smart City Project, Medellin, Colombia
Figure 79 Middle East and Africa: Focus Areas
Figure 80 Use Case: On-Street Parking Reservation System
Figure 81 Use Case: Smart Bus Tour App
Figure 82 Use Case: Smart Parking
Figure 83 Use Case: Smart City Project, Konza City
Figure 84 Use Case: Smart City Project, Kigali, Rwanda
Figure 85 Use Case: Automatic Meter Reading
Figure 86 Use Case: Smart City Project, Accra, Ghana
Figure 87 Use Case: Smart City Project, Masdar City, UAE
Figure 88 Use Case: Smart City Project, Abu Dhabi, UAE
Figure 89 Key Developments in the Smart Cities Market (2016–2018)
Figure 90 Market Evaluation Framework, 2016–2018
Figure 91 Cisco Systems: Company Snapshot
Figure 92 Schneider Electric: Company Snapshot
Figure 93 IBM: Company Snapshot
Figure 94 Microsoft: Company Snapshot
Figure 95 Hitachi: Company Snapshot
Figure 96 Siemens AG: Company Snapshot
Figure 97 Huawei: Company Snapshot
Figure 98 NEC: Company Snapshot
Figure 99 Intel: Company Snapshot
Figure 100 Oracle: Company Snapshot
Figure 101 GE: Company Snapshot
Figure 102 AT&T: Company Snapshot
Figure 103 Ericsson: Company Snapshot
Figure 104 Nokia: Company Snapshot
Figure 105 Vodafone: Company Snapshot
Figure 106 Itron: Company Snapshot
Figure 107 Verizon: Company Snapshot
Figure 108 Toshiba Corporation: Company Snapshot
Figure 109 SAP SE: Company Snapshot
Figure 110 ABB: Company Snapshot
Figure 111 Alstom SA: Company Snapshot
Figure 112 KAPSCH Group: Company Snapshot
Figure 113 Honeywell: Company Snapshot