1 Introduction (Page No. - 21)
1.1 Study Objectives
1.2 Definition
1.3 Study Scope
1.3.1 Market Scope
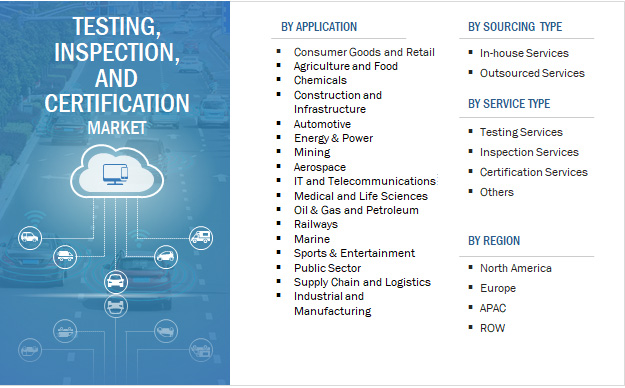
1.3.2 Markets Covered
1.3.3 Geographic Scope
1.3.4 Years Considered
1.4 Currency
1.5 Stakeholders
2 Research Methodology (Page No. - 25)
2.1 Research Data
2.1.1 Secondary Data
2.1.1.1 Data From Secondary Sources
2.1.2 Primary Data
2.1.2.1 Data From Primary Sources
2.1.2.2 Key Industry Insights
2.1.2.3 Breakdown of Primaries
2.2 Market Size Estimation
2.2.1 Bottom-Up Approach
2.2.2 Top-Down Approach
2.3 Market Breakdown and Data Triangulation
2.4 Limitations
2.5 Research Assumptions
3 Executive Summary (Page No. - 34)
4 Premium Insights (Page No. - 39)
4.1 Lucrative Opportunities in TIC Market
4.2 TIC Market, By Sourcing Type
4.3 Testing, Inspection, and Certification Market, By Service Type
4.4 TIC Market in APAC, By Application and Service Type
4.5 Testing, Inspection, and Certification Market, By Country
5 Market Overview (Page No. - 43)
5.1 Introduction
5.2 Market Dynamics
5.2.1 Drivers
5.2.1.1 Increase in Disposable Income and Rapid Urbanization in Developing Economies
5.2.1.2 High Growth in Product Recalls Across the World
5.2.1.3 High Adoption of Outsourcing Service Model By Worldwide Manufacturers
5.2.1.4 Increased Requirement for Harmonized Standards
5.2.1.5 Surge in Illicit Trading, Counterfeiting, and Piracy Practices Across the World
5.2.1.6 Enforcement of Rigorous Government Regulations and Standards Across Various Sectors
5.2.2 Restraint
5.2.2.1 Diverse Standards and Regulations Across Geographies
5.2.3 Opportunities
5.2.3.1 Growth Opportunities for Small- and Medium-Sized Businesses in the TIC Ecosystem
5.2.3.2 Consolidation of Fragmented Markets
5.2.4 Challenges
5.2.4.1 Complex Nature of Global Supply Chains
5.2.4.2 Long Lead Time for Overseas Qualification Assessments
6 Industry Trends (Page No. - 50)
6.1 Introduction
6.2 Value Chain Analysis
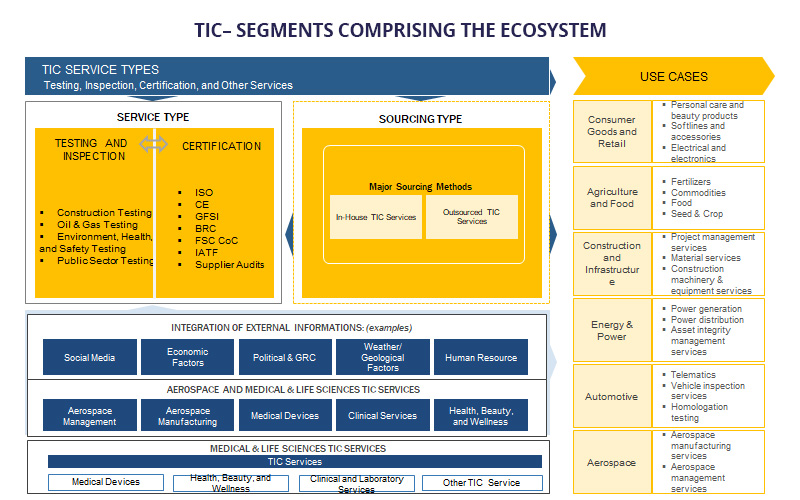
6.3 Core Industry Segments for Overall TIC Market
6.3.1.1 TIC Standards and Regulatory Bodies
6.3.1.2 Companies Offering TIC Services
6.3.1.3 End-User Industries
6.4 Key Industry Trends
6.5 Pest Analysis
6.5.1 Political Factors
6.5.2 Economic Factors
6.5.3 Social Factors
6.5.4 Technological Factors
7 TIC Market, By Service Type (Page No. - 56)
7.1 Introduction
7.2 Testing
7.3 Inspection
7.4 Certification
7.5 Others
8 TIC Market, By Sourcing Type (Page No. - 60)
8.1 Introduction
8.2 In-House Services
8.3 Outsourced Services
9 TIC Market, By Application (Page No. - 63)
9.1 Introduction
9.2 Consumer Goods and Retail
9.2.1 Personal Care and Beauty Products
9.2.2 Hard Goods
9.2.3 Softlines and Accessories
9.2.4 Toys and Juvenile Products
9.2.5 Electrical and Electronics
9.2.6 Others
9.3 Agriculture and Food
9.3.1 Seeds and Crops
9.3.2 Fertilizers
9.3.3 Commodities
9.3.4 Food
9.3.5 Forestry
9.3.6 Others
9.4 Chemicals
9.4.1 Asset Integrity Management Services
9.4.2 Project Lifecycle Services
9.4.3 Finished Product Services
9.4.4 Chemical Feedstocks Services
9.4.5 Others
9.5 Construction and Infrastructure
9.5.1 Project Management
9.5.2 Material Services
9.5.3 Construction Machinery and Equipment Services
9.5.4 Facilities Management and Inspection Services
9.5.5 Others
9.6 Energy & Power
9.6.1 Energy Sources
9.6.1.1 Nuclear
9.6.1.2 Wind
9.6.1.3 Solar
9.6.1.4 Alternative Fuels
9.6.1.5 Fuel Oils and Gases
9.6.1.6 Coal
9.6.2 Power Generation
9.6.3 Power Distribution
9.6.4 Asset Integrity Management Services
9.6.5 Project Lifecycle Services
9.6.6 Others
9.7 Industrial and Manufacturing
9.7.1 Supplier-Related Services
9.7.2 Production- and Product-Related Services
9.7.3 Project-Related Services
9.7.4 Others
9.8 Medical and Life Sciences
9.8.1 Medical Devices
9.8.2 Health, Beauty, and Wellness
9.8.3 Clinical Services
9.8.4 Laboratory Services
9.8.5 Biopharmaceutical and Pharmaceutical Services
9.8.6 Others
9.9 Mining
9.9.1 Inspection and Sampling Services
9.9.2 Analytical Services
9.9.3 Exploration Services
9.9.4 Metallurgy and Process Design Services
9.9.5 Production and Plant Services
9.9.6 Site Operations and Closure Services
9.9.7 Project Risk Assessment and Mitigation Services
9.10 Oil & Gas and Petroleum
9.10.1 Upstream
9.10.2 Downstream
9.10.3 Biofuels and Feedstock
9.10.4 Petrochemicals
9.10.5 Asset Integrity Management Services
9.10.6 Project Lifecycle Services
9.10.7 Others
9.11 Public Sector
9.11.1 Product Conformity Assessment Services
9.11.2 Monitoring Services
9.11.3 Valuation Services
9.11.4 Others
9.12 Automotive
9.12.1 Electrical Systems and Components
9.12.2 Electric Vehicles, Hybrid Electric Vehicles, and Battery Systems
9.12.3 Telematics
9.12.4 Fuels, Fluids, and Lubricants
9.12.5 Interior and Exterior Materials and Components
9.12.6 Vehicle Inspection Services (VIS)
9.12.7 Homologation Testing
9.12.8 Others
9.13 Aerospace
9.13.1 Aerospace Manufacturing Services
9.13.2 Aviation Management Services
9.13.3 Others
9.14 Marine
9.14.1 Marine Fuel Systems and Component Services
9.14.2 Ship Classification Services
9.14.3 Marine Materials and Equipment Services
9.14.4 Others
9.15 Rail
9.15.1 Rail Construction and Production Monitoring
9.15.2 Infrastructure Management
9.15.3 Others
9.16 Supply Chain and Logistics
9.16.1 Packaging & Handling
9.16.2 Risk Management
9.16.3 Others
9.17 It and Telecom
9.17.1 Telecom and It Infrastructure Equipment
9.17.2 Modules and Devices
9.18 Sports & Entertainment
9.18.1 Sports Venues and Facilities
9.18.2 Sporting Goods and Protective Equipment
10 Geographic Analysis (Page No. - 106)
10.1 Introduction
10.2 North America
10.2.1 US
10.2.2 Canada
10.2.3 Mexico
10.3 Europe
10.3.1 Germany
10.3.2 UK
10.3.3 France
10.3.4 Italy
10.3.5 Spain
10.3.6 Belgium
10.3.7 Russia
10.3.8 Hungary
10.3.9 Netherlands
10.3.10 Poland
10.3.11 Bulgaria
10.3.12 Sweden
10.3.13 Morocco
10.3.14 Switzerland
10.3.15 Norway
10.3.16 Romania
10.3.17 Greece
10.3.18 RoE
10.4 Asia Pacific
10.4.1 China
10.4.2 Japan
10.4.3 India
10.4.4 South Korea
10.4.5 Australia
10.4.6 Thailand
10.4.7 Malaysia
10.4.8 Indonesia
10.4.9 Vietnam
10.4.10 Taiwan
10.4.11 Hong Kong
10.4.12 Bangladesh
10.4.13 Philippines
10.4.14 RoAPAC
10.5 Rest of the World
10.5.1 South and Central America
10.5.1.1 South America
10.5.1.1.1 Brazil
10.5.1.1.2 Argentina
10.5.1.1.3 Peru
10.5.1.1.4 Czech Republic
10.5.1.1.5 Chile
10.5.1.1.6 Colombia
10.5.1.1.7 Venezuela
10.5.1.1.8 Rest of South America
10.5.1.2 Central America
10.5.2 Middle East and Africa (MEA)
10.5.2.1 Saudi Arabia
10.5.2.2 Iran
10.5.2.3 Iraq
10.5.2.4 UAE
10.5.2.5 Qatar
10.5.2.6 Oman
10.5.2.7 Bahrain
10.5.2.8 South Africa
10.5.2.9 Rest of Middle East and Africa
11 Competitive Landscape (Page No. - 160)
11.1 Overview
11.2 Key Players in TIC Market
11.3 Competitive Situations and Trends
11.3.1 Acquisitions
11.3.2 Expansions
11.3.3 Service Launches
11.3.4 Others
12 Company Profiles (Page No. - 169)
12.1 Introduction
12.2 Key Players
12.2.1 SGS Group
12.2.1.1 Overview
12.2.1.2 Services Offered
12.2.1.3 Recent Development
12.2.1.4 SWOT Analysis
12.2.1.5 MnM View
12.2.2 Bureau Veritas
12.2.2.1 Overview
12.2.2.2 Services Offered
12.2.2.3 Recent Development
12.2.2.4 SWOT Analysis
12.2.2.5 MnM View
12.2.3 Intertek
12.2.3.1 Overview
12.2.3.2 Services Offered
12.2.3.3 Recent Developments
12.2.3.4 SWOT Analysis
12.2.3.5 MnM View
12.2.4 Dekra Se
12.2.4.1 Overview
12.2.4.2 Services Offered
12.2.4.3 Recent Developments
12.2.4.4 SWOT Analysis
12.2.4.5 MnM View
12.2.5 Eurofins Scientific
12.2.5.1 Overview
12.2.5.2 Services Offered
12.2.5.3 Recent Developments
12.2.5.4 MnM View
12.2.6 TUV SUD
12.2.6.1 Overview
12.2.6.2 Services Offered
12.2.6.3 Recent Developments
12.2.6.4 SWOT Analysis
12.2.6.5 MnM View
12.2.7 DNV Gl
12.2.7.1 Overview
12.2.7.2 Services Offered
12.2.7.3 Recent Developments
12.2.7.4 MnM View
12.2.8 TUV Rheinland
12.2.8.1 Overview
12.2.8.2 Services Offered
12.2.8.3 Recent Developments
12.2.8.4 MnM View
12.2.9 Applus+
12.2.9.1 Overview
12.2.9.2 Services Offered
12.2.9.3 Recent Developments
12.2.9.4 MnM View
12.2.10 ALS Limited
12.2.10.1 Overview
12.2.10.2 Services Offered
12.2.10.3 Recent Developments
12.2.10.4 MnM View
12.2.11 TUV Nord Group
12.2.11.1 Overview
12.2.11.2 Services Offered
12.2.11.3 Recent Developments
12.2.11.4 MnM View
12.2.12 Lloyd’s Register Group Limited
12.2.12.1 Overview
12.2.12.2 Services Offered
12.2.12.3 Recent Developments
12.2.12.4 MnM View
12.2.13 Mistras
12.2.13.1 Overview
12.2.13.2 Services Offered
12.2.13.3 Recent Developments
12.2.13.4 MnM View
12.2.14 Element Materials Technology
12.2.14.1 Overview
12.2.14.2 Services Offered
12.2.14.3 Recent Developments
12.2.14.4 MnM View
12.2.15 Ul LLC
12.2.15.1 Overview
12.2.15.2 Services Offered
12.2.15.3 Recent Developments
12.2.15.4 MnM View
12.3 Other Important Players and Associations
12.3.1 Vde Testing Institute
12.3.2 Keystone Compliance
12.3.3 Washington Laboratories Ltd.
12.3.4 Force Technology
12.3.5 Kiwa Inspecta
12.3.6 Rina S.P.A.
12.3.7 Technická Inšpekcia
12.3.8 Türk Loydu
12.3.9 Safety Assessment Federation (SAFED)
12.3.10 HV Technologies Inc.
12.4 Key Innovators
12.4.1 Avomeen Analytical Services
12.4.2 Envigo
12.4.3 Gateway Analytical
12.4.4 Medistri Sa
13 Appendix (Page No. - 240)
13.1 Insights of Industry Experts
13.2 Discussion Guide
13.3 Knowledge Store: Marketsandmarkets’ Subscription Portal
13.4 Available Customizations
13.5 Related Reports
13.6 Author Details
List of Tables (79 Tables)
Table 1 Study Limitations
Table 2 Study Assumptions
Table 3 Comparison of Major Motor Vehicle Regulations in US and Eu
Table 4 Mergers and Acquisitions – Major Trend Among Key Market Players
Table 5 Testing, Inspection, and Certification Market, By Service Type, 2016–2024 (USD Billion)
Table 6 TIC Market, By Sourcing Type, 2016–2024 (USD Billion)
Table 7 TIC Market, By Application, 2016–2024 (USD Billion)
Table 8 Testing, Inspection, and Certification Market for Consumer Goods and Retail Applications, By Type, 2016–2024 (USD Billion)
Table 9 TIC Market for Agriculture and Food Applications, By Type, 2016–2024 (USD Billion)
Table 10 TIC Market for Chemicals Applications, By Type, 2016–2024 (USD Billion)
Table 11 TIC Market for Construction and Infrastructure Applications, By Type, 2016–2024 (USD Billion)
Table 12 TIC Market for Energy & Power Applications, By Type, 2016–2024 (USD Billion)
Table 13 TIC Market for Industrial and Manufacturing Applications, By Type, 2016–2024 (USD Billion)
Table 14 TIC Market for Medical and Life Sciences Applications, By Type, 2016–2024 (USD Billion)
Table 15 TIC Market for Mining Applications, By Type, 2016–2024 (USD Million)
Table 16 TIC Market for Oil & Gas and Petroleum Applications, By Type, 2016–2024 (USD Billion)
Table 17 Testing, Inspection, and Certification Market for Public Sector Applications, By Type, 2016–2024 (USD Million)
Table 18 TIC Market for Automotive Applications, By Type, 2016–2024 (USD Billion)
Table 19 TIC Market for Aerospace Applications, By Type, 2016–2024 (USD Billion)
Table 20 TIC Market for Marine Applications, By Type, 2016–2024 (USD Billion)
Table 21 TIC Market for Rail Applications, 2016–2024 (USD Billion)
Table 22 TIC Market for Supply Chain and Logistics Applications, By Type, 2016–2024 (USD Billion)
Table 23 TIC Market for It and Telecom Applications, By Type, 2016–2024 (USD Billion)
Table 24 TIC Market for Sports & Entertainment Applications, By Type, 2016–2024 (USD Billion)
Table 25 TIC Market, By Region, 2016–2024 (USD Billion)
Table 26 TIC Market in North America, By Country, 2016–2024 (USD Billion)
Table 27 TIC Market in US, By Application, 2016–2024 (USD Million)
Table 28 TIC Market in US, By Service Type, 2016–2024 (USD Billion)
Table 29 Testing, Inspection, and Certification Market in US, By Sourcing Type, 2016–2024 (USD Billion)
Table 30 TIC Market in Canada, By Application, 2016–2024 (USD Million)
Table 31 TIC Market in Canada, By Service Type, 2016–2024 (USD Billion)
Table 32 TIC Market in Canada, By Sourcing Type, 2016–2024 (USD Billion)
Table 33 TIC Market in Mexico, By Application, 2016–2024 (USD Million)
Table 34 TIC Market in Mexico, By Service Type, 2016–2024 (USD Billion)
Table 35 Testing, Inspection, and Certification Market in Mexico, By Sourcing Type, 2016–2024 (USD Billion)
Table 36 TIC Market in Europe, By Country, 2016–2024 (USD Million)
Table 37 TIC Market in Germany, By Application, 2016–2024 (USD Million)
Table 38 TIC Market in Germany, By Service Type, 2016–2024 (USD Billion)
Table 39 TIC Market in Germany, By Sourcing Type, 2016–2024 (USD Billion)
Table 40 TIC Market in UK, By Application, 2016–2024 (USD Million)
Table 41 TIC Market in UK, By Service Type, 2016–2024 (USD Billion)
Table 42 TIC Market in UK, By Sourcing Type, 2016–2024 (USD Billion)
Table 43 TIC Market in France, By Application, 2016–2024 (USD Million)
Table 44 TIC Market in France, By Service Type, 2016–2024 (USD Million)
Table 45 TIC Market in France, By Sourcing Type, 2016–2024 (USD Billion)
Table 46 TIC Market in Italy, By Application, 2016–2024 (USD Million)
Table 47 TIC Market in Italy, By Service Type, 2016–2024 (USD Million)
Table 48 TIC Market in Italy, By Sourcing Type, 2016–2024 (USD Billion)
Table 49 TIC Market in Spain, By Application, 2016–2024 (USD Million)
Table 50 Testing, Inspection, and Certification Market in Spain, By Service Type, 2016–2024 (USD Million)
Table 51 TIC Market in Spain, By Sourcing Type, 2016–2024 (USD Billion)
Table 52 TIC Market in APAC, By Country, 2016–2024 (USD Million)
Table 53 TIC Market in China, By Application, 2016–2024 (USD Million)
Table 54 TIC Market in China, By Service Type, 2016–2024 (USD Billion)
Table 55 TIC Market in China, By Sourcing Type, 2016–2024 (USD Billion)
Table 56 TIC Market in Japan, By Application, 2016–2024 (USD Million)
Table 57 TIC Market in Japan, By Service Type, 2016–2024 (USD Million)
Table 58 Testing, Inspection, and Certification Market in Japan, By Sourcing Type, 2016–2024 (USD Billion)
Table 59 TIC Market in India, By Application, 2016–2024 (USD Million)
Table 60 TIC Market in India, By Service Type, 2016–2024 (USD Million)
Table 61 TIC Market in India, By Sourcing Type, 2016–2024 (USD Billion)
Table 62 TIC Market in South Korea, By Application, 2016–2024 (USD Million)
Table 63 Testing, Inspection, and Certification Market in South Korea, By Service Type, 2016–2024 (USD Million)
Table 64 TIC Market in South Korea, By Sourcing Type, 2016–2024 (USD Billion)
Table 65 TIC Market in Australia, By Application, 2016–2024 (USD Million)
Table 66 TIC Market in Australia, By Service Type, 2016–2024 (USD Million)
Table 67 TIC Market in Australia, By Sourcing Type, 2016–2024 (USD Billion)
Table 68 TIC Market in RoW, By Country, 2016–2024 (USD Million)
Table 69 TIC Market in South and Central America, By Application, 2016–2024 (USD Million)
Table 70 Testing, Inspection, and Certification Market in South and Central America, By Service Type, 2016–2024 (USD Billion)
Table 71 TIC Market in South and Central America, By Sourcing Type, 2016–2024 (USD Billion)
Table 72 TIC Market in Middle East and Africa, By Application, 2016–2024 (USD Million)
Table 73 Testing, Inspection, and Certification Market in Middle East and Africa, By Service Type, 2016–2024 (USD Million)
Table 74 TIC Market in Middle East and Africa, By Sourcing Type, 2016–2024 (USD Billion)
Table 75 Top 5 Players in TIC Market, 2018
Table 76 Acquisitions (2017–2019)
Table 77 Expansions (2016–2018)
Table 78 Service Launches (2016–2018)
Table 79 Others (2017)
List of Figures(46 Figures)
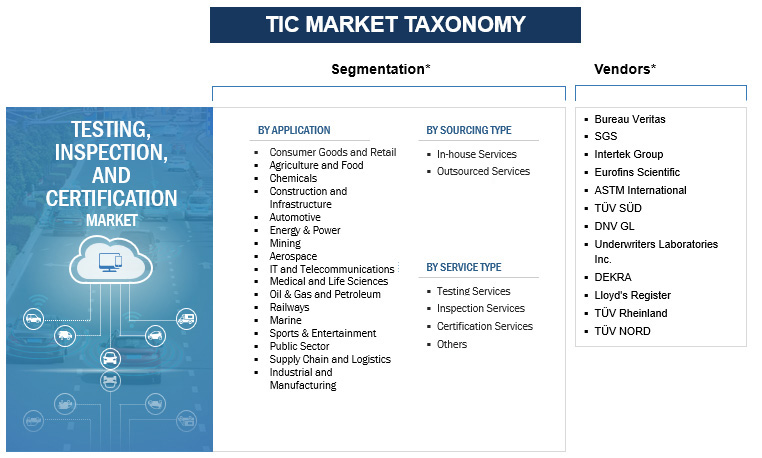
Figure 1 TIC Market Segmentation
Figure 2 Process Flow of Market Size Estimation
Figure 3 Testing, Inspection, and Certification Market: Research Design
Figure 4 Data Triangulation Methodology
Figure 5 TIC Market, By Application, 2018 & 2024 (USD Billion)
Figure 6 Testing Services Likely to Hold Largest Market Share in 2019
Figure 7 Market for Outsourced TIC Services Likely to Grow at Highest CAGR During Forecast Period
Figure 8 APAC Led TIC Market in 2018
Figure 9 China Commanded TIC Market in Asia Pacific in 2018
Figure 10 Increasing Disposable Income and Rapid Urbanization in Emerging Economies Driving Growth of TIC Market
Figure 11 Market for Outsourced TIC Services to Grow at Higher CAGR During Forecast Period
Figure 12 Testing Services to Hold Major Market Share of TIC Market During Forecast Period
Figure 13 Consumer Goods and Retail Application Held Largest Share of TIC Market in APAC in 2019
Figure 14 Emerging Markets Such as China and India to Grow at High CAGR During 2019–2024
Figure 15 TIC Market Dynamics
Figure 16 Value Chain Analysis: TIC Market
Figure 17 TIC Market for Certification to Grow at Highest CAGR During Forecast Period
Figure 18 In-House Services to Dominate TIC Market, Based on Sourcing Type, During Forecast Period
Figure 19 Consumer Goods and Retail Application Accounted for Largest Size of Global TIC Market in 2018
Figure 20 Construction Machinery and Equipment Services Accounted for Largest Share of TIC Market for Construction and Infrastructure Application in 2018
Figure 21 Medical Devices Expected to Exhibit Fastest Growth in TIC Market for Medical and Life Sciences During Forecast Period
Figure 22 Vehicle Inspection Services Dominated Automotive TIC Market in 2018
Figure 23 Geographic Snapshot: Rapidly Growing Countries Such as India and China Emerging as Potentially New Markets
Figure 24 TIC Market in APAC to Grow at Highest CAGR During Forecast Period
Figure 25 Snapshot of TIC Market in North America
Figure 26 Snapshot of TIC Market in Europe
Figure 27 Testing Services to Hold Largest Size of TIC Market in Germany During Forecast Period
Figure 28 Snapshot of TIC Market in APAC
Figure 29 Testing Services to Hold Largest Size of TIC Market in India During Forecast Period
Figure 30 Snapshot of TIC Market in RoW
Figure 31 Companies Adopted Acquisitions as Key Growth Strategy During 2016–2019
Figure 32 Market Evolution Framework—Acquisition as Major Strategy Adopted By Key Players From 2016 to 2019
Figure 33 Battle for Market Share: Acquisition Was Key Strategy Adopted During 2016–2019
Figure 34 SGS Group: Company Snapshot
Figure 35 Bureau Veritas SA: Company Snapshot
Figure 36 Intertek: Company Snapshot
Figure 37 Dekra SE: Company Snapshot
Figure 38 Eurofins Scientific: Company Snapshot
Figure 39 TUV SUD: Company Snapshot
Figure 40 DNV GL: Company Snapshot
Figure 41 TUV Rheinland: Company Snapshot
Figure 42 Applus+: Company Snapshot
Figure 43 ALS Limited: Company Snapshot
Figure 44 TUV Nord Group: Company Snapshot
Figure 45 Lloyd’s Register Group Limited: Company Snapshot
Figure 46 Mistras: Company Snapshot