Pad-mounted Transformer Market by End User (Industrial, Commercial, and Residential), by Phase (Single and Three), by Rated Power (<1 MVA and >1 MVA), by Insulation Type (Dry-type and Liquid-Immersed) & by Region - Global Forecast to 2020


[166 Pages Report] The Pad-mounted transformer market is estimated to reach USD 6 Billion by 2020. The current market size is valued at USD 4.5 Billion and is estimated to grow at a CAGR of 5.21% for the forecast period from 2015 to 2020. The report segments pad-mounted transformers on the basis of its phase, rated power, insulation type, and by end user. The only other technology available is pole-mounted transformer. Pole-mounted transformers are currently limited by rated power as high rated power pole mounted transformers are bigger in size and need strong poles with proper balancing to mount. Other than that, there is no technology at present which can replace pad-mounted transformers.
Years considered for the study: 6
Base Year: 2014
Forecast years: 2015-estimated, 2020-predicted
Research Methodology:
- Major regions were identified along with countries contributing the maximum share
- Secondarys� were conducted to find the split (by phase, by rated power, by end user, and by insulation type) pad-mounted transformer in the regions and their contribution
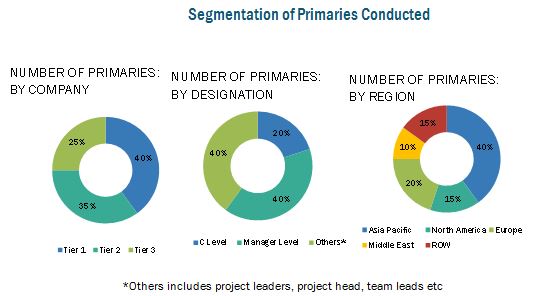
- End users were identified on the basis of transformer contracts in the region and the split was calculated by conducting primaries with industry participants, subject matter experts, C-level executives of key market players, and industry consultants among other experts, which helped to obtain and verify critical qualitative and quantitative information as well as assess future market prospects
- Top companies revenues (regional/global), pad-mounted transformer pricing, and industry trends along with top-down, bottom-up, and MnM KNOW were used to estimate market value
- This was further broken down into several segments and subsegments on the basis of information gathered
The study answers several questions for the stakeholders which includes pad-mounted transformer manufacturers, EPC companies, utility service providers, distributers & suppliers, consulting firms, private equity groups, investment houses, equity research firms and other stakeholders. It gives them information about market segments to focus on in the next two to five years, for prioritizing efforts and investments
Scope of the Report:
- This study estimates the global pad-mounted transformer market of pad-mounted transformer, in terms of dollar value, till 2020
- It offers a detailed qualitative and quantitative analysis of this market
- It provides a comprehensive review of major market drivers, restraints, opportunities, challenges, winning imperatives, and key issues of the market
- It covers various important aspects of the market. These include analysis of value chain, Porter�s Five Forces model, competitive landscape, market dynamics, market estimates in terms of value, and future trends in the pad-mounted transformer market.
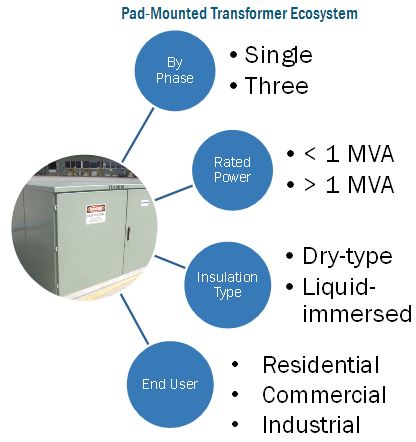
The pad-mounted transformer market has been segmented into -
On the basis of Rated Power Type
- > 1 MVA
- < 1 MVA
On the basis of Phase
- Single
- Three
On the basis of Insulation
- Dry-type
- Liquid-immersed
On the basis of End User
- Residential
- Commercial
- Industrial
On the basis of Region
- North America
- South America
- Asia-Pacific
- Middle East & Africa
- Europe
Available Customization
With the market data provided above, MarketsandMarkets offers customizations as per the company�s specific needs. The following customization options are available for the report:
- Detailed analysis and profiling of additional market players (Up to 5)
Customer Interested in this report also can view
Smart Transformers Market by Type (Power, Distribution, Specialty, and Instrument), Application (Smart Grid, Traction Locomotive, Electric Vehicle Charging, and Others) & by Region - Global Trends & Forecast to 2020
Power Transformer Market by Rating (Small Power Transformer (Up to 60MVA), Medium Power Transformer (61 � 600MVA), Large Power Transformer (Above 600MVA)), by Type of Cooling Method (Oil-Cooled and Air-Cooled), & Region - Global Trends & Forecasts to 2020
Transformer Monitoring System Market by Type (Hardware Solutions and IT Solutions), Application (Distribution Transformers, and Power Transformers), Service (Oil/Gas Monitoring, and Bushing Monitoring), and Region - Global Forecast to 2021
The pad-mounted transformer market is expected to grow at a decent rate of 5.21% from 2015 to 2020. It is projected to reach USD 6 Billion by 2020. The growth in the market is supported by large investments planned for upgradation and expansion of power transmission & distribution networks across globe. Developing countries are expanding their power grid networks to meet the growing demand for electricity from industries, as well as connecting the rural sector to the power grid for domestic use. Large industries are coming up in developing countries like China, and India due to industrialization and are expected to create a good demand for pad-mounted transformers.
Industrial end users are expected to grow at the highest rate in the end user segment. The key driving factor will be favorable government policies for the growth of industries in various countries such as Mexico, China, Brazil, and India. The U.S. has come up with new norms for the efficiency of distribution transformers which will be implemented from 1st January, 2016. More efficient pad-mounted transformers will reduce electricity wastage and thereby increase savings in terms of power and capital. This new policy reform is expected to drive the pad-mounted transformer market in the U.S.
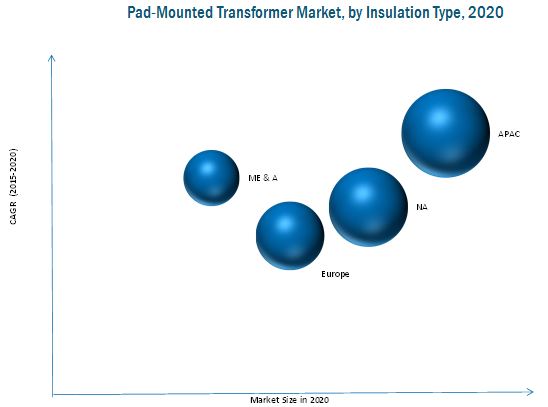
The three phase pad-mounted transformer market is estimated to grow at the highest rate in the segmentation on the basis of phase. The key driving factor for this market is the increase in power consuming appliances in the residential sector which requires high capacity pad-mounted transformers. Also, in most of the countries, utility power is supplied in three phase, so three phase pad-mounted transformers are more suitable in such situations over single phase pad-mounted transformers. On the basis of insulation type, dry-type is estimated to grow at a higher rate as compared to liquid-immersed as it has lower maintenance cost and is safer to use.
Asia Pacific is the largest pad-mounted transformer market by size and is estimated to grow at the highest rate due to high demand for power products from China. High economic growth rate of China has created a good demand for power distribution products such as pad-mounted transformers. Along with that, new policy reforms in India to support the growth of industries have made India a very lucrative market for the OEM manufacturers. This is also likely to create a huge demand for pad-mounted transformers in the region.
The major factors restraining the growth of pad-mounted transformer market over its substitutes is that it requires land for installation and has to be placed inside an enclosure to prevent contact with flammable materials (liquid-immersed pad-mounted transformer). This requires additional cost which is not required in case of pole mounted transformers.
The market is dominated by a few international players which hold more than 50% share of the pad-mounted transformer market. Major leaders are ABB Ltd. (Switzerland), Schneider Electric (France), Siemens AG (Germany), GE (U.S.), and Eaton Corporation Plc. (Ireland). These players are expanding their market share by winning new projects for power transmission & distribution and by opening manufacturing facilities in regions with high demand.
 Exclusive indicates content/data unique to MarketsandMarkets and not available with any competitors.
Table of Contents
1 Introduction (Page No. - 16)
1.1 Objectives of the Study
1.2 Market Definition
1.3 Market Scope
1.3.1 Markets Covered
1.3.2 Years
1.4 Currency
1.5 Limitations
1.6 Stakeholders
2 Research Methodology (Page No. - 19)
2.1 Research Data
2.1.1 Secondary Data
2.1.1.1 Key Data From Secondary Sources
2.1.2 Primary Data
2.1.2.1 Key Data From Primary Sources
2.1.2.2 Key Industry Insights
2.1.2.3 Breakdown of Primaries
2.2 Market Size Estimation
2.2.1 Bottom-Up Approach
2.2.2 Top Down Approach
2.3 Market Breakdown and Data Triangulation
2.4 Research Assumptions & Limitations
2.4.1 Assumptions
2.4.2 Limitations
3 Executive Summary (Page No. - 27)
3.1 Introduction
3.2 Current Scenario
3.3 Future Trends
3.4 Conclusion
4 Premium Insights (Page No. - 31)
4.1 At tractive Market Opportunities in the Pad Mounted Transformer Market
4.2 Global Pad-Mounted Transformer Market
4.3 Pad Mounted Transformer Market, By End User
4.4 Asia-Pacific, the Largest Liquid-Immersed Pad Mounted Transformer Market in 2014
4.5 Pad-Mounted Transformer Market: By End User
5 Market Overview (Page No. - 37)
5.1 Introduction
5.2 Market Segmentation
5.2.1 By Rated Power
5.2.2 By Phase
5.2.3 By End User
5.2.4 By Insulation Type
5.2.5 By Region
5.3 Market Dynamics
5.3.1 Drivers
5.3.1.1 Need for Replacing Aging T&D Infrastructure and Power Grid Expansion
5.3.1.2 Implementation of Energy Efficient Standards
5.3.1.3 Available in Higher Capacities
5.3.2 Restraints
5.3.2.1 Requires Ground Space for Installations
5.3.2.2 Lack of Proper Distribution Network
5.3.3 Opportunities
5.3.3.1 Increasing Demand for Power
5.3.3.2 Development of Renewable Energy Power Grid
5.3.4 Challenges
5.3.4.1 Raw Material Cost Volatility
5.3.4.2 Delays in Grid Expansion Projects
5.4 Impact of Market Dynamics
5.5 Value Chain Analysis
5.6 Porter�s Five Forces Analysis
5.6.1 Threat of New Entrants
5.6.1.1 Initial Capital Investment is High
5.6.1.2 Established Players
5.6.2 Threat of Substitutes
5.6.3 Bargaining Power of Suppliers
5.6.4 Bargaining Power of Buyers
5.6.5 Intensity of Competitive Rivalry
5.6.5.1 Market Dominated By A Few Players
6 Global Pad Mounted Transformer Market, By Insulation Type (Page No. - 56)
6.1 Introduction
6.2 Dry-Type Pad Mounted Transformer Market
6.3 Liquid-Immersed Pad Mounted Transformer Market
7 Global Pad Mounted Transformer Market, By Phase (Page No. - 61)
7.1 Introduction
7.2 Pad Mounted Transformer Market By Single Phase
7.3 Three Phase Pad Mounted Transformer Market
8 Global Pad-Mounted Transformer Market, By Rated Power (Page No. - 65)
8.1 Introduction
8.2 By Rated Power <1 MVA
8.3 Pad Mounted Transformer Market By Rated Power >1 MVA
9 Global Pad Mounted Transformer Market, By End User (Page No. - 70)
9.1 Introduction
9.2 Residential End User Pad Mounted Transformer Market
9.3 Commercial End User Pad Mounted Transformer Market
9.4 Industrial End User Pad Mounted Transformer Market
10 Pad Mounted Transformer Market, By Region (Page No. - 80)
10.1 Introduction
10.1.1 Global Pad Mounted Transformer Market
10.2 Asia-Pacific
10.2.1 By Rated Power
10.2.2 By Phase
10.2.3 By End User
10.2.4 By Insulation Type
10.2.5 By Country
10.2.5.1 China: By Market Size, By Phase
10.2.5.2 India: By Market Size, By Phase
10.2.5.3 Japan: By Market Size, By Phase
10.3 North America
10.3.1 By Rated Power
10.3.2 By Phase
10.3.3 By End User
10.3.4 By Insulation Type
10.3.5 By Country
10.3.5.1 U.S.: By Market Size, By Phase
10.3.5.2 Canada: By Market Size, By Phase
10.3.5.3 Mexico: By Market Size, By Phase
10.4 Europe
10.4.1 By Rated Power
10.4.2 By Phase
10.4.3 By End User
10.4.4 By Insulation Type
10.4.5 By Country
10.4.5.1 Russia: By Market Size, By Phase
10.4.5.2 Germany: By Market Size, By Phase
10.4.5.3 U.K.: By Market Size, By Phase
10.5 Middle East & Africa
10.5.1 By Rated Power
10.5.2 By Phase
10.5.3 By End User
10.5.4 By Insulation Type
10.5.5 By Country
10.5.5.1 Saudi Arabia: By Market Size, By Phase
10.5.5.2 South Africa: By Market Size, By Phase
10.5.5.3 UAE: By Market Size, By Phase
10.6 South America
10.6.1 By Rated Power
10.6.2 By Phase
10.6.3 By End User
10.6.4 By Insulation Type
10.6.5 By Country
10.6.5.1 Brazil: Pad Mounted Transformer Market Size, By Phase
10.6.5.2 Argentina: Pad Mounted Transformer Market Size, By Phase
11 Competitive Landscape (Page No. - 108)
11.1 Overview
11.2 Competitive Situation & Trends
11.2.1 Contracts and Agreements
11.2.2 Expansions
11.2.3 New Product/Service/Technology Developments
11.2.4 Mergers and Acquisitions
11.2.5 Other Developments
12 Company Profiles (Page No. - 118)
12.1 Introduction
12.2 ABB Ltd.
12.2.1 Business Overview
12.2.2 Products & Services: ABB Ltd.
12.2.3 Developments, 2012-2015
12.2.4 SWOT Analysis
12.2.5 MnM View
12.3 Eaton Corporation PLC.
12.3.1 Business Overview
12.3.2 Products & Services
12.3.3 Developments, 2012-2015
12.3.4 SWOT Analysis
12.3.5 MnM View
12.4 General Electric
12.4.1 Business Overview
12.4.2 Products & Services
12.4.3 Developments, 2012-2014
12.4.4 SWOT Analysis
12.4.5 MnM View
12.5 Schneider Electric Co.
12.5.1 Business Overview
12.5.2 Products and Services
12.5.3 Recent Developments
12.5.4 SWOT Analysis
12.5.5 MnM View
12.6 Siemens AG.
12.6.1 Business Overview
12.6.2 Products & Services
12.6.3 Developments, 2015-2014
12.6.4 SWOT Analysis
12.6.5 MnM View
12.7 Crompton Greaves
12.7.1 Business Overview
12.7.2 Products and Services
12.7.3 Recent Developments
12.8 Ermco.
12.8.1 Business Overview
12.8.2 Products & Services
12.8.3 Developments, 2012-2015
12.9 Federal Pacific
12.9.1 Business Overview
12.9.2 Products & Services
12.9.3 Developments, 2012-2015
12.10 Hitachi
12.10.1 Business Overview
12.10.2 Products and Services
12.10.3 Recent Developments
12.11 Moloney Electric, Inc.
12.11.1 Business Overview
12.11.2 Products & Services
12.11.3 Developments, 2012-2015
12.12 Olsun Electric Corporation
12.12.1 Business Overview
12.12.2 Products & Services
12.12.3 Developments, 2012-2015
12.13 Pacific Crest Transformers, Inc.
12.13.1 Business Overview
12.13.2 Products & Services
12.13.3 Developments, 2012-2015
12.14 Pearl Electric Co. Ltd.
12.14.1 Business Overview
12.14.2 Products & Services
12.14.3 Developments, 2012-2015
12.15 Vantran Industries, Inc.
12.15.1 Business Overview
12.15.2 Products & Services
12.15.3 Developments, 2012-2015
12.16 Wenzhou Rockwell Transformer Co.
12.16.1 Business Overview
12.16.2 Products & Services
12.16.3 Developments, 2012-2015
13 Appendix (Page No. - 158)
13.1 Insights From Industry Experts
13.2 Discussion Guide
13.3 Other Developments, 2012-2014
13.4 Introducing RT: Real Time Market Intelligence
13.5 Available Customizations
13.6 Related Reports
List of Tables (75 Tables)
Table 1 T&D Losses of Major Developed Countries, 2012
Table 2 T&D Losses of Major Developing Countries, 2012
Table 3 Energy Conservation Standards for Low-Voltage Dry-Type Distribution Transformers
Table 4 Energy Conservation Standards for Liquid-Immersed Distribution Transformers
Table 5 Energy Conservation Standards for Medium-Voltage Dry-Type Distribution Transformers
Table 6 Impact of Pad-mounted Transformer Market Dynamics
Table 7 Pad Mounted Transformer Market Size, By Insulation Type, 2013-2020 (USD Million)
Table 8 Dry-Type Pad Mounted Transformer Market Size, By Region, 2013-2020 (USD Million)
Table 9 Liquid-Immersed Pad Mounted Transformer Market Size, By Region, 2013-2020 (USD Million)
Table 10 Pad Mounted Transformer Market Size, By Phase, 2013-2020 (USD Million)
Table 11 Single Phase Pad Mounted Transformer Market Size, By Region, 2013-2020 (USD Million)
Table 12 Three Phase Pad Mounted Transformer Market Size, By Region, 2013-2020 (USD Million)
Table 13 Pad-Mounted Transformer Market Size, By Rated Power, 2013-2020 (USD Million)
Table 14 Rated Power <1 MVA Pad-Mounted Transformer Market Size, By Region, 2013-2020 (USD Million)
Table 15 Rated Power >1 MVA Market Size, By Region, 2013-2020 (USD Million)
Table 16 By Market Size, By End User, 2013-2020 (USD Million)
Table 17 Residential End User Pad-Mounted Transformers Market Size, By Region, 2013-2020 (USD Million)
Table 18 Residential End User By Market Size, By Rated Power, 2013-2020 (USD Million)
Table 19 Residential End User By Market Size, By Phase, 2013-2020 (USD Million)
Table 20 Residential End User Pad-Mounted Transformers Market Size, By Insulation Type, 2013-2020 (USD Million)
Table 21 Commercial End User By Market Size, By Region, 2013-2020 (USD Million)
Table 22 Commercial End User By Market Size, By Rated Power, 2013-2020 (USD Million)
Table 23 Commercial End User By Market Size, By Phase, 2013-2020 (USD Million)
Table 24 Commercial End User By Market Size, By Insulation Type, 2013-2020 (USD Million)
Table 25 Industrial End User Pad Mounted Transformer Market Size, By Region, 2013-2020 (USD Million)
Table 26 Industrial End User By Market Size, By Phase, 2013-2020 (USD Million)
Table 27 Industrial End User By Market Size, By Rated Power, 2013-2020 (USD Million)
Table 28 Industrial End User By Market Size, By Insulation Type, 2013-2020 (USD Million)
Table 29 Pad Mounted Transformer Market Size, By Region, 2013-2020 (USD Million)
Table 30 Asia-Pacific: Pad Mounted Transformer Market Size, By Rated Power, 2013-2020 (USD Million)
Table 31 Asia-Pacific: By Pad-mounted Transformer Market Size, By Phase, 2013-2020 (USD Million)
Table 32 Asia-Pacific: By Market Size, By End User, 2013-2020 (USD Million)
Table 33 Asia-Pacific: By Market Size, By Insulation Type, 2013-2020 (USD Million)
Table 34 Asia-Pacific: By Market Size, By Country, 2013-2020 (USD Million)
Table 35 China: By Market Size, By Phase, 2013-2020 (USD Million)
Table 36 India: By Market Size, By Phase, 2013-2020 (USD Million)
Table 37 Japan: By Size, By Phase, 2013-2020 (USD Million)
Table 38 North America: By Pad-mounted Transformer Market Size, By Rated Power, 2013-2020 (USD Million)
Table 39 North America: By Market Size, By Phase, 2013-2020 (USD Million)
Table 40 North America: By Market Size, By End User, 2013-2020 (USD Million)
Table 41 North America: By Market Size, By Insulation Type, 2013-2020 (USD Million)
Table 42 North America: By Market Size, By Country, 2013-2020 (USD Million)
Table 43 U.S.: By Market Size, By Phase, 2013-2020 (USD Million)
Table 44 Canada: By Pad-mounted Transformer Market Size, By Phase, 2013-2020 (USD Million)
Table 45 Mexico: By Market Size, By Phase, 2013-2020 (USD Million)
Table 46 Europe: By Market Size, By Rated Power, 2013-2020 (USD Million)
Table 47 Europe: By Market Size, By Phase, 2013-2020 (USD Million)
Table 48 Europe: By Market Size, By End User, 2013-2020 (USD Million)
Table 49 Europe: By Market Size, By Insulation Type, 2013-2020 (USD Million)
Table 50 Europe: By Market Size, By Country, 2013-2020 (USD Million)
Table 51 Russia: By Market Size, By Phase, 2013-2020 (USD Million)
Table 52 Germany: By Market Size, By Phase, 2013-2020 (USD Million)
Table 53 U.K.: By Market Size, By Phase, 2013-2020 (USD Million)
Table 54 Middle East & Africa: By Pad-mounted Transformer Market Size, By Rated Power, 2013-2020 (USD Million)
Table 55 Middle East & Africa: By Market Size, By Phase, 2013-2020 (USD Million)
Table 56 Middle East & Africa: By Market Size, By End User, 2013-2020 (USD Million)
Table 57 Middle East & Africa: By Market Size, By Insulation Type, 2013-2020 (USD Million)
Table 58 Middle East & Africa: By Market Size, By Country, 2013-2020 (USD Million)
Table 59 Saudi Arabia: By Market Size, By Phase, 2013-2020 (USD Million)
Table 60 South Africa: By Market Size, By Phase, 2013-2020 (USD Million)
Table 61 UAE: By Market Size, By Phase, 2013-2020 (USD Million)
Table 62 South America: By Market Size, By Rated Power, 2013-2020 (USD Million)
Table 63 South America: By Market Size, By Phase, 2013-2020 (USD Million)
Table 64 South America: By Market Size, By End User, 2013-2020 (USD Million)
Table 65 South America: By Market Size, By Insulation Type, 2013-2020 (USD Million)
Table 66 South America: By Market Size, By Country, 2013-2020 (USD Million)
Table 67 Brazil: By Pad-mounted Transformer Market Size, By Phase, 2013-2020 (USD Million)
Table 68 Argentina: By Pad-mounted Transformer Market Size, By Phase, 2013-2020 (USD Million)
Table 69 Contract & Agreements, 2012-2015
Table 70 Expansions, 2012-2015
Table 71 New Product Developments, 2012-2015
Table 72 Mergers & Acquisitions, 2012-2015
Table 73 Other Developments, 2012-2015
Table 74 Contracts & Agreements
Table 75 Expansions
List of Figures (58 Figures)
Figure 1 Research Design: Pad-Mounted Transformer Market
Figure 2 Bottom-Up Approach
Figure 3 Top-Down Approach
Figure 4 Assumptions of the Research Study
Figure 5 Limitations of the Research Study
Figure 6 Asia-Pacific Dominated the Pad Mounted Transformer Market in 2014
Figure 7 Liquid-Immersed Pad-Mounted Transformers Dominated the Pad Mounted Transformer Market, in 2014
Figure 8 Asia-Pacific is A Potential Market for Pad-Mounted Transformers
Figure 9 Pad-Mounted Market, Industrial End User, 2015-2020 (USD Million)
Figure 10 High T&D Investments in Asia-Pacific Will Create Opportunities for Pad-Mounted Transformer Market
Figure 11 > 1 MVA Rated Pad-Mounted Transformer to Account for A Major Share (By Value) During the Forecast Period
Figure 12 Industrial End Users Accounted for A Major Share (By Value) of the Pad Mounted Transformer Market in 2014
Figure 13 Asia-Pacific Held Major Share in the Pad Mounted Transformer Market, in 2014
Figure 14 Three Phase Pad Mounted Transformer Estimated to Account for Largest Market Share (Value) By 2020
Figure 15 Market Segmentation: By Rated Power, Type, Phase, End User & Region
Figure 16 Pad Mounted Transformer Market Segmentation: By Cooling Type
Figure 17 Pad Mounted Transformer Market: By Region
Figure 18 Replacement of Aging Infrastructure to Propel Market Growth
Figure 19 Global Steel Price (Jan, 2012 � Dec, 2015) in USD/Tone
Figure 20 Global Aluminum Price (Jan, 2012 � Dec, 2015) in USD/Tone
Figure 21 Global Copper Price (Jan, 2012 � Dec, 2015) in USD/Tone
Figure 22 Value Chain Analysis
Figure 23 Porter�s Five Forces Analysis: Intensity of Competitive Rivalry is High in the Pad-Mounted Transformer Market
Figure 24 Market Share (Value), By Phase, 2014
Figure 25 Market Share (Value), By Phase, 2014
Figure 26 Market Share (Value), By Rated Power, 2014
Figure 27 <1 MVA Power Rated Pad-Mounted Transformers are Expected to Grow at the Highest CAGR
Figure 28 Market Share (Value), By End User, 2014
Figure 29 Market Share (Value), By Region, 2014
Figure 30 Regional Snapshot � Growth Rate of Pad Mounted Transformer Market in Important Countries, 2015�2020
Figure 31 Asia-Pacific Pad Mounted Transformer Market Overview (2014)
Figure 32 North America Pad Mounted Transformer Market Overview (2014)
Figure 33 Companies Adopted Contracts & Agreements and Expansions to Capture the Markets (2012-2015)
Figure 34 Market Evaluation Framework: Top Companies on the Basis of Developments (2012-2015)
Figure 35 Market Evaluation Framework: Top Companies on the Basis of Market Share (2014)
Figure 36 Market Evaluation Framework: Contracts & Agreements, and Expansions Have Fuelled the Growth of Companies During 2012-2015
Figure 37 Geographic Revenue Mix of Top Five Players
Figure 38 ABB Ltd.: Company Snapshot
Figure 39 SWOT Analysis: ABB Ltd.
Figure 40 Eaton: Company Snapshot
Figure 41 SWOT Analysis: Eaton Corporation PLC
Figure 42 GE: Company Snapshot
Figure 43 SWOT Analysis: GE
Figure 44 Schneider Electric Co.: Company Snapshot
Figure 45 SWOT Analysis: Schneider Electric
Figure 46 Siemens: Company Snapshot
Figure 47 SWOT Analysis: Siemens AG
Figure 48 Crompton Greaves Limited: Company Snapshot
Figure 49 Ermco: Company Snapshot
Figure 50 Federal Pacific: Company Snapshot
Figure 51 Hitachi: Company Snapshot
Figure 52 Moloney Electric, Inc. : Company Snapshot
Figure 53 Olsun Electric Corporation: Company Snapshot
Figure 54 Pacific Crest Transformers, Inc. : Company Snapshot
Figure 55 Pearl Electric: Company Snapshot
Figure 56 Vantran Industries, Inc. : Company Snapshot
Figure 57 Wehzhou Rockwell Transformer Co.: Company Snapshot
Figure 58 RT Snapshot


Growth opportunities and latent adjacency in Pad-mounted Transformer Market