Passenger Information System Market by Component (Solutions and Services), Location (On Board and In Station), Transportation Mode (Railways (Trains and Trams), Roadways, and Airways and Waterways) and Region - Global Forecast to 2027
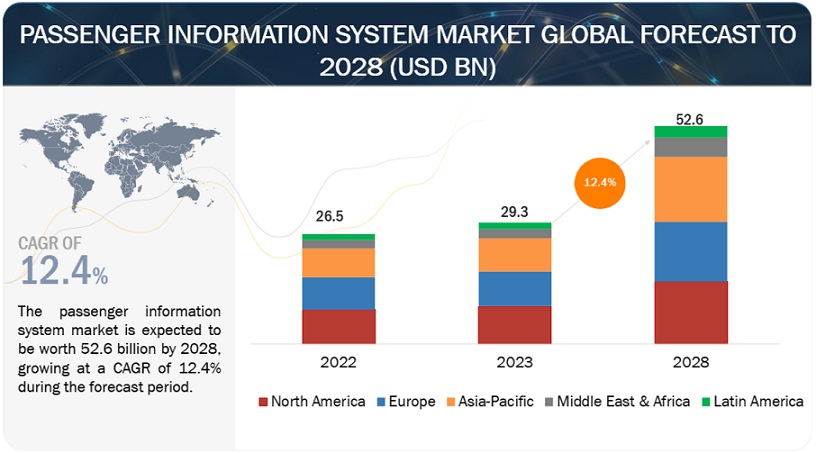
[292 Pages Report] The global passenger information system market size to grow from USD 26.5 billion in 2022 to USD 46.2 billion by 2027, at a Compound Annual Growth Rate (CAGR) of 11.8% during the forecast period. The rapid advancements in technological solutions, in recent years, have enabled better connectivity of objects, resulting in the development of smarter ecosystems and enhance passenger experience driving the PIS market.
To know about the assumptions considered for the study, Request for Free Sample Report
COVID-19 Impact
The outbreak of COVID-19 has significantly impacted the operations in the transportation sectors, while the IT and Telecom, and government sectors have been moderately impacted. Since the outbreak of the COVID-19 pandemic, many regions have witnessed the imposition of lockdowns. There was a significant drop in the number of people utilizing public transport. Many airports, shopping malls, and public entertainment places were shut down. All the sports events, concerts, and expos were either canceled or postponed to a later date. When lockdown measures were lifted, initially, public transport operated with less than 50% of its capacity due to the need to practice physical distancing. As governments struggle to contain the COVID-19 pandemic, an economic catastrophe has unfolded. Re-starting aviation and opening borders will be critical to the eventual economic recovery. The discontinued operations of public transport at nearly all the times since the outbreak of pandemic has led to a decline in the PIS market growth.
Market Dynamics
Driver: Rise in demand for intelligent public transportation systems, including real-time transit information of passengers
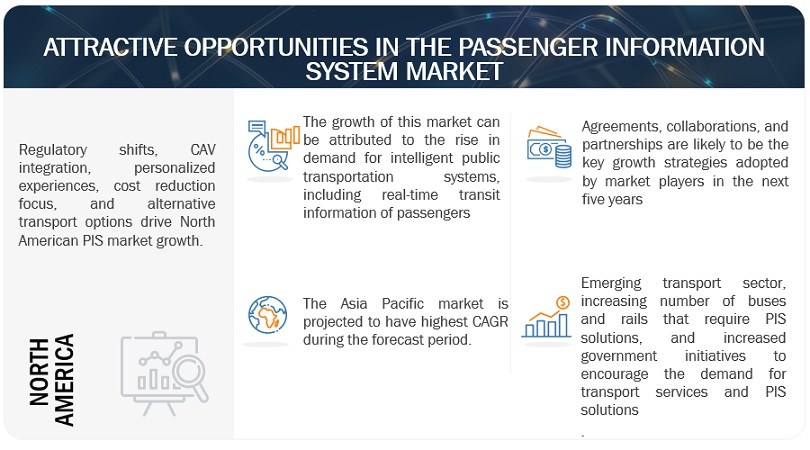
The growing demand for intelligent public transportation systems that provides real-time transit information for passengers is projected to drive the growth of the PIS market. As the demand for real-time information of passengers is increasing, transport service providers and transit agencies are deploying PIS solutions and services to enhance the travel experience of passengers. In order to increase passenger satisfaction, transport service providers are upgrading their information systems by offering new features, such as real-time data availability and in-transit network connectivity. The upgraded PIS provides passengers with real-time customized travel information. The real-time information comprises updated and reliable information from various sources about destinations, connections at the next station, weather, news, or any other third-party feed.
Restraint: Stringent transportation regulatory policies
Smart public transportation involves connecting multiple transportation vehicles and infrastructure wirelessly with the help of sensors and applications. However, app-based mobility services have not been defined under legal entities across several countries that are regulating their operations. In addition, taxi owners in several countries must obtain separate licenses and registration papers to carry out their operations, posing challenges for app-based mobility service providers, as they do not own these vehicles. These stringent transportation regulatory policies make it difficult for vehicle operators to provide on-demand mobility services to users, thus impacting the growth of the services segment in a negative way.
Opportunity: Increase in penetration of cloud, big data, and analytics in the PIS
The use of big data and analytics in the PIS market would speed up the decision-making capacity and control the public transportation systems. It not only decreases the latency in decision-making for connected devices but also provides increased scalability. In addition, PIS vendors are adopting cloud platforms that are secure platforms for storage and computation of massive amounts of data due to in-built security and data management and data analytics. Analytics, such as edge analytics, refers to the approach of capturing, monitoring, and analyzing the data at the edge of network devices, such as sensors, routers, gateways, and switches. Smart public transportation is a dense ecosystem of all the modes of transportation, and edge analytics would empower closed-circuit televisions (CCTVs) and surveillance cameras with instant analysis capabilities. Hence, it would be a profitable opportunity for PIS vendors to adopt this technology and provide high growth opportunities for vendors in the market.
Challenge: Multiple sensors and touchpoints pose data fusion challenges
With the development of multiple types of sensors and touchpoints used in the transportation sector, more data is generated. As the volume of data increases, there is a rise in the need to combine data gathered from different sources to extract the most useful information. The data fusion is an effective way for optimum utilization of large data volumes from multiple sources, such as sensors and touchpoints. Smart public transportation comprises different interconnected sensors that collect a significant amount of raw data. Synthesizing and integrating all the raw data generated from these touchpoints to gain valuable traffic information, such as speed, travel times, and congestions, is a difficult task and sometimes leads to the failure of these systems. Thus, deploying a multi-sensor data fusion technology that collates all the recorded signals to create a more informed environment for remote sensing, traffic control, and ticketing management can pose major challenges.
Display system solutions are expected account for the largest market share during 2022
Display systems are used to display real-time visual information for passengers at stations or on-board vehicles. Display systems help to integrate passenger information into dynamic displays that guide, inform, and update passengers as they move on their way. The display systems help to share wayfinding, gates and departures, emergency information or inform and engage with real-time and context-based updates. These systems help to reduce missed transfers and wait periods, with real-time arrivals and departures pushed right to screens across terminals, it also helps to provide news, advertisements, safety and emergency messages, and entertainment content for the effective and immediate delivery of information to passengers.
By location, In-station segment is expected to account for a higher CAGR during the forecast period
The In-station segment is projected to gain traction in the coming years, as there is a growing need to display real-time vehicle information across stations and airports. PIS is a digital information system that displays real-time information for passengers. PIS vendors are constantly focusing on improving passenger satisfaction by offering more than just arrival and departure timings. They also offer In-station news and entertainment content, as well as safety and emergency announcements. PIS at stations or bus stops can be used to display the number of passengers waiting for the next vehicle’s route and destination
North America to account for the largest market share during the forecast period
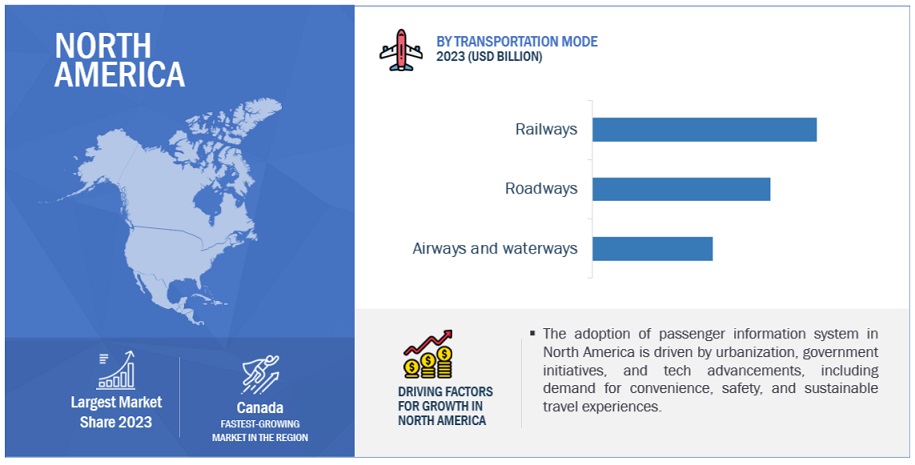
North America is estimated to hold the highest market share during the forecast period in the passenger information system market, due to the large-scale technological adoption by people, and the presence of key market players in the region. The US and Canada are the leading countries in the region as they witness significant advancements in terms of the development of smart cities and transportation projects. North America is one of the most developed regions where the network infrastructure is in good condition. This has led to a rise in demand for PIS solutions and services in the market. Most of the transport sectors have implemented PIS solutions and services in the region on a large scale as the network connectivity is available in every corner. The advent of SMEs and the adoption of digitization in the transportation sector, along with high-speed networks, are projected to drive the market growth in North America.
To know about the assumptions considered for the study, download the pdf brochure
Key Market Players
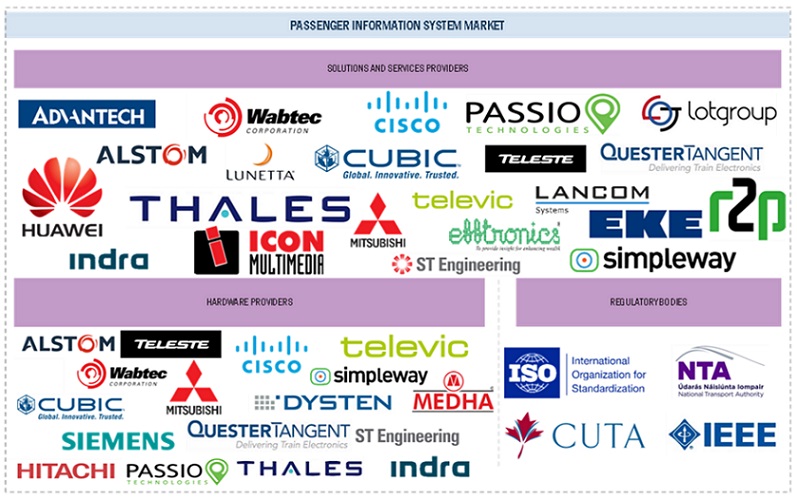
The passenger information system market vendors have implemented various types of organic and inorganic growth strategies, such as new product launches, product upgradations, partnerships and agreements, business expansions, and mergers and acquisitions to strengthen their offerings in the market. The major vendors in the global passenger information system market Advantech (Taiwan), Alstom (France), Wabtec (US), Cubic (US), Cisco (US), Siemens (Germany), Hitachi (Japan), Huawei (China), Thales (France), Teleste (Finland), Televic (Belgium), Mitsubishi Electric (Japan), ST Engineering (Singapore), DYSTEN (Poland), Lunetta (India), R2P (Germany), Indra (Spain), ICON Multimedia (Spain), Passio Technologies (US), LANCom (Slovenia), Simpleway (Czech), EKE-Electronics (Finland), Medha Servo Drives (India), Quester Tangent (Canada), and LOT Group (Ukraine), Efftronics (India). The study includes an in-depth competitive analysis of these key players in the passenger information system market with their company profiles, recent developments, and key market strategies.
Get online access to the report on the World's First Market Intelligence Cloud
- Easy to Download Historical Data & Forecast Numbers
- Company Analysis Dashboard for high growth potential opportunities
- Research Analyst Access for customization & queries
- Competitor Analysis with Interactive dashboard
- Latest News, Updates & Trend analysis
Request Sample Scope of the Report
Get online access to the report on the World's First Market Intelligence Cloud
- Easy to Download Historical Data & Forecast Numbers
- Company Analysis Dashboard for high growth potential opportunities
- Research Analyst Access for customization & queries
- Competitor Analysis with Interactive dashboard
- Latest News, Updates & Trend analysis
Report Metrics |
Details |
Market size available for years |
2016-2027 |
Base year considered |
2022 |
Forecast period |
2022-2027 |
Forecast units |
Value (USD Million/Billion) |
Segments covered |
By component, solutions, services, location, transportation mode, functional model and regions |
Regions covered |
North America, Europe, Asia Pacific, Middle East and Africa, Latin America |
Companies covered |
Advantech (Taiwan), Alstom (France), Wabtec (US), Cubic (US), Cisco (US), Siemens (Germany), Hitachi (Japan), Huawei (China), Thales (France), Teleste (Finland), Televic (Belgium), Mitsubishi Electric (Japan), ST Engineering (Singapore), DYSTEN (Poland), Lunetta (India), R2P (Germany), Indra (Spain), ICON Multimedia (Spain), Passio Technologies (US), LANCom (Slovenia), Simpleway (Czech), EKE-Electronics (Finland), Medha Servo Drives (India), Quester Tangent (Canada), and LOT Group (Ukraine), Efftronics (India). |
This research report categorizes the passenger information system market to forecast revenues and analyze trends in each of the following subsegments:
By Component:
- Solutions
- Services
By Solutions:
- Display Systems
- Announcement Systems
- Emergency Communication Systems
- Mobile Applications
- Infotainment Systems
- Others
By Services:
- Consulting
- Deployment and Integration
- Support and Miantainance
By Location:
- On Board
- In Station
By Transportation Mode:
- Railways
- Trains
- Trams
- Roadways
- Airways and Waterways
By Functional Mode:
- Multimedia Displays
- Audio Systems
- Computing Systems
- Networking and Communication Devices
- Video Surveillance
- Content Management System
- Other Functional Models
By Region:
- North America
- US
- Canada
- Europe
- UK
- France
- Germany
- Rest of Europe
- Asia Pacific
- China
- India
- Rest of Asia Pacific
- Middle East and Africa
- United Arab Emirates
- South Africa
- Rest of Middle East and Africa
- Latin America
- Brazil
- Mexico
- Rest of Latin America
Recent Developments:
- In June 2022, Wabtec acquired Collins Aerospace’s ARINC rail business. This acquisition will serve transit, regional, inter-city, subway, commuter, and light rail systems in the US and Canada.
- In April 2022, Alstom and ENGIE have entered into a partnership agreement to provide the rail freight sector with a solution for the decarbonization of mainline operations by substituting diesel-powered locomotives with hydrogen versions.
- In April 2022, Hitachi Rail acquired Perpetuum, a British rail technology firm and a pioneer in offering digital solutions for improving train reliability and performance. As a part of the deal, Perpetuum’s digital solutions would further improve, optimize, and expand the application of the technology solutions in Hitachi’s global transportation portfolio.
Frequently Asked Questions (FAQ):
What is passenger information system (PIS)?
The passenger information system (PIS) is an automated system used to offer information about the nature and state of the public transport services to the users of public transport systems. It is an operating tool responsible for providing audio and visual information to passengers at stations and transfer facilities at any time, thereby enhancing the rider's comfort and optimizing the communication between drivers, passengers, operations centers, and maintenance crews. The information such systems provide can be static/scheduled or real-time information, which changes continuously as a result of real-world events. The PIS comprises many subsystems, such as train communication, backbone network, radio, video surveillance, public address, passenger emergency telephony, multichannel voice recorder, and real-time display.
Which countries are considered in the European region?
The report includes an analysis of the UK, France, Germany in the European region.
Which are the key drivers supporting the growth of the passenger information system market?
The key drivers supporting the growth of the passenger information system market include rise in demand for intelligent public transportation systems, including real-time transit information of passengers, increasing adoption of smartphones and other handheld devices leading to a rise in connectivity and usage of advertising and information systems, rise in urban population and traffic in public transportation systems, advancements in the technological solutions to enhance passenger experience
Who are the key vendors in the passenger information system market?
The key vendors operating in the passenger information system market include. Advantech (Taiwan), Alstom (France), Wabtec (US), Cubic (US), Cisco (US), Siemens (Germany), Hitachi (Japan), Huawei (China), Thales (France), Teleste (Finland), Televic (Belgium), Mitsubishi Electric (Japan), ST Engineering (Singapore), DYSTEN (Poland), Lunetta (India), R2P (Germany), Indra (Spain), ICON Multimedia (Spain), Passio Technologies (US), LANCom (Slovenia), Simpleway (Czech), EKE-Electronics (Finland), Medha Servo Drives (India), Quester Tangent (Canada), and LOT Group (Ukraine), Efftronics (India). .
To speak to our analyst for a discussion on the above findings, click Speak to Analyst
TABLE OF CONTENTS
1 INTRODUCTION (Page No. - 31)
1.1 STUDY OBJECTIVES
1.2 MARKET DEFINITION
1.3 STUDY SCOPE
1.3.1 MARKET SEGMENTATION
1.3.2 REGIONAL SCOPE
1.3.3 INCLUSIONS AND EXCLUSIONS
1.3.4 YEARS CONSIDERED
1.4 CURRENCY
TABLE 1 USD EXCHANGE RATES, 2019–2021
1.5 STAKEHOLDERS
1.6 LIMITATIONS OF STUDY
1.7 SUMMARY OF CHANGES
2 RESEARCH METHODOLOGY (Page No. - 39)
2.1 RESEARCH DATA
FIGURE 1 GLOBAL PASSENGER INFORMATION SYSTEM (PIS) MARKET: RESEARCH DESIGN
2.1.1 SECONDARY DATA
2.1.1.1 Secondary sources
2.1.2 PRIMARY DATA
2.1.2.1 Breakdown of primary profiles
FIGURE 2 BREAKDOWN OF PRIMARY INTERVIEWS: BY COMPANY, DESIGNATION, AND REGION
2.1.2.2 Primary sources
2.1.2.3 Key industry insights
2.2 MARKET BREAKUP AND DATA TRIANGULATION
FIGURE 3 DATA TRIANGULATION
2.3 MARKET SIZE ESTIMATION
FIGURE 4 RESEARCH METHODOLOGY: APPROACH
2.3.1 TOP-DOWN APPROACH
FIGURE 5 MARKET SIZE ESTIMATION METHODOLOGY: TOP-DOWN APPROACH
2.3.2 BOTTOM-UP APPROACH
FIGURE 6 MARKET SIZE ESTIMATION METHODOLOGY: BOTTOM-UP APPROACH
FIGURE 7 MARKET SIZE ESTIMATION METHODOLOGY─ APPROACH 1 (SUPPLY-SIDE): REVENUES FROM DIFFERENT SOLUTIONS /SERVICES IN THE PASSENGER INFORMATION SYSTEM MARKET
FIGURE 8 MARKET SIZE ESTIMATION METHODOLOGY ─ APPROACH 1 BOTTOM-UP (SUPPLY-SIDE): COLLECTIVE REVENUE OF SOLUTIONS/SERVICES IN THE MARKET
FIGURE 9 MARKET SIZE ESTIMATION METHODOLOGY—APPROACH 2—BOTTOM-UP (DEMAND SIDE): SHARE OF THE MARKET THROUGH THE COMPONENT LEVEL
2.4 MARKET FORECAST
TABLE 2 FACTOR ANALYSIS
2.5 ASSUMPTIONS FOR THE STUDY
3 EXECUTIVE SUMMARY (Page No. - 51)
FIGURE 10 PASSENGER INFORMATION SYSTEM MARKET SIZE, 2022-2027
FIGURE 11 BASED ON COMPONENT, THE SOLUTIONS SEGMENT IS ESTIMATED TO LEAD THE MARKET DURING THE FORECAST PERIOD
FIGURE 12 BASED ON SOLUTIONS, MOBILE APPLICATIONS ARE PROJECTED TO GROW WITH THE HIGHEST GROWTH RATE DURING THE FORECAST PERIOD
FIGURE 13 BASED ON LOCATION, THE ON-BOARD SEGMENT IS EXPECTED TO LEAD THE MARKET DURING THE FORECAST PERIOD
FIGURE 14 BASED ON TRANSPORTATION MODE, THE ROADWAYS SEGMENT IS PROJECTED TO GROW AT THE HIGHEST GROWTH RATE DURING THE FORECAST PERIOD
FIGURE 15 GROWING SEGMENTS IN THE PASSENGER INFORMATION SYSTEM MARKET, 2022-2027
FIGURE 16 MARKET: REGIONAL SNAPSHOT
4 PREMIUM INSIGHTS (Page No. - 56)
4.1 ATTRACTIVE OPPORTUNITIES IN PASSENGER INFORMATION SYSTEM MARKET
FIGURE 17 RISE IN DEMAND FOR REAL-TIME TRANSIT INFORMATION OF PASSENGERS TO DRIVE THE MARKET GROWTH DURING THE FORECAST PERIOD
4.2 ASIA PACIFIC MARKET, BY LOCATION AND COUNTRY
FIGURE 18 ON-BOARD LOCATION SEGMENT AND CHINA TO ACCOUNT FOR LARGEST MARKET SHARE IN ASIA PACIFIC IN 2022
4.3 MARKET: MAJOR COUNTRIES
FIGURE 19 INDIA TO GROW AT HIGHEST RATE DURING FORECAST PERIOD
5 MARKET OVERVIEW AND INDUSTRY TRENDS (Page No. - 58)
5.1 MARKET OVERVIEW
5.2 MARKET DYNAMICS
FIGURE 20 DRIVERS, RESTRAINTS, OPPORTUNITIES, AND CHALLENGES: PASSENGER INFORMATION SYSTEM MARKET
5.2.1 DRIVERS
5.2.1.1 Rise in demand for intelligent public transportation systems
5.2.1.2 Increase in adoption of smartphones and other handheld devices
5.2.1.3 Advancements in the technological solutions to enhance passenger experience
5.2.1.4 Rise in urban population and traffic in public transportation systems
TABLE 3 TOP 10 CONGESTED CITIES WORLDWIDE
5.2.2 RESTRAINTS
5.2.2.1 High implementation and maintenance costs
5.2.2.2 Stringent transportation regulatory policies
5.2.3 OPPORTUNITIES
5.2.3.1 Adoption of IoT, 5G, and automation to enhance technological optimization
5.2.3.2 Increase in penetration of cloud, big data, and analytics
5.2.3.3 Decline in vehicle ownership with advancements in Mobility as a Service (MaaS)
TABLE 4 RAILWAY INFRASTRUCTURE INVESTMENT, BY REGION, 2018
5.2.4 CHALLENGES
5.2.4.1 Complexities in the integration over the legacy infrastructure and communication networks
5.2.4.2 Multiple sensors and touchpoints pose data fusion challenge
5.3 IMPACT OF COVID-19 ON THE PASSENGER INFORMATION SYSTEM MARKET DYNAMICS
5.3.1 DRIVERS AND OPPORTUNITIES
5.3.2 RESTRAINTS AND CHALLENGES
5.3.3 CUMULATIVE GROWTH ANALYSIS
5.4 CASE STUDY ANALYSIS
5.4.1 USE CASE 1: CUBIC HELPS MTA STREAMLINE TRANSIT EXPERIENCE OF TRAVELLERS
5.4.2 USE CASE 2: THALES PROVIDES BANE (NOR) WITH NEXT-GENERATION TRAFFIC MANAGEMENT SYSTEM
5.4.3 USE CASE 3: HUAWEI HELPES RUILI AIRLINES IMPROVE PASSENGER EXPERIENCE WITH PRIVATE CLOUD PLATFORM
5.4.4 USE CASE 4: TELESTE PROVIDES STADLER WITH AN ON-BOARD SYSTEM FOR ITS HELSINKI SM5 TRAINS
5.5 TECHNOLOGY ANALYSIS
5.5.1 INTRODUCTION
5.5.2 ARTIFICIAL INTELLIGENCE/ MACHINE LEARNING
5.5.3 BIG DATA AND ANALYTICS
5.5.4 INTERNET OF THINGS
5.5.5 5G
5.5.6 CYBERSECURITY
5.6 ECOSYSTEM
TABLE 5 ECOSYSTEM: PASSENGER INFORMATION SYSTEM MARKET
5.7 VALUE CHAIN ANALYSIS
FIGURE 21 MARKET: VALUE CHAIN
5.8 PORTER’S FIVE FORCES MODEL
TABLE 6 PORTER’S FIVE FORCES ANALYSIS: MARKET
5.8.1 THREAT OF NEW ENTRANTS
5.8.2 THREAT OF SUBSTITUTES
5.8.3 BARGAINING POWER OF BUYERS
5.8.4 BARGAINING POWER OF SUPPLIERS
5.8.5 INTENSITY OF COMPETITIVE RIVALRY
5.9 PATENT ANALYSIS
TABLE 7 EUROPE: PATENT APPLICATIONS, BY GEOGRAPHIC ORIGIN, 2013–2019
TABLE 8 EUROPE: PATENT APPLICATIONS, BY TECHNOLOGY FIELD, 2013–2019
FIGURE 22 EUROPE: PATENT APPLICATIONS: DIGITAL TECHNOLOGY, BY APPLICANT, 2020
TABLE 9 US: NUMBER OF PATENTS GRANTED, 2014–2019
5.10 AVERAGE SELLING PRICE TREND
5.11 DISRUPTIONS IMPACTING BUYERS/CLIENTS IN THE PASSENGER INFORMATION SYSTEM MARKET
FIGURE 23 MARKET: DISRUPTIONS IMPACTING BUYERS/CLIENTS
5.12 REGULATORY IMPLICATIONS
5.12.1 INTERNATIONAL ORGANIZATION FOR STANDARDIZATION STANDARDS
5.12.1.1 ISO/IEC JTC 1
5.12.1.2 ISO/IEC 27001
5.12.1.3 ISO/IEC 19770
5.12.1.4 ISO/IEC JTC 1/SWG 5
5.12.1.5 ISO/IEC JTC 1SC 31
5.12.1.6 ISO/IEC JTC 1/SC 27
5.12.1.7 ISO/IEC JTC 1/WG 7 s e n s o r s
5.12.2 GENERAL DATA PROTECTION REGULATION
5.12.3 FEDERAL MOTOR CARRIER SAFETY ADMINISTRATION (FMCSA)
5.12.4 FEDERAL HIGHWAY ADMINISTRATION (FHWA)
5.12.5 MARITIME ADMINISTRATION (MARAD)
5.12.6 FEDERAL AVIATION ADMINISTRATION (FAA)
5.12.7 FEDERAL RAILROAD ADMINISTRATION (FRA)
5.12.8 INSTITUTE OF ELECTRICAL AND ELECTRONICS ENGINEERS
5.12.9 CEN/ISO
5.12.10 CEN/CENELEC
5.12.11 EUROPEAN TELECOMMUNICATIONS STANDARDS INSTITUTE
5.12.12 ITU-T
6 PASSENGER INFORMATION SYSTEM MARKET, BY COMPONENT (Page No. - 81)
6.1 INTRODUCTION
FIGURE 24 SOLUTIONS SEGMENT IS PROJECTED TO DOMINATE THE MARKET DURING THE FORECAST PERIOD
TABLE 10 MARKET SIZE, BY COMPONENT, 2016–2021 (USD MILLION)
TABLE 11 MARKET SIZE, BY COMPONENT, 2022–2027 (USD MILLION)
6.2 SOLUTION
6.2.1 SOLUTION: COVID-19 IMPACT
6.2.2 SOLUTION: MARKET DRIVERS
TABLE 12 SOLUTIONS: MARKET SIZE, BY REGION, 2016–2021 (USD MILLION)
TABLE 13 SOLUTIONS: MARKET SIZE, BY REGION, 2022–2027 (USD MILLION)
6.3 SERVICE
6.3.1 SERVICE: COVID-19 IMPACT
6.3.2 SERVICE: MARKET DRIVER
TABLE 14 SERVICES: MARKET SIZE, BY REGION, 2016–2021 (USD MILLION)
TABLE 15 SERVICES, MARKET SIZE, BY REGION, 2022–2027 (USD MILLION)
7 PASSENGER INFORMATION SYSTEM MARKET, BY SOLUTIONS (Page No. - 87)
7.1 INTRODUCTION
FIGURE 25 MOBILE APPLICATION SOLUTION SEGMENT TO GROW AT THE HIGHEST CAGR DURING THE FORECAST PERIOD
TABLE 16 MARKET SIZE, BY SOLUTION, 2016–2021 (USD MILLION)
TABLE 17 MARKET SIZE, BY SOLUTION, 2022–2027 (USD MILLION)
7.2 DISPLAY SYSTEMS
7.2.1 PROVIDE REAL-TIME AND FUTURE DETAILED AND RELATIONAL TIMETABLES
7.2.2 DISPLAY SYSTEMS: MARKET DRIVERS
TABLE 18 DISPLAY SYSTEMS MARKET SIZE, BY REGION, 2016–2021 (USD MILLION)
TABLE 19 DISPLAY SYSTEMS MARKET SIZE, BY REGION, 2022–2027 (USD MILLION)
7.3 ANNOUNCEMENT SYSTEMS
7.3.1 USED TO ISSUE PRE-RECORDED AUDIO MESSAGES OR LIVE ANNOUNCEMENTS
7.3.2 ANNOUNCEMENT SYSTEMS: PASSENGER INFORMATION SYSTEM MARKET DRIVERS
TABLE 20 ANNOUNCEMENT SYSTEMS MARKET SIZE, BY REGION, 2016–2021 (USD MILLION)
TABLE 21 ANNOUNCEMENT SYSTEMS MARKET SIZE, BY REGION, 2022–2027 (USD MILLION)
7.4 EMERGENCY COMMUNICATION SYSTEMS
7.4.1 PROVIDE SAFETY WARNINGS AND ASSIST DURING EMERGENCIES
7.4.2 EMERGENCY COMMUNICATION SYSTEMS: MARKET DRIVERS
TABLE 22 EMERGENCY COMMUNICATION SYSTEMS MARKET SIZE, BY REGION, 2016–2021 (USD MILLION)
TABLE 23 EMERGENCY COMMUNICATION SYSTEMS MARKET SIZE, BY REGION, 2022–2027 (USD MILLION)
7.5 MOBILE APPLICATIONS
7.5.1 PROVIDE REAL-TIME TRANSIT INFORMATION
7.5.2 MOBILE APPLICATIONS: PASSENGER INFORMATION SYSTEM MARKET DRIVERS
TABLE 24 MOBILE APPLICATIONS MARKET SIZE, BY REGION, 2016–2021 (USD MILLION)
TABLE 25 MOBILE APPLICATIONS MARKET SIZE, BY REGION, 2022–2027 (USD MILLION)
7.6 INFOTAINMENT SYSTEMS
7.6.1 ENHANCE TRAVEL EXPERIENCE OF PASSENGERS
7.6.2 INFOTAINMENT SYSTEMS: MARKET DRIVERS
TABLE 26 INFOTAINMENT SYSTEMS MARKET SIZE, BY REGION, 2016–2021 (USD MILLION)
TABLE 27 INFOTAINMENT SYSTEMS MARKET SIZE, BY REGION, 2022–2027 (USD MILLION)
7.7 OTHER SOLUTIONS
TABLE 28 OTHER SOLUTIONS MARKET SIZE, BY REGION, 2016–2021 (USD MILLION)
TABLE 29 OTHER SOLUTIONS MARKET SIZE, BY REGION, 2022–2027 (USD MILLION)
8 PASSENGER INFORMATION SYSTEM MARKET, BY SERVICE (Page No. - 98)
8.1 INTRODUCTION
FIGURE 26 DEPLOYMENT AND INTEGRATION TO GROW AT HIGHEST CAGR DURING THE FORECAST PERIOD
TABLE 30 MARKET SIZE, BY SERVICE, 2016–2021 (USD MILLION)
TABLE 31 MARKET SIZE, BY SERVICE, 2022–2027 (USD MILLION)
8.2 CONSULTING
8.2.1 SUGGEST, ANALYZE, AND GUIDE CUSTOMERS
8.2.2 CONSULTING: MARKET DRIVERS
TABLE 32 CONSULTING MARKET SIZE, BY REGION, 2016–2021 (USD MILLION)
TABLE 33 CONSULTING MARKET SIZE, BY REGION, 2022–2027 (USD MILLION)
8.3 DEPLOYMENT AND INTEGRATION
8.3.1 HELPS FROM COLLECTING PASSENGER REQUIREMENTS TO ROLLING OUT SOLUTIONS
8.3.2 DEPLOYMENT AND INTEGRATION: MARKET DRIVERS
TABLE 34 DEPLOYMENT AND INTEGRATION MARKET SIZE, BY REGION, 2016–2021 (USD MILLION)
TABLE 35 DEPLOYMENT AND INTEGRATION MARKET SIZE, BY REGION, 2022–2027 (USD MILLION)
8.4 SUPPORT AND MAINTENANCE
8.4.1 PROVIDES UPGRADES FOR DEPLOYED PIS SOLUTIONS AND RESOLVES ISSUES IN PRODUCTS
8.4.2 SUPPORT AND MAINTENANCE: MARKET DRIVERS
TABLE 36 SUPPORT AND MAINTENANCE MARKET SIZE, BY REGION, 2016–2021 (USD MILLION)
TABLE 37 SUPPORT AND MAINTENANCE MARKET SIZE, BY REGION, 2022–2027 (USD MILLION)
9 PASSENGER INFORMATION SYSTEM MARKET, BY LOCATION (Page No. - 104)
9.1 INTRODUCTION
9.1.1 LOCATION: COVID-19 IMPACT
FIGURE 27 IN-STATION SEGMENT TO GROW AT A HIGHER CAGR DURING THE FORECAST PERIOD
TABLE 38 MARKET SIZE, BY LOCATION, 2016–2021 (USD MILLION)
TABLE 39 MARKET SIZE, BY LOCATION, 2022–2027 (USD MILLION)
9.2 ON-BOARD
9.2.1 PROVIDES PRECISE ARRIVAL AND DEPARTURE INFORMATION
9.2.2 ON-BOARD: MARKET DRIVERS
TABLE 40 ON-BOARD MARKET SIZE, BY REGION, 2016–2021 (USD MILLION)
TABLE 41 ON-BOARD MARKET SIZE, BY REGION, 2022–2027 (USD MILLION)
9.3 IN-STATION
9.3.1 AUDIO AND VISUAL INFORMATION THROUGH MULTIPLE DISPLAYS ACROSS STATIONS AND AIRPORTS
9.3.2 IN-STATION: MARKET DRIVERS
TABLE 42 MARKET SIZE FOR IN-STATION, BY REGION, 2016–2021 (USD MILLION)
TABLE 43 MARKET SIZE FOR IN-STATION, BY REGION, 2022–2027 (USD MILLION)
10 PASSENGER INFORMATION SYSTEM MARKET, BY TRANSPORTATION MODE (Page No. - 110)
10.1 INTRODUCTION
10.1.1 TRANSPORTATION MODE
10.1.2 TRANSPORTATION MODE: MARKET DRIVERS
FIGURE 28 ROADWAYS SEGMENT TO GROW AT HIGHEST CAGR DURING THE FORECAST PERIOD
TABLE 44 MARKET SIZE, BY TRANSPORTATION MODE, 2016–2021 (USD MILLION)
TABLE 45 MARKET SIZE, BY TRANSPORTATION MODE, 2022–2027 (USD MILLION)
10.1.3 TRANSPORTATION MODE: COVID-19 IMPACT
10.2 RAILWAYS
10.2.1 ENHANCED PIS SOLUTIONS EMPOWERED BY MOBILITY AND BIG DATA ANALYTICS
TABLE 46 RAILWAY INFRASTRUCTURE INVESTMENT, BY COUNTRY, 2018
TABLE 47 PASSENGER INFORMATION SYSTEM MARKET SIZE IN RAILWAYS, BY REGION, 2016–2021 (USD MILLION)
TABLE 48 MARKET SIZE IN RAILWAYS, BY REGION, 2022–2027 (USD MILLION)
TABLE 49 MARKET SIZE, BY RAILWAYS, 2016–2021 (USD MILLION)
TABLE 50 MARKET SIZE, BY RAILWAYS, 2022–2027 (USD MILLION)
10.2.2 TRAINS
10.2.2.1 Use of PIS solutions and services in trains to benefit both rail operators and passengers
10.2.2.2 Trains: market drivers
TABLE 51 MARKET SIZE IN TRAINS, BY REGION, 2016–2021 (USD MILLION)
TABLE 52 MARKET SIZE IN TRAINS, BY REGION, 2022–2027 (USD MILLION)
10.2.3 TRAMS
10.2.3.1 Need to offer information to passengers traveling via trams
10.2.3.2 Trams: Passenger information system market drivers
TABLE 53 MARKET SIZE IN TRAMS, BY REGION, 2016–2021 (USD MILLION)
TABLE 54 MARKET SIZE IN TRAMS, BY REGION, 2022–2027 (USD MILLION)
10.3 ROADWAYS
10.3.1 INCREASING ADOPTION OF PIS SOLUTIONS IN BUSES
10.3.2 ROADWAYS: MARKET DRIVERS
TABLE 55 MARKET SIZE IN ROADWAYS, BY REGION, 2016–2021 (USD MILLION)
TABLE 56 MARKET SIZE IN ROADWAYS, BY REGION, 2022–2027 (USD MILLION)
10.4 AIRWAYS AND WATERWAYS
10.4.1 SURGE IN THE IMPLEMENTATION OF PIS SOLUTIONS VIA UNIFIED INFORMATION PLATFORM
10.4.2 AIRWAYS AND WATERWAYS: MARKET DRIVERS
TABLE 57 MARKET SIZE IN AIRWAYS AND WATERWAYS, BY REGION, 2016–2021 (USD MILLION)
TABLE 58 MARKET SIZE IN AIRWAYS AND WATERWAYS, BY REGION, 2022–2027 (USD MILLION)
11 PASSENGER INFORMATION SYSTEM MARKET, BY FUNCTIONAL MODEL (Page No. - 121)
11.1 INTRODUCTION
11.2 MULTIMEDIA DISPLAYS
11.3 AUDIO SYSTEMS
11.4 COMPUTING SYSTEMS
11.5 NETWORKING AND COMMUNICATION DEVICES
11.6 VIDEO SURVEILLANCE
11.7 CONTENT MANAGEMENT SYSTEM
11.8 OTHER FUNCTIONAL MODELS
12 PASSENGER INFORMATION SYSTEM MARKET, BY REGION (Page No. - 123)
12.1 INTRODUCTION
FIGURE 29 NORTH AMERICA TO DOMINATE MARKET DURING FORECAST PERIOD
TABLE 59 MARKET SIZE, BY REGION, 2016–2021 (USD MILLION)
TABLE 60 MARKET SIZE, BY REGION, 2022–2027 (USD MILLION)
12.2 NORTH AMERICA
12.2.1 NORTH AMERICA: MARKET REGULATORY IMPLICATIONS
12.2.2 NORTH AMERICA: MARKET DRIVERS
12.2.3 NORTH AMERICA: COVID-19 IMPACT
FIGURE 30 NORTH AMERICA: PASSENGER INFORMATION SYSTEM MARKET SNAPSHOT
TABLE 61 NORTH AMERICA: MARKET SIZE, BY COMPONENT, 2016–2021 (USD MILLION)
TABLE 62 NORTH AMERICA: MARKET SIZE, BY COMPONENT, 2022–2027 (USD MILLION)
TABLE 63 NORTH AMERICA: MARKET SIZE, BY SOLUTIONS, 2016–2021 (USD MILLION)
TABLE 64 NORTH AMERICA: MARKET SIZE, BY SOLUTION, 2022–2027 (USD MILLION)
TABLE 65 NORTH AMERICA: MARKET SIZE, BY SERVICE, 2016–2021 (USD MILLION)
TABLE 66 NORTH AMERICA: MARKET SIZE, BY SERVICE, 2022–2027 (USD MILLION)
TABLE 67 NORTH AMERICA: MARKET SIZE, BY LOCATION, 2016–2021 (USD MILLION)
TABLE 68 NORTH AMERICA: MARKET SIZE, BY LOCATION, 2022–2027 (USD MILLION)
TABLE 69 NORTH AMERICA: MARKET SIZE, BY TRANSPORTATION MODE, 2016–2021 (USD MILLION)
TABLE 70 NORTH AMERICA: MARKET SIZE, BY TRANSPORTATION MODE, 2022–2027 (USD MILLION)
TABLE 71 NORTH AMERICA: MARKET SIZE, BY RAILWAYS, 2016–2021 (USD MILLION)
TABLE 72 NORTH AMERICA: MARKET SIZE, BY RAILWAYS, 2022–2027 (USD MILLION)
TABLE 73 NORTH AMERICA: MARKET SIZE, BY COUNTRY, 2016–2021 (USD MILLION)
TABLE 74 NORTH AMERICA: MARKET SIZE, BY COUNTRY, 2022–2027 (USD MILLION)
12.2.4 US
12.2.4.1 Increasing investments in traffic management solutions to raise the demand for PIS solutions
12.2.4.2 US: Passenger information system market drivers
TABLE 75 US: MARKET SIZE, BY COMPONENT, 2016–2021 (USD MILLION)
TABLE 76 US: MARKET SIZE, BY COMPONENT, 2022–2027 (USD MILLION)
TABLE 77 US: MARKET SIZE, BY SOLUTION, 2016–2021 (USD MILLION)
TABLE 78 US: MARKET SIZE, BY SOLUTION, 2022–2027 (USD MILLION)
TABLE 79 US: MARKET SIZE, BY SERVICE, 2016–2021 (USD MILLION)
TABLE 80 US: MARKET SIZE, BY SERVICE, 2022–2027 (USD MILLION)
TABLE 81 US: MARKET SIZE, BY LOCATION, 2016–2021 (USD MILLION)
TABLE 82 US: MARKET SIZE, BY LOCATION, 2022–2027 (USD MILLION)
TABLE 83 US: MARKET SIZE, BY TRANSPORTATION MODE, 2016–2021 (USD MILLION)
TABLE 84 US: MARKET SIZE, BY TRANSPORTATION MODE, 2022–2027 (USD MILLION)
TABLE 85 US: MARKET SIZE, BY RAILWAYS, 2016–2021 (USD MILLION)
TABLE 86 US: MARKET SIZE, BY RAILWAYS, 2022–2027 (USD MILLION)
12.2.5 CANADA
12.2.5.1 Rise in the number of railway passengers and freight shipments
12.2.5.2 Canada: Passenger information system market drivers
TABLE 87 CANADA: MARKET SIZE, BY COMPONENT, 2016–2021 (USD MILLION)
TABLE 88 CANADA: MARKET SIZE, BY COMPONENT, 2022–2027 (USD MILLION)
TABLE 89 CANADA: MARKET SIZE, BY SOLUTION, 2016–2021 (USD MILLION)
TABLE 90 CANADA: MARKET SIZE, BY SOLUTION, 2022–2027 (USD MILLION)
TABLE 91 CANADA: MARKET SIZE, BY SERVICE, 2016–2021 (USD MILLION)
TABLE 92 CANADA: MARKET SIZE, BY SERVICE, 2022–2027 (USD MILLION)
TABLE 93 CANADA: MARKET SIZE, BY LOCATION, 2016–2021 (USD MILLION)
TABLE 94 CANADA: MARKET SIZE, BY LOCATION, 2022–2027 (USD MILLION)
TABLE 95 CANADA: MARKET SIZE, BY TRANSPORTATION MODE, 2016–2021 (USD MILLION)
TABLE 96 CANADA: MARKET SIZE, BY TRANSPORTATION MODE, 2022–2027 (USD MILLION)
TABLE 97 CANADA: MARKET SIZE, BY RAILWAYS, 2016–2021 (USD MILLION)
TABLE 98 CANADA: MARKET SIZE, BY RAILWAYS, 2022–2027 (USD MILLION)
12.3 EUROPE
12.3.1 EUROPE: PASSENGER INFORMATION SYSTEM MARKET REGULATORY IMPLICATIONS
12.3.2 EUROPE: MARKET DRIVERS
12.3.3 EUROPE: COVID-19 IMPACT
TABLE 99 EUROPE: MARKET SIZE, BY COMPONENT, 2016–2021 (USD MILLION)
TABLE 100 EUROPE: MARKET SIZE, BY COMPONENT, 2022–2027 (USD MILLION)
TABLE 101 EUROPE: MARKET SIZE, BY SOLUTION, 2016–2021 (USD MILLION)
TABLE 102 EUROPE: MARKET SIZE, BY SOLUTION, 2022–2027 (USD MILLION)
TABLE 103 EUROPE: MARKET SIZE, BY SERVICE, 2016–2021 (USD MILLION)
TABLE 104 EUROPE: MARKET SIZE, BY SERVICE, 2022–2027 (USD MILLION)
TABLE 105 EUROPE: MARKET SIZE, BY LOCATION, 2016–2021 (USD MILLION)
TABLE 106 EUROPE: MARKET SIZE, BY LOCATION, 2022–2027 (USD MILLION)
TABLE 107 EUROPE: MARKET SIZE, BY TRANSPORTATION MODE, 2016–2021 (USD MILLION)
TABLE 108 EUROPE: MARKET SIZE, BY TRANSPORTATION MODE, 2022–2027 (USD MILLION)
TABLE 109 EUROPE: MARKET SIZE, BY RAILWAYS, 2016–2021 (USD MILLION)
TABLE 110 EUROPE: MARKET SIZE, BY RAILWAYS, 2022–2027 (USD MILLION)
TABLE 111 EUROPE: MARKET SIZE, BY COUNTRY, 2016–2021 (USD MILLION)
TABLE 112 EUROPE: MARKET SIZE, BY COUNTRY, 2022–2027 (USD MILLION)
12.3.4 UK
12.3.4.1 Government investments in building smart transportation systems to drive the market growth in the UK
12.3.4.2 UK: Passenger information system market drivers
TABLE 113 UK: MARKET SIZE, BY COMPONENT, 2016–2021 (USD MILLION)
TABLE 114 UK: MARKET SIZE, BY COMPONENT, 2022–2027 (USD MILLION)
TABLE 115 UK: MARKET SIZE, BY SOLUTION, 2016–2021 (USD MILLION)
TABLE 116 UK: MARKET SIZE, BY SOLUTION, 2022–2027 (USD MILLION)
TABLE 117 UK: MARKET SIZE, BY SERVICE, 2016–2021 (USD MILLION)
TABLE 118 UK: MARKET SIZE, BY SERVICE, 2022–2027 (USD MILLION)
TABLE 119 UK: MARKET SIZE, BY LOCATION, 2016–2021 (USD MILLION)
TABLE 120 UK: MARKET SIZE, BY LOCATION, 2022–2027 (USD MILLION)
TABLE 121 UK: MARKET SIZE, BY TRANSPORTATION MODE, 2016–2021 (USD MILLION)
TABLE 122 UK: MARKET SIZE, BY TRANSPORTATION MODE, 2022–2027 (USD MILLION)
TABLE 123 UK: MARKET SIZE, BY RAILWAYS, 2016–2021 (USD MILLION)
TABLE 124 UK: MARKET SIZE, BY RAILWAYS, 2022–2027 (USD MILLION)
12.3.5 GERMANY
12.3.5.1 Government’s funding for transport and broadband infrastructure to drive the PIS market
12.3.5.2 Germany: Passenger information system market drivers
12.3.6 FRANCE
12.3.6.1 Rapid technological advancements in the transport industry to lead the PIS market
12.3.6.2 France: market drivers
12.3.7 REST OF EUROPE
12.4 ASIA PACIFIC
12.4.1 ASIA PACIFIC: MARKET REGULATORY IMPLICATIONS
12.4.2 ASIA PACIFIC: MARKET DRIVERS
12.4.3 ASIA PACIFIC: COVID-19 IMPACT
FIGURE 31 ASIA PACIFIC: PASSENGER INFORMATION SYSTEM MARKET SNAPSHOT
TABLE 125 ASIA PACIFIC: MARKET SIZE, BY COMPONENT, 2016–2021 (USD MILLION)
TABLE 126 ASIA PACIFIC: MARKET SIZE, BY COMPONENT, 2022–2027 (USD MILLION)
TABLE 127 ASIA PACIFIC: MARKET SIZE, BY SOLUTION, 2016–2021 (USD MILLION)
TABLE 128 ASIA PACIFIC: MARKET SIZE, BY SOLUTION, 2022–2027 (USD MILLION)
TABLE 129 ASIA PACIFIC: MARKET SIZE, BY SERVICE, 2016–2021 (USD MILLION)
TABLE 130 ASIA PACIFIC: MARKET SIZE, BY SERVICE, 2022–2027 (USD MILLION)
TABLE 131 ASIA PACIFIC: MARKET SIZE, BY LOCATION, 2016–2021 (USD MILLION)
TABLE 132 ASIA PACIFIC: MARKET SIZE, BY LOCATION, 2022–2027 (USD MILLION)
TABLE 133 ASIA PACIFIC: MARKET SIZE, BY TRANSPORTATION MODE, 2016–2021 (USD MILLION)
TABLE 134 ASIA PACIFIC: MARKET SIZE, BY TRANSPORTATION MODE, 2022–2027 (USD MILLION)
TABLE 135 ASIA PACIFIC: MARKET SIZE, BY RAILWAYS, 2016–2021 (USD MILLION)
TABLE 136 ASIA PACIFIC: MARKET SIZE, BY RAILWAYS, 2022–2027 (USD MILLION)
TABLE 137 ASIA PACIFIC: MARKET SIZE, BY COUNTRY, 2016–2021 (USD MILLION)
TABLE 138 ASIA PACIFIC: MARKET SIZE, BY COUNTRY, 2022–2027 (USD MILLION)
12.4.4 CHINA
12.4.4.1 Increase in the number of transport projects in China leading to growth opportunities
12.4.4.2 China: Passenger information system market drivers
TABLE 139 CHINA: MARKET SIZE, BY COMPONENT, 2016–2021 (USD MILLION)
TABLE 140 CHINA: MARKET SIZE, BY COMPONENT, 2022–2027 (USD MILLION)
TABLE 141 CHINA: MARKET SIZE, BY SOLUTION, 2016–2021 (USD MILLION)
TABLE 142 CHINA: MARKET SIZE, BY SOLUTION, 2022–2027 (USD MILLION)
TABLE 143 CHINA: MARKET SIZE, BY SERVICE, 2016–2021 (USD MILLION)
TABLE 144 CHINA: MARKET SIZE, BY SERVICE, 2022–2027 (USD MILLION)
TABLE 145 CHINA: MARKET SIZE, BY LOCATION, 2016–2021 (USD MILLION)
TABLE 146 CHINA: MARKET SIZE, BY LOCATION, 2022–2027 (USD MILLION)
TABLE 147 CHINA: MARKET SIZE, BY TRANSPORTATION MODE, 2016–2021 (USD MILLION)
TABLE 148 CHINA: MARKET SIZE, BY TRANSPORTATION MODE, 2022–2027 (USD MILLION)
TABLE 149 CHINA: MARKET SIZE, BY RAILWAYS, 2016–2021 (USD MILLION)
TABLE 150 CHINA: MARKET SIZE, BY RAILWAYS, 2022–2027 (USD MILLION)
12.4.5 INDIA
12.4.5.1 Government’s initiative for digitization and demand for safe, reliable, timely transit services to drive the PIS market
12.4.5.2 India: Passenger information system market drivers
TABLE 151 INDIA: MARKET SIZE, BY COMPONENT, 2016–2021 (USD MILLION)
TABLE 152 INDIA: MARKET SIZE, BY COMPONENT, 2022–2027 (USD MILLION)
TABLE 153 INDIA: MARKET SIZE, BY SOLUTION, 2016–2021 (USD MILLION)
TABLE 154 INDIA: MARKET SIZE, BY SOLUTION, 2022–2027 (USD MILLION)
TABLE 155 INDIA: MARKET SIZE, BY SERVICE, 2016–2021 (USD MILLION)
TABLE 156 INDIA: MARKET SIZE, BY SERVICE, 2022–2027 (USD MILLION)
TABLE 157 INDIA: MARKET SIZE, BY LOCATION, 2016–2021 (USD MILLION)
TABLE 158 INDIA: MARKET SIZE, BY LOCATION, 2022–2027 (USD MILLION)
TABLE 159 INDIA: MARKET SIZE, BY TRANSPORTATION MODE, 2016–2021 (USD MILLION)
TABLE 160 INDIA: MARKET SIZE, BY TRANSPORTATION MODE, 2022–2027 (USD MILLION)
TABLE 161 INDIA: MARKET SIZE, BY RAILWAYS, 2016–2021 (USD MILLION)
TABLE 162 INDIA: MARKET SIZE, BY RAILWAYS, 2022–2027 (USD MILLION)
12.4.6 REST OF ASIA PACIFIC
12.5 MIDDLE EAST AND AFRICA
12.5.1 MIDDLE EAST AND AFRICA: PASSENGER INFORMATION SYSTEM MARKET REGULATORY IMPLICATIONS
12.5.2 MIDDLE EAST AND AFRICA: MARKET DRIVERS
12.5.3 MIDDLE EAST AND AFRICA: COVID-19 IMPACT
TABLE 163 MIDDLE EAST AND AFRICA: MARKET SIZE, BY COMPONENT, 2016–2021 (USD MILLION)
TABLE 164 MIDDLE EAST AND AFRICA: MARKET SIZE, BY COMPONENT, 2022–2027 (USD MILLION)
TABLE 165 MIDDLE EAST AND AFRICA: MARKET SIZE, BY SOLUTIONS, 2016–2021 (USD MILLION)
TABLE 166 MIDDLE EAST AND AFRICA: MARKET SIZE, BY SOLUTIONS, 2022–2027 (USD MILLION)
TABLE 167 MIDDLE EAST AND AFRICA: MARKET SIZE, BY SERVICES, 2016–2021 (USD MILLION)
TABLE 168 MIDDLE EAST AND AFRICA: MARKET SIZE, BY SERVICES, 2022–2027 (USD MILLION)
TABLE 169 MIDDLE EAST AND AFRICA: MARKET SIZE, BY LOCATION, 2016–2021 (USD MILLION)
TABLE 170 MIDDLE EAST AND AFRICA: MARKET SIZE, BY LOCATION, 2022–2027 (USD MILLION)
TABLE 171 MIDDLE EAST AND AFRICA: MARKET SIZE, BY TRANSPORTATION MODE, 2016–2021 (USD MILLION)
TABLE 172 MIDDLE EAST AND AFRICA: MARKET SIZE, BY TRANSPORTATION MODE, 2022–2027 (USD MILLION)
TABLE 173 MIDDLE EAST AND AFRICA: MARKET SIZE, BY RAILWAYS, 2016–2021 (USD MILLION)
TABLE 174 MIDDLE EAST AND AFRICA: MARKET SIZE, BY RAILWAYS, 2022–2027 (USD MILLION)
TABLE 175 MIDDLE EAST AND AFRICA: MARKET SIZE, BY COUNTRY, 2016–2021 (USD MILLION)
TABLE 176 MIDDLE EAST AND AFRICA: MARKET SIZE, BY COUNTRY, 2022–2027 (USD MILLION)
12.5.4 UNITED ARAB EMIRATES
12.5.4.1 Increase in the number of logistics and transport companies to boost the PIS market
12.5.4.2 United Arab Emirates: Passenger information system market drivers
TABLE 177 UNITED ARAB EMIRATES: MARKET SIZE, BY COMPONENT, 2016–2021 (USD MILLION)
TABLE 178 UNITED ARAB EMIRATES: MARKET SIZE, BY COMPONENT, 2022–2027 (USD MILLION)
TABLE 179 UNITED ARAB EMIRATES: MARKET SIZE, BY SOLUTIONS, 2016–2021 (USD MILLION)
TABLE 180 UNITED ARAB EMIRATES: MARKET SIZE, BY SOLUTIONS, 2022–2027 (USD MILLION)
TABLE 181 UNITED ARAB EMIRATES: MARKET SIZE, BY SERVICES, 2016–2021 (USD MILLION)
TABLE 182 UNITED ARAB EMIRATES: MARKET SIZE, BY SERVICES, 2022–2027 (USD MILLION)
TABLE 183 UNITED ARAB EMIRATES: MARKET SIZE, BY LOCATION, 2016–2021 (USD MILLION)
TABLE 184 UNITED ARAB EMIRATES: MARKET SIZE, BY LOCATION, 2022–2027 (USD MILLION)
TABLE 185 UNITED ARAB EMIRATES: MARKET SIZE, BY TRANSPORTATION MODE, 2016–2021 (USD MILLION)
TABLE 186 UNITED ARAB EMIRATES: MARKET SIZE, BY TRANSPORTATION MODE, 2022–2027 (USD MILLION)
TABLE 187 UNITED ARAB EMIRATES: MARKET SIZE, BY RAILWAYS, 2016–2021 (USD MILLION)
TABLE 188 UNITED ARAB EMIRATES: MARKET SIZE, BY RAILWAYS, 2022–2027 (USD MILLION)
12.5.5 SOUTH AFRICA
12.5.5.1 Adoption of IoT and cloud technologies to lead the PIS market growth
12.5.5.2 South Africa: Passenger information system market drivers
12.5.6 REST OF MIDDLE EAST AND AFRICA
12.6 LATIN AMERICA
12.6.1 LATIN AMERICA: MARKET REGULATORY IMPLICATIONS
12.6.2 LATIN AMERICA: MARKET DRIVERS
12.6.3 LATIN AMERICA: COVID-19 IMPACT
TABLE 189 LATIN AMERICA: MARKET SIZE, BY COMPONENT, 2016–2021 (USD MILLION)
TABLE 190 LATIN AMERICA: MARKET SIZE, BY COMPONENT, 2022–2027 (USD MILLION)
TABLE 191 LATIN AMERICA: MARKET SIZE, BY SOLUTION, 2016–2021 (USD MILLION)
TABLE 192 LATIN AMERICA: MARKET SIZE, BY SOLUTION, 2022–2027 (USD MILLION)
TABLE 193 LATIN AMERICA: MARKET SIZE, BY SERVICE, 2016–2021 (USD MILLION)
TABLE 194 LATIN AMERICA: MARKET SIZE, BY SERVICE, 2022–2027 (USD MILLION)
TABLE 195 LATIN AMERICA: MARKET SIZE, BY LOCATION, 2016–2021 (USD MILLION)
TABLE 196 LATIN AMERICA: MARKET SIZE, BY LOCATION, 2022–2027 (USD MILLION)
TABLE 197 LATIN AMERICA: MARKET SIZE, BY TRANSPORTATION MODE, 2016–2021 (USD MILLION)
TABLE 198 LATIN AMERICA: MARKET SIZE, BY TRANSPORTATION MODE, 2022–2027 (USD MILLION)
TABLE 199 LATIN AMERICA: MARKET SIZE, BY RAILWAYS, 2016–2021 (USD MILLION)
TABLE 200 LATIN AMERICA: MARKET SIZE, BY RAILWAYS, 2022–2027 (USD MILLION)
TABLE 201 LATIN AMERICA: MARKET SIZE, BY COUNTRY, 2016–2021 (USD MILLION)
TABLE 202 LATIN AMERICA: MARKET SIZE, BY COUNTRY, 2022–2027 (USD MILLION)
12.6.4 BRAZIL
12.6.4.1 Advancements in transportation infrastructure supporting PIS market growth in Brazil
12.6.4.2 Brazil: Passenger information system market drivers
TABLE 203 BRAZIL: MARKET SIZE, BY COMPONENT, 2016–2021 (USD MILLION)
TABLE 204 BRAZIL: MARKET SIZE, BY COMPONENT, 2022–2027 (USD MILLION)
TABLE 205 BRAZIL: MARKET SIZE, BY SOLUTION, 2016–2021 (USD MILLION)
TABLE 206 BRAZIL: MARKET SIZE, BY SOLUTION, 2022–2027 (USD MILLION)
TABLE 207 BRAZIL: MARKET SIZE, BY SERVICE, 2016–2021 (USD MILLION)
TABLE 208 BRAZIL: MARKET SIZE, BY SERVICE, 2022–2027 (USD MILLION)
TABLE 209 BRAZIL: MARKET SIZE, BY LOCATION, 2016–2021 (USD MILLION)
TABLE 210 BRAZIL: MARKET SIZE, BY LOCATION, 2022–2027 (USD MILLION)
TABLE 211 BRAZIL: MARKET SIZE, BY TRANSPORTATION MODE, 2016–2021 (USD MILLION)
TABLE 212 BRAZIL: MARKET SIZE, BY TRANSPORTATION MODE, 2022–2027 (USD MILLION)
TABLE 213 BRAZIL: MARKET SIZE, BY RAILWAYS, 2016–2021 (USD MILLION)
TABLE 214 BRAZIL: MARKET SIZE, BY RAILWAYS, 2022–2027 (USD MILLION)
12.6.5 MEXICO
12.6.5.1 Rise in traffic congestion, RoI, and automation of public transportation processes to drive the PIS market
12.6.5.2 Mexico: Passenger information system market drivers
12.6.6 REST OF LATIN AMERICA
13 COMPETITIVE LANDSCAPE (Page No. - 186)
13.1 OVERVIEW
13.2 MARKET EVALUATION FRAMEWORK
FIGURE 32 PASSENGER INFORMATION SYSTEM MARKET EVALUATION FRAMEWORK
13.3 MARKET RANKING
FIGURE 33 MARKET RANKING IN 2021
13.4 MARKET SHARE ANALYSIS
TABLE 215 MARKET: DEGREE OF COMPETITION
FIGURE 34 MARKET SHARE ANALYSIS OF COMPANIES IN THE MARKET
13.5 HISTORICAL REVENUE ANALYSIS
FIGURE 35 HISTORICAL THREE-YEAR REVENUE ANALYSIS OF LEADING PLAYERS, 2019–2021 (USD MILLION)
13.6 COMPETITIVE OVERVIEW
FIGURE 36 KEY STRATEGIES IN THE PASSENGER INFORMATION SYSTEM MARKET FOR 2019–2022
13.7 COMPANY PRODUCT FOOTPRINT ANALYSIS
TABLE 216 COMPANY PRODUCT FOOTPRINT
TABLE 217 COMPANY TRANSPORTATION MODE FOOTPRINT
TABLE 218 COMPANY REGION FOOTPRINT
TABLE 219 COMPANY SOLUTION FOOTPRINT
13.8 COMPANY EVALUATION MATRIX
13.8.1 STARS
13.8.2 EMERGING LEADERS
13.8.3 PERVASIVE PLAYERS
13.8.4 PARTICIPANTS
FIGURE 37 GLOBAL PASSENGER INFORMATION SYSTEM MARKET, COMPANY EVALUATION MATRIX
13.9 STARTUP/SME EVALUATION MATRIX, 2021
13.9.1 PROGRESSIVE COMPANIES
13.9.2 RESPONSIVE COMPANIES
13.9.3 DYNAMIC COMPANIES
13.9.4 STARTING BLOCKS
FIGURE 38 GLOBAL MARKET: STARTUP/SME EVALUATION MATRIX, 2021
13.10 COMPETITIVE SCENARIO
13.10.1 PRODUCT LAUNCHES
TABLE 220 MARKET: NEW PRODUCT LAUNCHES, 2019-2021
13.10.2 DEALS
TABLE 221 PASSENGER INFORMATION SYSTEM MARKET: DEALS, 2019-2022
13.10.3 OTHERS
TABLE 222 OTHERS, 2019–2022
14 COMPANY PROFILES (Page No. - 207)
14.1 MAJOR PLAYERS
(Business Overview, Solutions, Products & Services, Recent Developments, MnM View)*
14.1.1 ADVANTECH
TABLE 223 ADVANTECH: BUSINESS OVERVIEW
FIGURE 39 ADVANTECH: COMPANY SNAPSHOT
TABLE 224 ADVANTECH: SOLUTIONS OFFERED
TABLE 225 ADVANTECH: DEALS
TABLE 226 ADVANTECH: OTHERS
14.1.2 ALSTOM
TABLE 227 ALSTOM: BUSINESS OVERVIEW
FIGURE 40 ALSTOM: COMPANY SNAPSHOT
TABLE 228 ALSTOM: SOLUTIONS OFFERED
TABLE 229 ALSTOM: DEALS
14.1.3 WABTEC
TABLE 230 WABTEC: BUSINESS OVERVIEW
FIGURE 41 WABTEC: COMPANY SNAPSHOT
TABLE 231 WABTEC: SOLUTIONS OFFERED
TABLE 232 WABTEC: PRODUCT LAUNCHES
TABLE 233 WABTEC: DEALS
14.1.4 CUBIC
TABLE 234 CUBIC: BUSINESS OVERVIEW
FIGURE 42 CUBIC: COMPANY SNAPSHOT
TABLE 235 CUBIC: SOLUTIONS OFFERED
TABLE 236 CUBIC: PRODUCT LAUNCHES
TABLE 237 CUBIC: DEALS
TABLE 238 CUBIC: OTHERS
14.1.5 CISCO
TABLE 239 CISCO: BUSINESS OVERVIEW
FIGURE 43 CISCO: COMPANY SNAPSHOT
TABLE 240 CISCO: SOLUTIONS OFFERED
TABLE 241 CISCO: DEALS
14.1.6 SIEMENS
TABLE 242 SIEMENS: BUSINESS OVERVIEW
FIGURE 44 SIEMENS: COMPANY SNAPSHOT
TABLE 243 SIEMENS: SOLUTIONS/SERVICES OFFERED
TABLE 244 SIEMENS: PRODUCT LAUNCHES
TABLE 245 SIEMENS: DEALS
14.1.7 HITACHI
TABLE 246 HITACHI: BUSINESS OVERVIEW
FIGURE 45 HITACHI: COMPANY SNAPSHOT
TABLE 247 HITACHI: SOLUTIONS OFFERED
TABLE 248 HITACHI: PRODUCT LAUNCHES
TABLE 249 HITACHI: DEALS
14.1.8 HUAWEI
TABLE 250 HUAWEI: BUSINESS OVERVIEW
FIGURE 46 HUAWEI: COMPANY SNAPSHOT
TABLE 251 HUAWEI: SOLUTIONS OFFERED
TABLE 252 HUAWEI: LAUNCHES
TABLE 253 HUAWEI: DEALS
14.1.9 THALES
TABLE 254 THALES: BUSINESS OVERVIEW
FIGURE 47 THALES: COMPANY SNAPSHOT
TABLE 255 THALES: SOLUTIONS/SERVICES OFFERED
TABLE 256 THALES: PRODUCT LAUNCHES
TABLE 257 THALES: DEALS
14.1.10 MITSUBISHI ELECTRIC
TABLE 258 MITSUBISHI ELECTRIC: BUSINESS OVERVIEW
FIGURE 48 MITSUBISHI ELECTRIC: COMPANY SNAPSHOT
TABLE 259 MITSUBISHI ELECTRIC: SOLUTIONS OFFERED
TABLE 260 MITSUBISHI ELECTRIC: DEALS
14.1.11 TELEVIC
TABLE 261 TELEVIC: BUSINESS OVERVIEW
TABLE 262 TELEVIC: SOLUTIONS OFFERED
TABLE 263 TELEVIC: DEALS
TABLE 264 TELEVIC: OTHERS
14.1.12 ST ENGINEERING
14.1.13 INDRA
14.1.14 MEDHA SERVO DRIVES
*Details on Business Overview, Solutions, Products & Services, Recent Developments, MnM View might not be captured in case of unlisted companies.
14.2 STARTUP/SMES
14.2.1 EFFTRONICS
14.2.2 DYSTEN
14.2.3 LUNETTA
14.2.4 R2P
14.2.5 ICON MULTIMEDIA
14.2.6 PASSIO TECHNOLOGIES
14.2.7 TELESTE
14.2.8 LANCOM
14.2.9 SIMPLEWAY
14.2.10 EKE-ELECTRONICS
14.2.11 QUESTER TANGENT
14.2.12 LOT GROUP
15 ADJACENT/RELATED MARKETS (Page No. - 268)
15.1 FLEET MANAGEMENT MARKET
15.1.1 MARKET OVERVIEW
15.1.2 FLEET MANAGEMENT MARKET, BY COMPONENT
TABLE 265 FLEET MANAGEMENT MARKET SIZE, BY COMPONENT, 2016–2020 (USD MILLION)
TABLE 266 FLEET MANAGEMENT MARKET SIZE, BY COMPONENT, 2021–2026 (USD MILLION)
15.1.2.1 Solutions
TABLE 267 SOLUTIONS: FLEET MANAGEMENT MARKET SIZE, BY REGION, 2016–2020 USD MILLION)
TABLE 268 SOLUTIONS: FLEET MANAGEMENT MARKET SIZE, BY REGION, 2021–2026 (USD MILLION)
TABLE 269 FLEET MANAGEMENT MARKET SIZE, BY SOLUTION, 2016–2020 (USD MILLION)
TABLE 270 FLEET MANAGEMENT MARKET SIZE, BY SOLUTION, 2021–2026 (USD MILLION)
15.1.2.2 Services
TABLE 271 FLEET MANAGEMENT MARKET SIZE FOR SERVICES, BY REGION, 2016–2020 USD MILLION)
TABLE 272 FLEET MANAGEMENT MARKET SIZE FOR SERVICES, BY REGION, 2021–2026 (USD MILLION)
TABLE 273 FLEET MANAGEMENT MARKET SIZE FOR SERVICES, BY TYPE, 2016–2020 (USD MILLION)
TABLE 274 FLEET MANAGEMENT MARKET SIZE FOR SERVICES, BY TYPE, 2021–2026 (USD MILLION)
TABLE 275 FLEET MANAGEMENT MARKET SIZE FOR PROFESSIONAL SERVICES, BY TYPE, 2016–2020 (USD MILLION)
TABLE 276 FLEET MANAGEMENT MARKET SIZE FOR PROFESSIONAL SERVICES, BY TYPE, 2021–2026 (USD MILLION)
TABLE 277 FLEET MANAGEMENT MARKET SIZE FOR PROFESSIONAL SERVICES, BY REGION, 2016–2020 (USD MILLION)
TABLE 278 FLEET MANAGEMENT MARKET SIZE FOR PROFESSIONAL SERVICES, BY REGION, 2021–2026 (USD MILLION)
TABLE 279 FLEET MANAGEMENT MARKET SIZE FOR MANAGED SERVICES, BY REGION, 2016–2020 (USD MILLION)
TABLE 280 FLEET MANAGEMENT MARKET SIZE FOR MANAGED SERVICES, BY REGION, 2021–2026 (USD MILLION)
15.1.3 FLEET MANAGEMENT MARKET, BY FLEET TYPE
TABLE 281 FLEET MANAGEMENT MARKET SIZE, BY FLEET TYPE, 2016–2020 (USD MILLION)
TABLE 282 FLEET MANAGEMENT MARKET SIZE, BY FLEET TYPE, 2021–2026 (USD MILLION)
15.1.4 FLEET MANAGEMENT MARKET, BY DEPLOYMENT TYPE
TABLE 283 FLEET MANAGEMENT MARKET SIZE, BY DEPLOYMENT TYPE, 2016–2020 (USD MILLION)
TABLE 284 FLEET MANAGEMENT MARKET SIZE, BY DEPLOYMENT TYPE, 2021–2026 (USD MILLION)
15.1.5 FLEET MANAGEMENT MARKET, BY REGION
TABLE 285 FLEET MANAGEMENT MARKET SIZE, BY REGION, 2016–2020 (USD MILLION)
TABLE 286 FLEET MANAGEMENT MARKET SIZE, BY REGION, 2021–2026 (USD MILLION)
15.2 SMART TRANSPORTATION MARKET
15.2.1 MARKET DEFINITION
15.2.2 MARKET OVERVIEW
15.2.3 SMART TRANSPORTATION MARKET, BY TRANSPORTATION MODE
TABLE 287 SMART TRANSPORTATION MARKET SIZE, BY TRANSPORTATION MODE, 2016–2019 (USD MILLION)
TABLE 288 SMART TRANSPORTATION MARKET SIZE, BY TRANSPORTATION MODE, 2019–2025 (USD MILLION)
TABLE 289 SMART TRANSPORTATION MODE MARKET SIZE, BY REGION, 2016–2019 (USD MILLION)
TABLE 290 SMART TRANSPORTATION MODE MARKET SIZE, BY REGION, 2019–2025 (USD MILLION)
15.2.3.1 Roadways
TABLE 291 SMART TRANSPORTATION MARKET SIZE IN ROADWAYS, BY REGION, 2016–2019 (USD MILLION)
TABLE 292 SMART TRANSPORTATION MARKET SIZE IN ROADWAYS, BY REGION, 2019–2025 (USD MILLION)
15.2.3.2 Railways
TABLE 293 SMART TRANSPORTATION MARKET SIZE IN RAILWAYS, BY REGION, 2016–2019 (USD MILLION)
TABLE 294 SMART TRANSPORTATION MARKET SIZE IN RAILWAYS, BY REGION, 2019–2025 (USD MILLION)
15.2.3.3 Airways
TABLE 295 SMART TRANSPORTATION MARKET SIZE IN AIRWAYS, BY REGION, 2016–2019 (USD MILLION)
TABLE 296 SMART TRANSPORTATION MARKET SIZE IN AIRWAYS, BY REGION, 2019–2025 (USD MILLION)
15.2.3.4 Maritime
TABLE 297 SMART TRANSPORTATION MARKET SIZE IN MARITIME, BY REGION, 2016–2019 (USD MILLION)
TABLE 298 SMART TRANSPORTATION MARKET SIZE IN MARITIME, BY REGION, 2019–2025 (USD MILLION)
15.2.4 SMART TRANSPORTATION MARKET, BY REGION
TABLE 299 SMART TRANSPORTATION MARKET SIZE, BY REGION, 2016–2019 (USD MILLION)
TABLE 300 SMART TRANSPORTATION MARKET SIZE, BY REGION, 2019–2025 (USD MILLION)
16 APPENDIX (Page No. - 285)
16.1 DISCUSSION GUIDE
16.2 KNOWLEDGE STORE: MARKETSANDMARKETS’ SUBSCRIPTION PORTAL
16.3 AVAILABLE CUSTOMIZATIONS
16.4 RELATED REPORTS
16.5 AUTHOR DETAILS
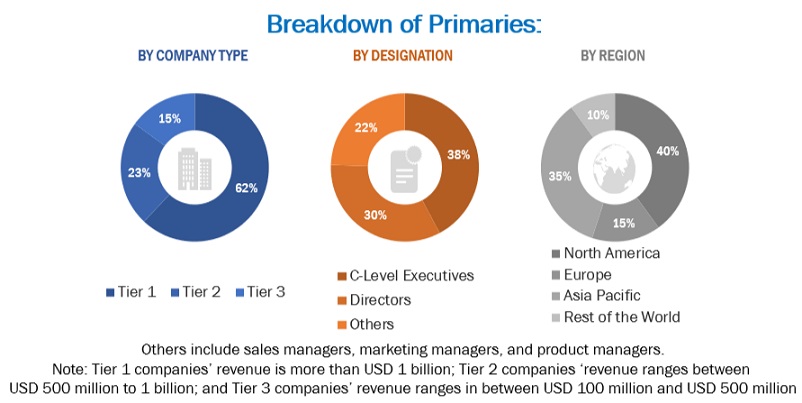
This research study involved the use of extensive secondary sources, directories, and databases, such as D&B Hoovers and Bloomberg BusinessWeek, to identify and collect information useful for this technical, market-oriented, and commercial study of the global passenger information system (PIS) market. The primary sources were mainly several industry experts from core and related industries and preferred suppliers, manufacturers, distributors, service providers (SPs), technology developers, alliances, and organizations related to the segments of this industry’s value chain. In-depth interviews were conducted with various primary respondents that included key industry participants, subject-matter experts, C-level executives of key market players, and industry consultants to obtain and verify critical qualitative and quantitative information, as well as assess prospects. The following illustrative figure shows the market research methodology applied in making this report on the global passenger information system (PIS) market.
Secondary Research
The market size of the companies offering passenger information system (PIS) solutions and services globally was arrived at based on the secondary data available through paid and unpaid sources. It was also arrived at by analyzing the product portfolios of the major companies and rating companies based on their performance and quality.
In the secondary research process, various secondary sources were referred to, for identifying and collecting information for the study. The secondary sources included annual reports, press releases, and investor presentations of companies, and white papers, certified publications, and articles from recognized associations and government publishing sources. The data was collected from secondary sources, such as OECD and International Railway Journal, and Information from Railway Gazette International and the US DoT. Additionally, different transportation modes spending (railways, roadways, airways, and waterways) of various countries was extracted from their respective transportation associations, such as International Organization for Standardization (ISO), Association of Americas Railroads, European Rail Freight Associations, Technology Services Industry Associations (TSIA), Organization for Economic Co-operation and Development, World Transport Forum, World Economic Outlook (WEO), and other transportation association across different modes of transportation.
The secondary research was mainly used to obtain key information about industry insights, the market’s monetary chain, the overall pool of key players, market classification, and segmentation according to industry trends to the bottom-most level, regional markets, and key developments from both market- and technology oriented perspectives.
Primary Research
In the primary research process, various primary sources from both supply and demand sides were interviewed to obtain qualitative and quantitative information for this report. The primary sources from the supply-side included industry experts, chief experience officers (CXOs), vice presidents (VPs), and directors from business development, marketing, product development/innovation teams, and related key executives from PIS solution vendors, system integrators, professional service providers, industry associations, and key opinion leaders.
Primary interviews were conducted to gather insights, such as market statistics, data of revenue collected from the solutions and services, market breakups, market size estimations, market forecasting, and data triangulation. Primary research also helped understand various trends related to technology, application, deployment, and region. Stakeholders from the demand-side, such as Chief Information Officers (CIOs), Chief Technology Officers (CTOs), and Chief Strategy Officers (CSOs), and installation teams of the governments/end users who are using PIS solutions were interviewed to understand the buyer’s perspective on the suppliers, products, service providers, and their current use of PIS solutions, which is projected to impact the overall PIS market growth.
To know about the assumptions considered for the study, download the pdf brochure
Market Size Estimation
Multiple approaches were adopted for the estimation of the passenger information system (PIS) market. The first approach involves the estimation of the market size by summation of the company’s revenues generated through the different types of PIS solutions and services. The top-down and bottom-up approaches were used to estimate and validate the size of the global PIS market and various other dependent subsegments. The research methodology used to estimate the market size included the following details: the key players are not limited to Advantech, Alstom, Wabtec, Cubic Corporation, Cisco, Siemens, Hitachi, Huawei, Thales, Teleste, Mitsubishi Electric, ST Engineering, Dysten, Televic Rail; other players in the market were identified through extensive secondary research, and their revenue contribution in the respective regions was determined through primary and secondary research. The entire procedure included the study of the annual and financial reports of top market players and extensive interviews for key insights from industry leaders, such as Chief Executive Officers (CEOs), VPs, directors, and marketing executives. All percentage splits and breakups were determined using secondary sources and verified through primary sources.
All the possible parameters that affect the market covered in the research study have been accounted for, viewed in extensive detail, verified through primary research, and analyzed to get the final quantitative and qualitative data. The data is consolidated and added with detailed inputs and analysis from MarketsandMarkets.
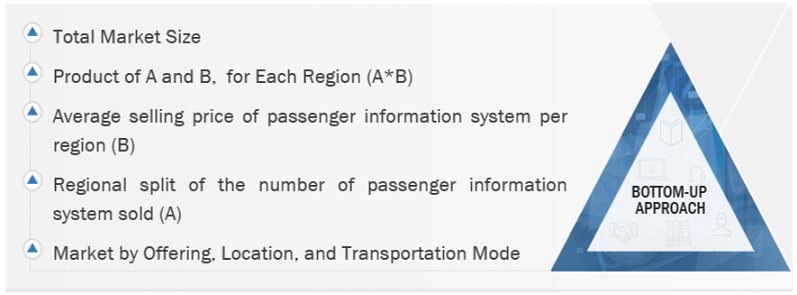
Passenger Information System market: Bottom-Up Approach
To know about the assumptions considered for the study, Request for Free Sample Report
Data Triangulation
After arriving at the overall market size using the market size estimation processes as explained above, the market was split into several segments and subsegments. The data triangulation and market breakup procedures were employed, wherever applicable, to complete the overall market engineering process and arrive at the exact statistics of each market segment and subsegment. The data was triangulated by studying various factors and trends from both the demand and supply sides.
Report Objectives
- To determine and forecast the global passenger information system market based on component, solutions, services, location, transportation mode, functional model and regions from 2022 to 2027, and analyze various macro and microeconomic factors that affect the market growth.
- To forecast the size of the market’s segments with respect to five main regions: North America, Europe, Asia Pacific (APAC), Latin America, and Middle East and Africa (MEA).
- To provide detailed information about the major factors (drivers, opportunities, threats, and challenges) influencing the growth of the market.
- To analyze the impact of COVID-19 on the passenger information system market.
- To analyze each submarket with respect to individual growth trends, prospects, and contributions to the total market.
- To analyze opportunities in the market for stakeholders by identifying the high-growth segments of the passenger information system market.
- To profile key market players (top vendors and startups); provide a comparative analysis based on their business overviews, regional presence, product offerings, business strategies, and key financials; and illustrate the market’s competitive landscape.
- To track and analyze competitive developments, such as mergers and acquisitions, a new product launched and product developments, partnerships, agreements, and collaborations, business expansions, and Research & Development (R&D) activities, in the market
Available Customizations
Along with the market data, MarketsandMarkets offers customizations as per the company’s specific needs. The following customization options are available for the report:
Product Analysis
- Product Matrix which gives a detailed comparison of the product portfolio of each company
Company Information
- Detailed analysis and profiling of additional market players (up to 5)
Growth opportunities and latent adjacency in Passenger Information System Market
What will be the expected growth for Passenger Information System Market during the forecast period in APAC Region