The 5G IoT market study involved the extensive use of secondary sources, directories, and databases, such as D&B Hoovers, Bloomberg Businessweek, and Factiva. Other market-related sources, such as journals and white papers from industry associations, were also considered while conducting the secondary research. Primary sources were mainly industry experts from core and related industries, preferred system developers, service providers, System Integrators (SIs), resellers, partners, and organizations related to the various segments of the industry’s value chain. In-depth interviews were conducted with various primary respondents to obtain and verify critical qualitative and quantitative information and assess the market’s prospects. These respondents included key industry participants, subject matter experts, C-level executives of key market players, and industry consultants.
Secondary Research
In the secondary research process, various secondary sources were referred to for identifying and collecting information for the study. The secondary sources included annual reports, press releases, investor presentations of companies, white papers, certified publications, and articles from recognized associations and government publishing sources. Several journals such as the International Journal of Computer Science and Information Technology and Security (IJCSITS), ScienceDirect, ResearchGate, Academic Journals, Scientific.Net, and various telecom and 5G IoT associations/forums, Citizens Broadband Radio Service (CBRS) Alliance, MulteFire Alliance, and 3GPP were also referred. Secondary research was mainly used to obtain key information about industry insights, the market’s monetary chain, the overall pool of key players, market classification, and segmentation according to industry trends to the bottom-most level, regional markets, and key developments from both market and technology-oriented perspectives.
Primary Research
In the primary research process, various primary sources from both supply and demand sides were interviewed to obtain qualitative and quantitative information for the report. The primary sources from the supply side included industry experts, such as Chief Executive Officers (CEOs), Chief Technology Officers (CTOs), Chief Operating Officers (COOs), Vice Presidents (VPs), marketing directors, technology and innovation directors, and related key executives from various key companies and organizations operating in the 5G IoT market. The primary sources from the demand side included 5G IoT network end users, network administrators/consultants/specialists, Chief Information Officers (CIOs), and subject-matter experts from enterprises and government associations.
After the complete market engineering process (including calculations for market statistics, market breakdown, market size estimations, market forecast, and data triangulation), extensive primary research was conducted to gather information and verify and validate the critical numbers arrived at. Primary research was also conducted to identify and validate the segmentation types; industry trends; key players; the competitive landscape of the market; and key market dynamics, such as drivers, restraints, opportunities, challenges, industry trends, and key strategies.
In the complete market engineering process, both top-down and bottom-up approaches and several data triangulation methods were used to perform the market estimation and forecast for the overall market segments and subsegments listed in this report. Extensive qualitative and quantitative analysis was performed on the complete market engineering process to list the key information/insights throughout the report.
After interacting with industry experts, we have also conducted brief sessions with highly experienced independent consultants to reinforce the findings from our primaries. This and the in-house subject matter expert's opinions have led us to the conclusions described in this report's remainder.
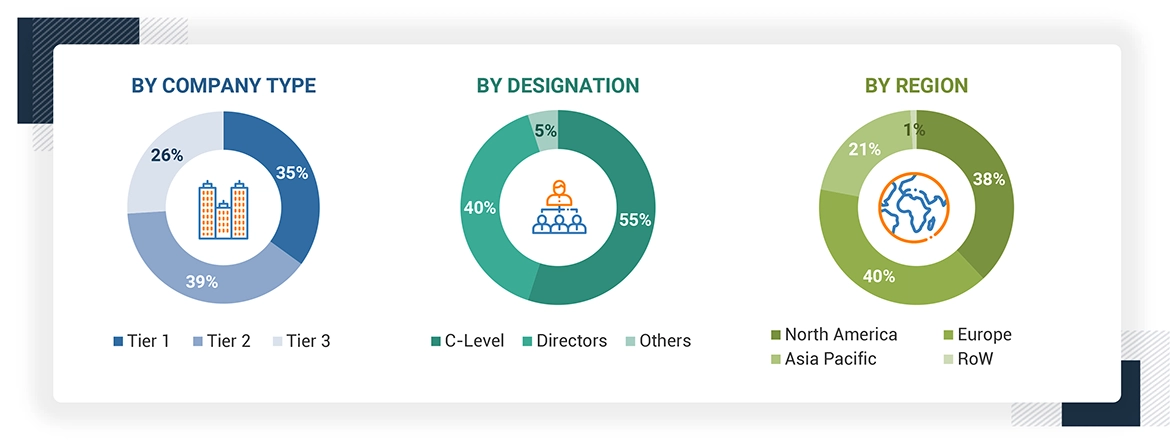
Note 1: Tier 1 companies have revenues over USD 1 billion; Tier 2 companies’ revenue ranges between USD 500 million and 1 billion; and Tier 3 companies’ revenue ranges between USD 100 million and USD 500 million
Note 2: RoW includes Middle East & Africa and Latin America
Source: Secondary Literature, Industry Experts, and MarketsandMarkets Analysis
To know about the assumptions considered for the study, download the pdf brochure
|
Company Name
|
Designation
|
|
T-Mobile
|
IoT Enterprise Manager
|
|
NEC Corporation
|
Senior Project Manager
|
|
China Mobile
|
Project Manager
|
|
Telefónica
|
5G and IoT Solutions Manager
|
Source: Secondary Literature, Industry Experts, and MarketsandMarkets Analysis
Market Size Estimation
Multiple approaches were adopted to estimate and forecast the market size of the 5G IoT market. The first approach involves the estimation of market size by summing up the revenue generated by companies through the sale of 5G IoT components, such as hardware, platform, connectivity, and services.
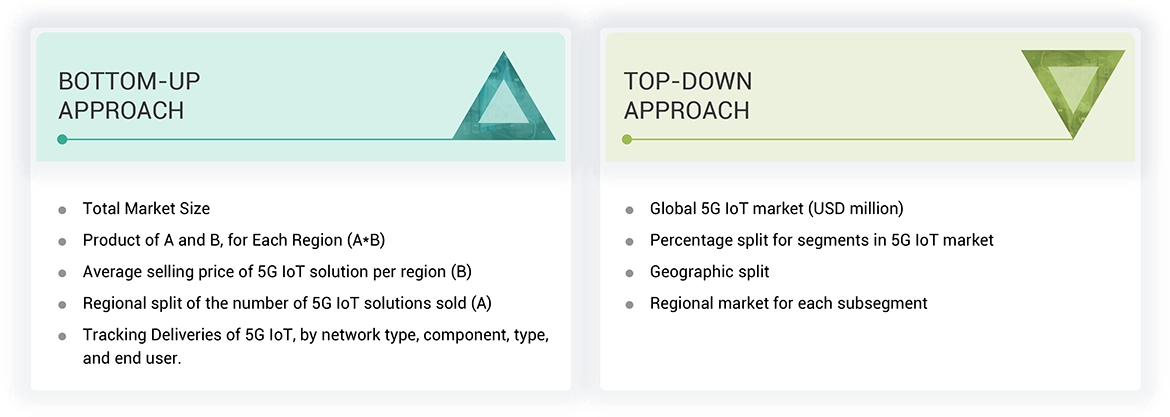
5G IoT Market: Top-Down and Bottom-Up Approach
Data Triangulation
In the top-down approach, the overall market size was used to estimate the size of the individual market segments through percentage splits obtained from secondary and primary research.
The most appropriate immediate parent market size was used to implement the top-down approach to calculate specific market segments. The bottom-up approach was implemented for the data obtained from secondary research to validate the market size of various segments.
The market share of each company was obtained to verify the revenue share used in the bottom-up approach. Through data triangulation and validation of data with the help of primary research, the overall parent market size and each market segment size were determined.
Market Definition
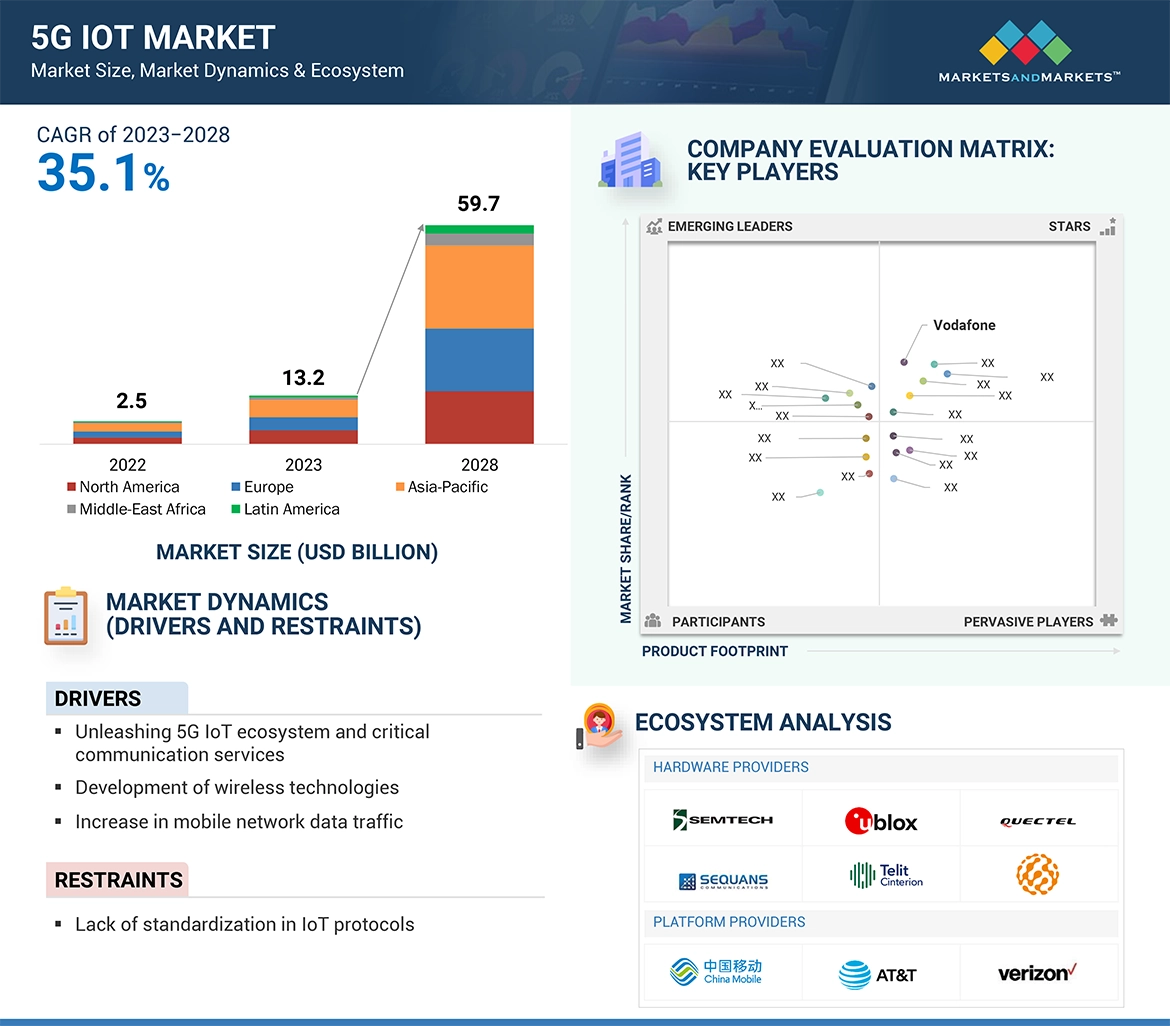
The 5G IoT market refers to the usage of 5G technology for connecting Internet of Things (IoT) devices in a short and wide range, coupled with extraordinary bandwidth, wider network capacity and coverage, low latency, greater security, and higher power efficiency. The market comprises hardware, platform, connectivity, and services enabling 5G IoT connectivity for billions of IoT devices with the right speed, power, security, and latency combination.
Stakeholders
-
Network Infrastructure Enablers
-
Technology Vendors
-
Mobile Network Operators (MNOs)
-
Independent Software Vendors (ISVs)
-
Communication Service Providers (CSPs)
-
System Integrators (SIs)
-
Neutral Host Operators
-
Resellers
-
Value-added Resellers (VARs)
-
Managed Service Providers (MSPs)
-
Compliance Regulatory Authorities
-
Government Authorities
-
Investment Firms
-
Cloud Service Providers
-
5G Iot Alliances/Groups
-
Original Design Manufacturers (ODMs)
-
Original Equipment Manufacturers (OEMs)
-
Enterprises/Businesses
Report Objectives
-
To determine, segment, and forecast the global 5G IoT market by component, network type, organization size, type, end user, and region in terms of value
-
To forecast the size of the market segments with respect to five main regions: North America, Europe, Asia Pacific, Latin America, and Middle East & Africa
-
To provide detailed information about the major factors (drivers, opportunities, threats, and challenges) influencing the growth of the 5G IoT market
-
To study the complete value chain and related industry segments and perform a value chain analysis of the 5G IoT market landscape
-
To strategically analyze macro and micromarkets with respect to individual growth trends, prospects, and contributions to the total 5G IoT market
-
To analyze industry trends, pricing data, and patents and innovations related to the 5G IoT market
-
To analyze opportunities in the market for stakeholders by identifying the high-growth segments of the 5G IoT market
-
To profile key players in the market and comprehensively analyze their market share/ranking and core competencies
-
To track and analyze competitive developments, such as mergers and acquisitions, new product launches and developments, partnerships, agreements, collaborations, business expansions, and Research and Development (R&D) activities
Available Customizations
Along with the market data, MarketsandMarkets offers customizations as per the company’s specific needs. The following customization options are available for the report:
-
Further breakdown of South Korean 5G IoT market
Product Analysis
-
Product Matrix, which gives a detailed comparison of the product portfolio of each company.
Company Information
-
Detailed analysis and profiling of additional market players (up to five)


 Largest Market Share 2023
 INDIA FASTEST-GROWING MARKET IN REGION
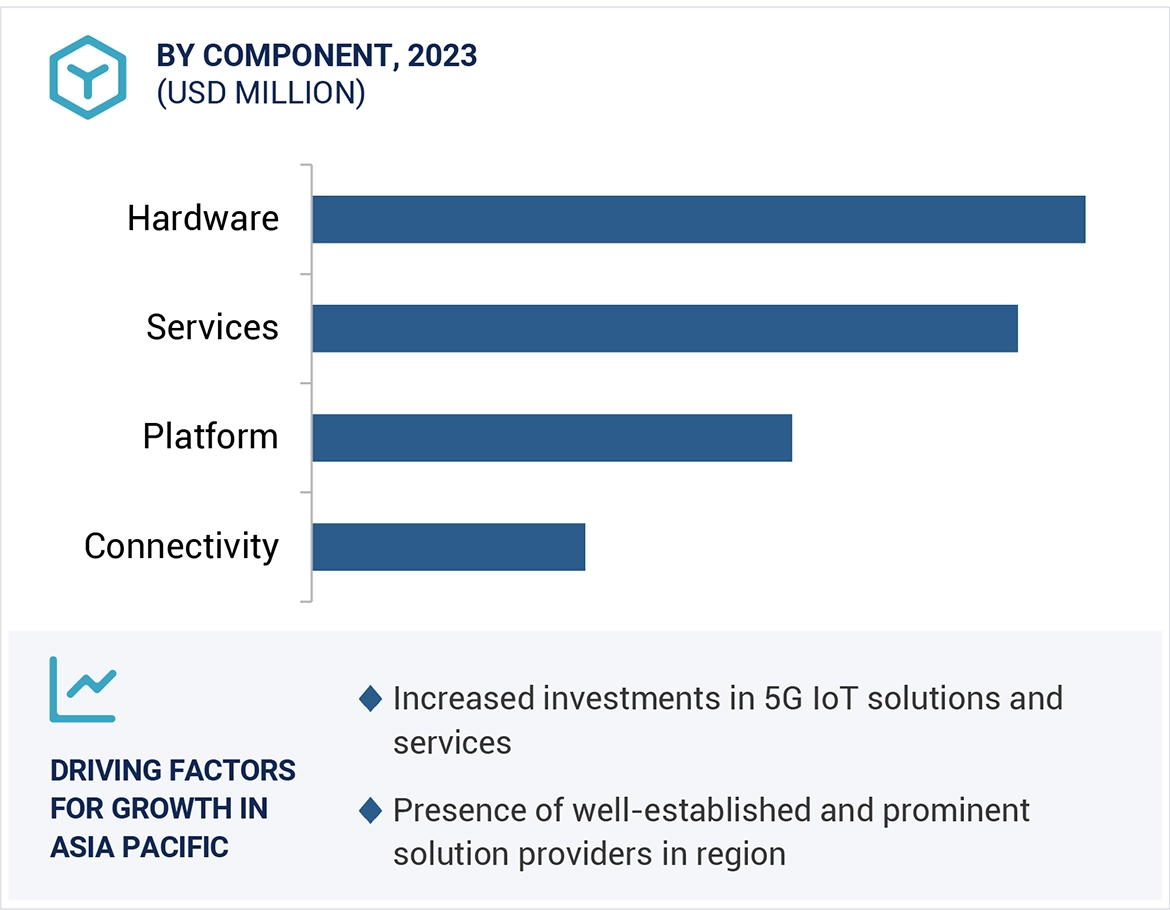


Growth opportunities and latent adjacency in 5G IoT Market