
Industrial Cannabis Market Size, Growth & Latest Trends

Industrial Cannabis Market by Compound Type (THC-dominant, CBD-dominant, Balanced THC & CBD), Product Type (Flowers/Buds, Oil/Tinctures, Edibles, Topicals, Other Product Types), Application (Medical Use, Recreational Use, Industrial Use, Nutraceutical & Wellness Use, Cosmetics & Personal Care Use), Source (Hemp, Marijuana) and Region - Global Forecast to 2030


OVERVIEW
Source: Secondary Research, Interviews with Experts, MarketsandMarkets Analysis
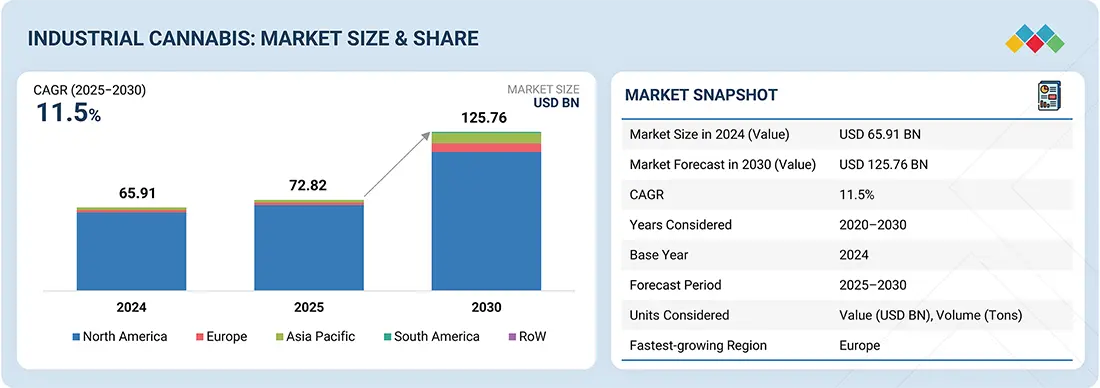
The industrial cannabis market is projected to expand from USD 72.83 billion in 2025 to USD 125.76 billion by 2030, at a CAGR of 11.5% during the forecast period. The cannabis product market is growing as consumers strive to be more health-focused, wellness-oriented, and ready to explore alternative therapies to help manage medical challenges and or help with overall quality of life. The push for a global market for medical and recreational cannabis, especially in emerging markets, increases demand, so businesses need to implement reliable quality assurance and testing practices to demonstrate product efficacy, consumer safety, and maintain market viability as the international trade regulation environment continues to change.
Market Size and Forecast:
- Market Size Value in 2024: USD 65.91 Billion
- Market Size Value in 2025: USD 72.83 Billion
- Revenue Forecast in 2030: USD 125.76 Billion
- Growth Rate: CAGR of 11.5% from 2025 to 2030
- Data available from 2020 to 2030
- Base year: 2024
- Forecast period: 2025–2030
- North America is expected to dominate the industrial cannabis market, with a share of 93.3% in 2025.
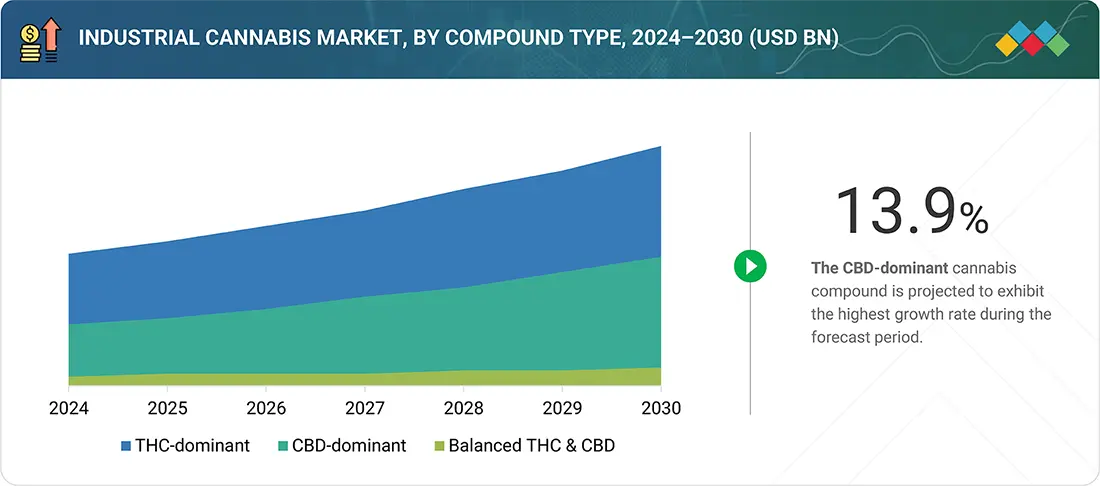
- The CBD-dominant segment is expected to register the highest CAGR of 13.9%.
Key Market Trends and Insights
- By Compound Type: Increasing demand for cannabinoids such as THC, CBD, and other emerging compounds across medical, pharmaceutical, wellness, and industrial applications is driving growth in the industrial cannabis market.
- Growth Drivers: Industrial cannabis offers versatile applications, sustainable raw material sourcing, high biomass yield, low environmental impact, and increasing commercial value across multiple end-use industries, supporting strong market expansion.
- Growing Trends: Manufacturers and cultivators are increasingly investing in advanced cultivation technologies, controlled-environment agriculture, hemp-based sustainable products, and cannabinoid extraction processes to improve productivity, product quality, and supply chain efficiency.
- Growth Opportunities: Expanding legalization of cannabis and hemp cultivation, increasing demand for eco-friendly industrial materials, growing investments in cannabis research and processing infrastructure, and rising adoption of hemp-based products across industrial sectors are creating substantial growth opportunities for the industrial cannabis market.
KEY TAKEAWAYS
- North America is expected to dominate the industrial cannabis market, with a share of 93.3% in 2025.
- By compound type, the CBD-dominant segment is expected to register the highest CAGR of 13.9%.
- By product type, the oil/tinctures segment is projected to grow at the fastest rate from 2025 to 2030.
- By application, the recreational-use segment is expected to dominate the market.
- By source, the hemp-based segment is expected to grow at the fastest rate during the forecast period.
- Key players in the industrial cannabis market include Canopy Growth Corporation, Curaleaf, and Cresco Labs. These companies focus on large-scale cultivation, processing, and the development of cannabinoid-based products for medical, wellness, and adult-use applications.
- Key startups in the industrial cannabis market include Blüm Holdings Inc., Organigram Global, and Terrascend, These companies are focusing on innovative cultivation models, high-efficiency extraction methods, and product diversification.
Manufacturers and growers need to ensure their products meet quality, safety, and regulatory conditions as global legalization occurs. Add in the growing number of stories of product contamination, counterfeit cannabis products, and variable potency levels, we are seeing a push on leading-edge testing and quality assurance to comply with what consumers expect as a compliance experience. Companies are forming strategic partnerships with local cultivators, distributors, and technology firms to strengthen their supply chains, expand their market reach, and innovate on product delivery methods.
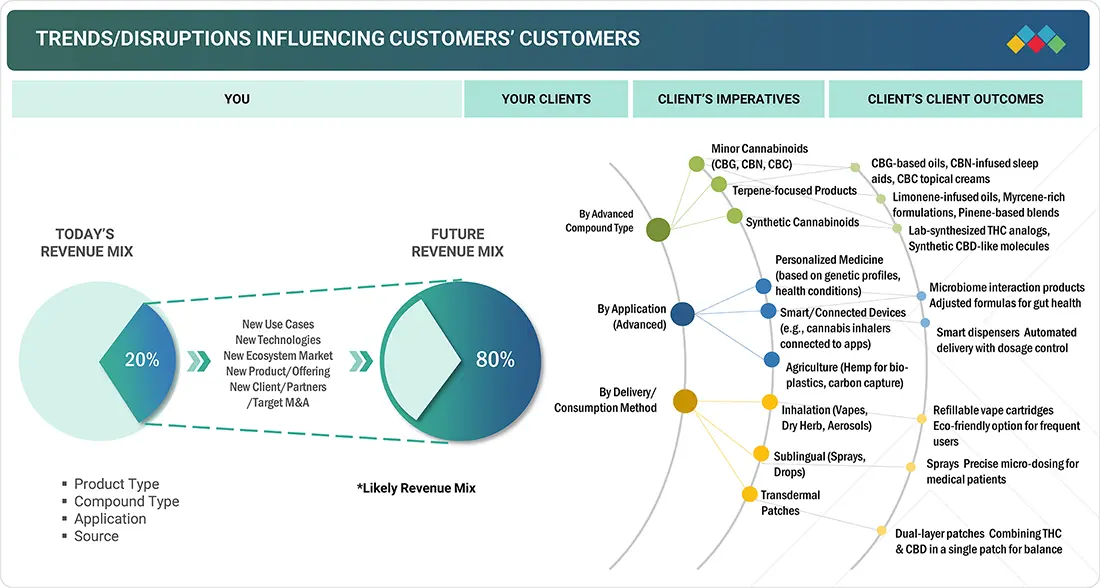
TRENDS & DISRUPTIONS IMPACTING CUSTOMERS' CUSTOMERS
The cannabis market is quickly changing due to rising demand for high-quality, compliant, and traceable cannabis products across pharmaceutical, wellness, food, and industrial sectors. Trends like clean-label formulations, plant-based therapeutics, sustainable industrial materials, and organic certification drive major shifts in cultivation, extraction, and testing methods. Technological advances, such as precision cultivation systems, AI-driven extraction optimization, quick cannabinoid profiling, and blockchain-based traceability, disrupt traditional processes. Moreover, growing regulatory focus on product safety, potency consistency, and contaminant control is guiding companies toward more advanced, standardized, and transparent operations. As the global cannabis trade and medical use grow, the harmonization of regulatory standards and the digitalization of supply chain management are becoming key trends that will shape the future of the industrial cannabis industry.
Source: Secondary Research, Interviews with Experts, MarketsandMarkets Analysis
MARKET DYNAMICS
Level
-
Increasing cannabis demand for medicinal applications Rising demand for hemp-based products (textiles, food, cosmetics, bioplastics)

Level
-
Stigma and social acceptance issues Stringent regulatory environment across countries

Level
-
Edibles, led by gummies and chocolates, to present additional growth opportunities for the cannabis business Growing interest in sustainable alternatives to plastics and textiles

Level
-
Intensive water consumption and inability to maintain consistency during cannabis cultivation Lack of standardized quality control and processing infrastructure

Source: Secondary Research, Interviews with Experts, MarketsandMarkets Analysis
Driver: Increasing cannabis demand for medicinal applications
In the US, medical cannabis is regulated by every state, with more than two-thirds of states, plus the District of Columbia, legalizing it for medical use and more considering licensing for official usage. The Food and Drug Administration has granted approval to cannabis-based treatments to manage rare types of epilepsy such as Dravet syndrome and Lennox-Gastaut syndrome. Worldwide, there is an on-going discussion about moral and ethical concerns, but the acceptance of medical cannabis continues to be on the rise. Cannabidiol (CBD), an extract of cannabis with little to no psychoactive properties, is considered to be a safe and effective treatment for insomnia, anxiety, epilepsy, spasticity, chronic pain, and inflammation. Epidiolex, a cannabis product approved by the FDA, is known to reduce seizure frequency and severity significantly. There is international acceptance of a combination product called Sativex containing CBD and THC for spasticity associated with multiple sclerosis. THC-containing medications that are FDA-approved for treating chemotherapy-associated nausea and appetite loss associated with AIDS are dronabinol and nabilone. There is promising evidence that full-spectrum cannabis extract and CBD have therapeutic potential benefits for managing anxiety, pain, inflammation, and symptoms of viral infection, with fewer side effects than other common medications. For example, in June 2025, Tilray Medical released new pharmacokinetic evidence concerning THC and CBD formulations, along with augmenting its European distribution after the Italian Ministry of Health issued additional approvals. This clearly extends Tilray's ability to supply quality-controlled therapeutic products. Panaxia Pharmaceutical Industries, of Israel, is establishing a transaction footprint in Europe, having successful tenders to supply its products to distributors in France, Germany, and Cyprus, while simultaneously accelerating clinical trials for the sublingual tablets and metered-dose inhalers for consistent dosing. Finally. Ananda Pharma is advancing proprietary CBD-based drug candidates to treat chemotherapy-induced neuropathy and inflammatory pain and has moved into Phase II studies required for regulatory approval. On the supply side, Ondara in Spain received cultivation and production licenses in July 2025 from the Spanish Medicines Agency to significantly increase the output of medicinal cannabis in Soria, which reinstated more than 40 jobs and reinforced Europe's local supply chain. Together, these advances highlight how an expanding therapeutic use or category - with supporting clinical evidence, regulatory approval, and supply chain stores - removes cannabis product barriers as countries and companies innovate to meet higher patient and healthcare demand.
Restraint: Stigma and social acceptance issues
The stigmatization of cannabis is a major barrier to the growth of the global cannabis market. The number of countries that have legalized medicinal and recreational cannabis is growing. Regardless, even with increasing legalization, some of the negative perceptions associated with cannabis use (for instance, that cannabis is linked to crime, addiction, and deterioration of morality) remain among certain segments of the public, civic leaders, policymakers, and healthcare practitioners. This stigma will discourage some prospective patients from using cannabis-based therapies, will limit their interest in investing in cannabis, and will prevent healthcare providers from prescribing or endorsing cannabis-based therapies. For example, the UNODC World Drug Report 2024 ensures that cannabis is seen as a drug of dependence and as a gateway drug in certain areas of the globe (UNODC, 2024), which is inconsistent with the increasing evidence to show the medicinal benefits of cannabis. Similarly, the European Monitoring Centre for Drugs and Drug Addiction (EMCDDA) briefing "Explaining Medical Cannabis" (EMCDDA, 2023) repeats that stigma from the general public in some parts of Europe and stigma from policymaking limited the proliferation of availability of medical cannabis, with some countries still hesitating on its approval as part of their national health system. Even in the US, although legalization has progressed where legislation has passed to legalize cannabis, the FDA's limited acknowledgment of FDA-registered products (the FDA does not allow non-FDA cannabis products as part of their use) is a mark of caution - a situation which is repeated within health settings as evidenced within the health response to the COVID-19 pandemic where caution was the guiding force in many health care settings. Furthermore, the National Institute on Drug Abuse (NIDA) continues to publicize potential risks associated with long-term recreational cannabis use, thus intensifying concerns in conservative communities and among some policymakers. This ongoing social and regulatory stigma not only alters consumption behavior but also affects policy decisions, including healthcare integration and market development - ultimately hindering the growth of the cannabis industry around the world.
Opportunity: Edibles, led by gummies and chocolates, to present additional growth opportunities for cannabis business
Edibles mostly come in gummies and chocolates, but are among the fastest-growing and most valuable sectors of the cannabis industry. Edibles are easy-to-consume, convenient, discreet, and smoke-free, and this is why the edibles market is growing quickly. The National Cannabis Industry Association (NCIA) reported in a 2023 cannabis market report, the demand and sales of edibles, especially gummies and chocolates, continued to rise due to convenience, consistent dosages, and long shelf-life. The Canadian government’s Cannabis Act regulations, updated in 2020, allowed cannabis-infused edibles with a 10mg THC per package limit, and the segment gained marked market share, particularly among new users and occasional users. The Marijuana Enforcement Division (MED) in Colorado reported record edible sales from 2020 to 2022, with gummies making up the biggest slice of the market share. Top brands, such as Wyld and Kiva Confections, have successfully taken their THC- and CBD-infused edibles across various states that legalized cannabis. The trend toward micro-dosing and wellness-related edibles continues to take root, while AB InBev and Tilray invested USD 100 million in a partnership to produce cannabis-infused beverages in the Canadian market, where Coca-Cola, Constellation Brands, Gfarmalabs, MPX, Sprig, and many others are expanding. As legal cannabis markets grow globally, edibles will continue to be a large and growing segment due to both recreational markets and therapeutic markets to support consumers through stress, sleep, and pain management.
Challenge: Intensive water consumption and inability to maintain consistency during cannabis cultivation
Water use continues to be one of the biggest issues for the cannabis market, especially in large-scale and indoor cultivation. The California Department of Fish and Wildlife (CDFW) said that a cannabis plant can use as much as 22 liters of water per day during the peak growing cycle, much more than most crops. Water is particularly relevant in states like California that face dilemmas related to water scarcity, where these crops are subject to drought conditions and extensive regulations. Additionally, when unregulated, the US Department of Agriculture (USDA) has raised concerns about cannabis cultivation depleting local water reserves and ecosystem disruptions. Another important issue is controlling the quality of the product throughout cultivation. Cannabis can react dramatically just with minor changes to temperature, humidity, water quality, and nutrients, leading to different cannabinoid and terpene profiles. The National Cannabis Industry Association (NCIA) says that even slight changes in environmental conditions can affect a plant’s chemical composition, which can change potency, taste, and therapeutic qualities. Alterations to composition can, in turn, affect the potency, flavor, and therapeutic value of the product. This fluctuation results in inconsistency for medicinal patients who need the same dosages reliably and recreational users who want the same experience every time. To combat this issue, the California Department of Cannabis Control (DCC) has imposed stringent environmental and quality control regulations, especially with strategic water-use reporting, sustainable water use, and mandatory product testing.
cannabis market: COMMERCIAL USE CASES ACROSS INDUSTRIES
| COMPANY | USE CASE DESCRIPTION | BENEFITS |
|---|---|---|
 |
Launch of infused pre-rolls with THCA diamonds, premium flower, and high-potency formats | Expanded portfolio in adult-use market; meets demand for potent, quality products |
 |
Multi-state dispensary and branded products (edibles, oils, vapes, wellness lines) | National reach; wide consumer base; strong compliance and regulatory expertise |
 |
Pharmaceuticals, concentrates, and global research partnerships | High product consistency; medical market leadership; innovation in formulations |
 |
Low-dose edibles, specialty vapes, infused cannabis beverages | Attracts casual and social users; compliance with evolving regulations; consumer convenience |
 |
Strategic partnership in vape and wellness products (Altria investment) | Access to tobacco distribution channels; scalable innovation capacity |
Logos and trademarks shown above are the property of their respective owners. Their use here is for informational and illustrative purposes only.
MARKET ECOSYSTEM
Some of the prominent companies in this market include well-established and financially sound cannabis manufacturers. These companies have been operational in the market for more than a decade and have diversified portfolios, the latest technologies, and excellent global sales and marketing networks. Some of the prominent companies in this market include Canopy Growth Corporation (Canada), Aurora Cannabis Inc. (Canada), VIVO Cannabis Inc. (Canada), Tilray (US), and Unrivaled Brand Inc. (US).
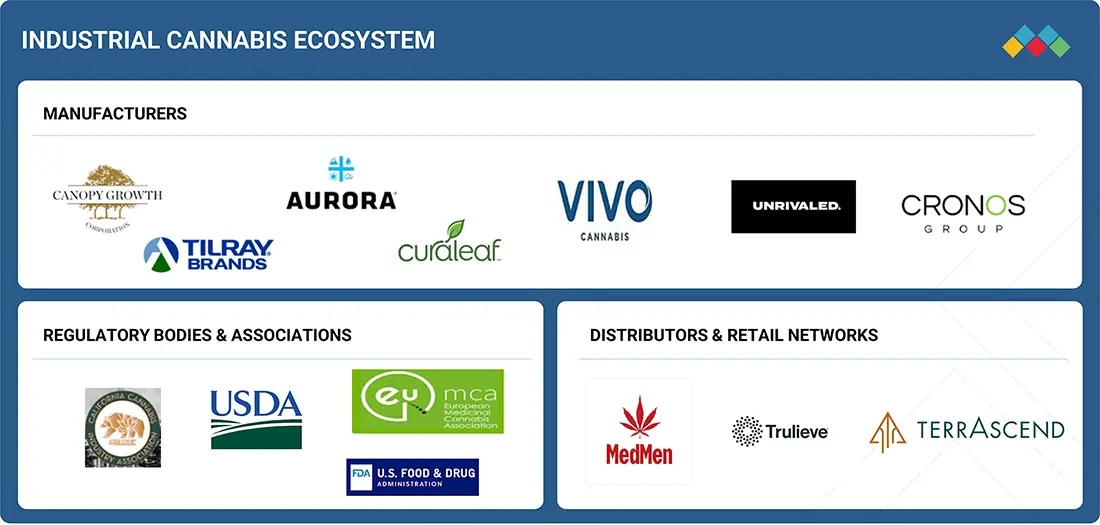
Logos and trademarks shown above are the property of their respective owners. Their use here is for informational and illustrative purposes only.
MARKET SEGMENTS
Source: Secondary Research, Interviews with Experts, MarketsandMarkets Analysis
Industrial Cannabis Market, By Compound Type
The THC-dominant segment holds the largest market share during the forecast period. THC is the primary cannabinoid ingredient in cannabis and is sought after for its recreational psychoactive effects, but is also used medically as an analgesic (pain-relieving) and sleep aid. Strict analysis of the sedative effects of THC and the potential adverse events and side effects, like anxiety, makes medicinal use have limited potential. The legalization of cannabis for recreational use continues to expand, which has increased demand for THC-rich strains as the legal status of cannabis in the United States continues to evolve. Developments in hemp-THC drinks continue to break boundaries. In March 2025, Trulieve, Curaleaf, and Green Thumb Industries (GTI) partnered with hemp-THC beverage manufacturers to enter the beverage market and to satisfy growing demand. Meantime, Delta-8-THC, a milder and hemp-THC alternative, has gained a piece of the market, though many health authorities have raised concerns about safety and legality. The Centers for Disease Control and Prevention (CDC) and the Food and Drug Administration (FDA) have issued health warnings, and numerous states in the U.S. have written new state laws or changed federal laws to outlaw Delta-8-THC or drastically restrict market access.
Industrial Cannabis Market, By Application
The recreational use segment holds the highest market share during the forecast period. The expected largest market share goes to recreational cannabis, due in part to increased legalization, cultural changes, and product innovation. Consumers will benefit from fast-growing recreational markets over the next few years, especially with more states, such as Florida and Pennsylvania, following suit with legalization for adult-use. Also, established cannabis markets such as Ohio and New York are helping create a strong consumer demand for recreational markets. Flower, edibles, concentrates, and infused beverages are being offered in a variety of ways to a diverse consumer base that is looking for alternatives that are smoke-free, wellness-focused, and social. Rapid enhancements in technology itself and the rise of online retail platforms are also creating better consumer accessibility with enhanced delivery options and sometimes standardized quality products. For instance, in March 2025, Green Thumb Industries announced (in a partnership to run for 2 years) a new opportunity to provide THC-infused gummies, chocolates, and margaritas at live music shows at the Salt Shed in Chicago; this is an example of providing for cannabis beverage consumers in a social consumption environment. Aurora Cannabis also launched low-dose edibles called "Lil' Bits" along with Mango XL vape in June 2023, both new products focus on recreating the opportunities for use as a low-dose micro-dosing option or as flavor-infused cannabis recreational products for new and occasional consumers. This represents a great area of potential; therefore, with respect to cannabis markets, continued legalization, available product variations and consumption experiences opportunities deserve market growth implications for at least the next few years.
REGION
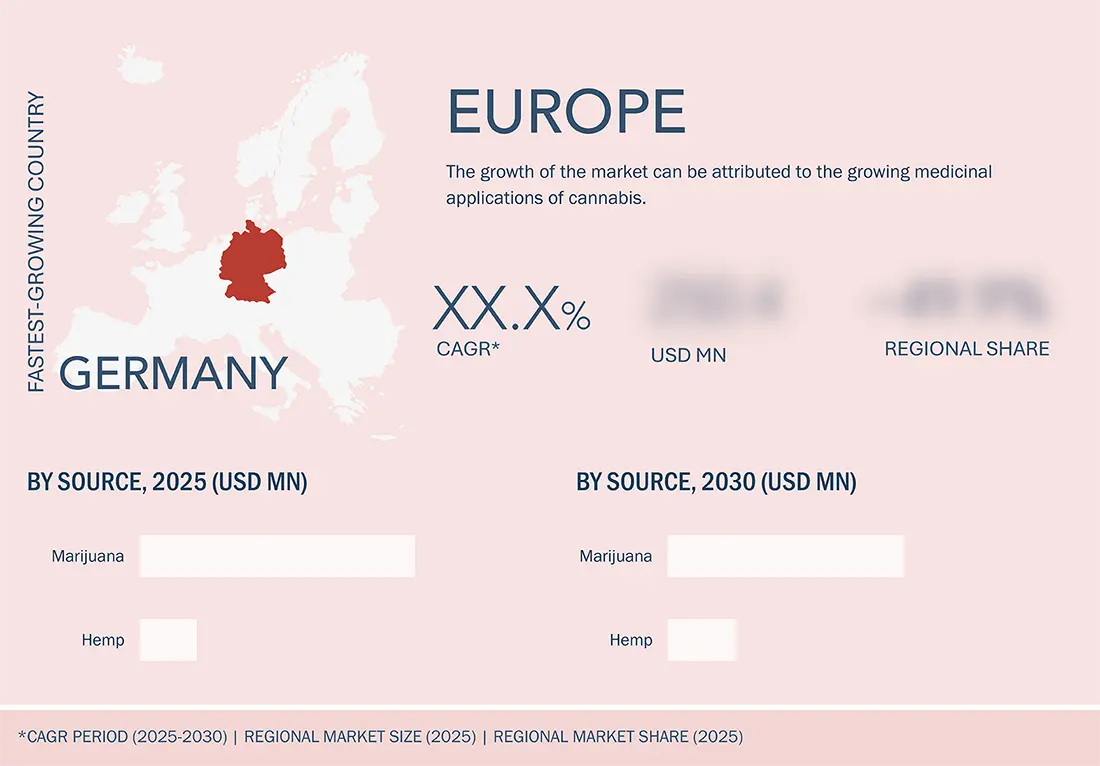
Europe is estimated to be the fastest-growing market during the forecast period
Europe accounts for the fastest-growing industrial cannabis market, which is driving because legalizing medical cannabis is expanding, more public acceptance is emerging, and the supportive clinical research for the use of cannabis-based therapies is increasing for chronic pain, epilepsy, multiple sclerosis, and more. The increased interest in wellness, as well as demand for alternatives, especially plant-based alternatives, has added momentum to this expansion. The loosening of restrictions on imports and cultivation in countries such as Germany, the UK, and Portugal has provided opportunities for domestic production and cross-border trade. The introduction of low-THC, hemp-derived CBD products has expanded the consumer base as well.
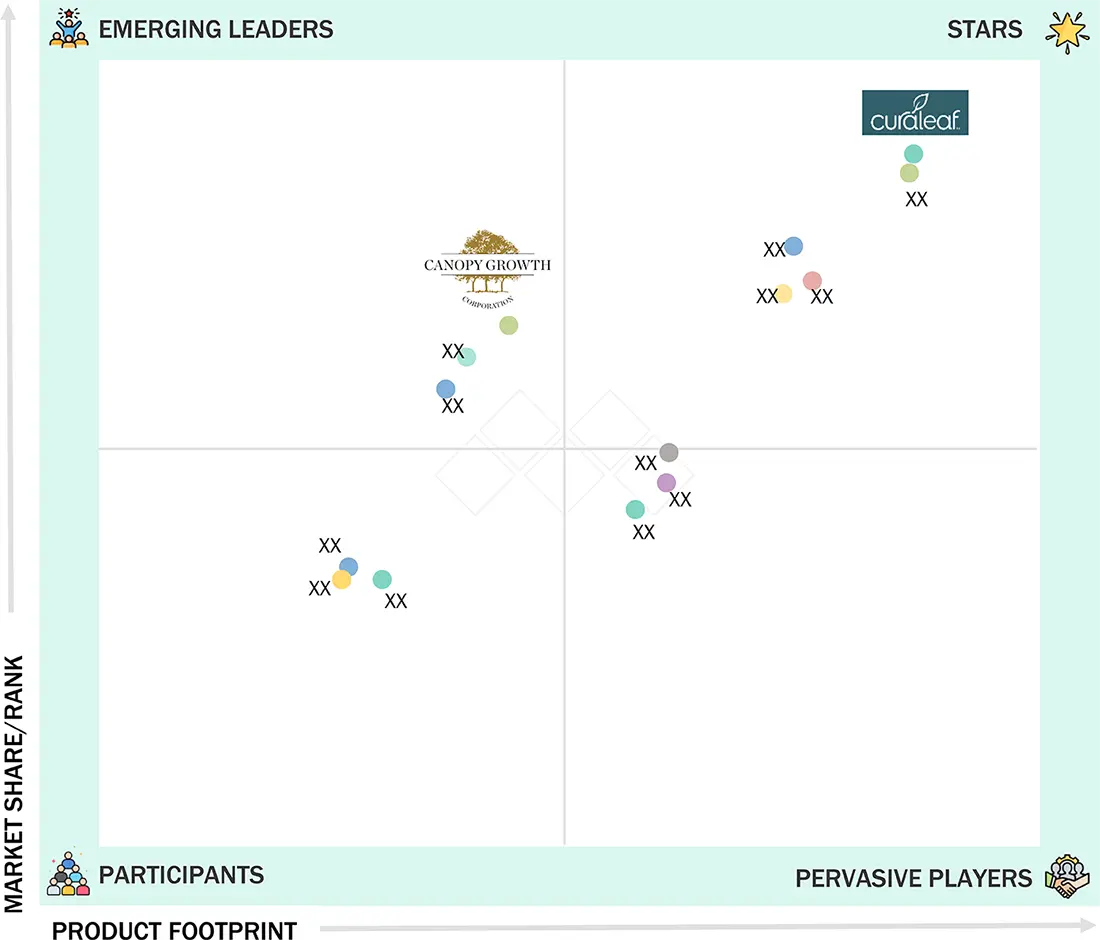
cannabis market: COMPANY EVALUATION MATRIX
In the industrial cannabis market matrix, Cureleaf leads with a strong market share and extensive product portfolio, driven by its advanced cultivation practices, broad range of hemp-derived products, and robust distribution channels across wellness, therapeutic, and industrial segments. Canopy Growth Corporation (Emerging Leader) is gaining visibility with its diversified product offerings, strong research capabilities, and strategic partnerships, strengthening its position through innovation and expanding its global footprint. While Cureleaf dominates through scale, vertical integration, and a diversified portfolio, Canopy Growth Corporation shows significant potential to move toward the leaders’ quadrant as the demand for high-quality, regulated hemp and CBD products continues to grow.
Source: Secondary Research, Interviews with Experts, MarketsandMarkets Analysis
KEY MARKET PLAYERS
- Canopy Growth Corporation (Canada)
- Curaleaf (US)
- Cresco Labs (US)
- Green Thumb Industries (GTI) (US)
- Tilray Brands (US)
- Aurora Cannabis Inc. (Canada)
- Trulieve (US)
- Medmen (US)
- Blüm Holdings Inc. (US)
- Organigram Global (Canada)
- Terrascend (US)
- Village Farms International Inc. (US)
- Verano (US)
- The Cronos Group (Canada)
- Medical Marijuana, Inc. (US)
MARKET SCOPE
| REPORT METRIC | DETAILS |
|---|---|
| Market Size in 2025 (Value) | USD 72.83 Billion |
| Market Forecast in 2030 (Value) | USD 125.76 Billion |
| Growth Rate | CAGR of 11.5% during 2025-2030 |
| Years Considered | 2020–2030 |
| Base Year | 2024 |
| Forecast Period | 2025–2030 |
| Units Considered | Value (USD Million), Volume (Tons) |
| Report Coverage | Revenue forecast, company ranking, competitive landscape, growth factors, and trends |
| Segments Covered | By Compound Type: THC-dominant, CBD-dominant, Balanced THC & CBD |
| Regions Covered | North America, Europe, Asia Pacific, South America, and Rest of the World (RoW) |
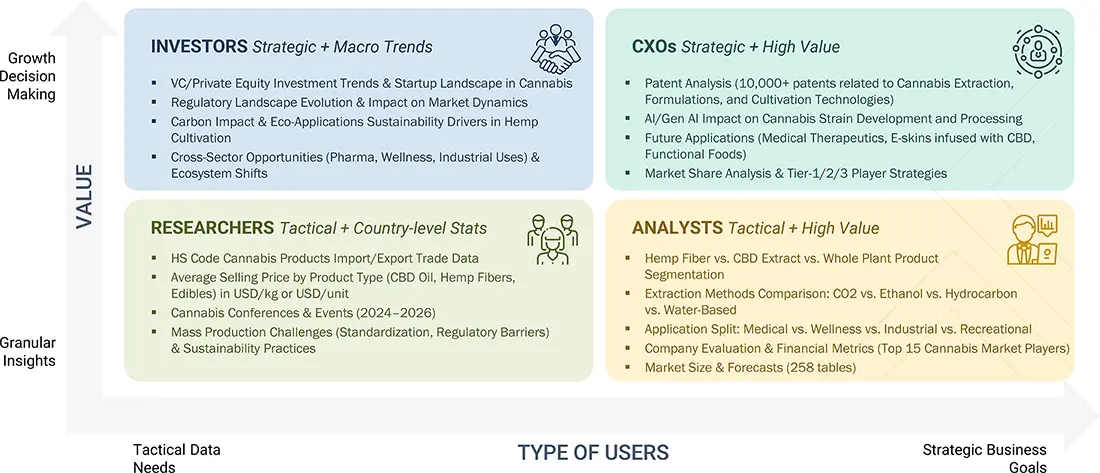
WHAT IS IN IT FOR YOU: cannabis market REPORT CONTENT GUIDE
DELIVERED CUSTOMIZATIONS
We have successfully delivered the following deep-dive customizations:
| CLIENT REQUEST | CUSTOMIZATION DELIVERED | VALUE ADDS |
|---|---|---|
| Leading Cannabis Brand/Operator | Competitive profiling of licensed producers, extractors, and processors (financials, certifications, product range) | Identify compliant material and processing partners |
| Cannabis Extract Manufacturer | Market adoption benchmarking across product types (flower, oils, vapes, edibles, topicals) | Insights on extract segment growth in medical vs. recreational channels |
| Dispensary Chain | Consumer trend and product segmentation (THC/CBD/CBN blends, edible vs. smokeable) | Strengthen positioning in high-growth formats |
| Raw Material Supplier | Global & regional supply chain benchmarking for cannabis biomass, hemp, and packaging | Strengthen forward integration with processors |
RECENT DEVELOPMENTS
- July 2025 : Canopy Growth launched Deep Space Infused Pre-Rolls, which combine liquid and THCA diamonds to enable THC of over 60%. They rolled out these GIANT pre-rolls in bold flavors and with good yields, which will help Canopy take a significant piece of the rapidly growing infused pre-roll segment and directly target experienced consumers looking for the strongest and most flavorful experiences.
- November 2024 : Canopy Growth executed a successful launch of Claybourne's Frosted Flyers infused pre-rolls in Canada. These infused pre-rolls are high-potency formats that use only premium indoor flowers with THCa coating, and an enhancement by terpenes. This line of infused pre-rolls helps the firm leverage the subject of growing demand in the infused pre-roll space, and bolsters Canopy's competitive edge in the rapidly growing Canadian adult-use market for cannabis.
- March 2021 : Curaleaf concluded the acquisition of Emmac Life Sciences, a European marijuana startup, for USD 286 million. This acquisition would boost Curaleaf's geographic reach to eight countries, including Portugal, Spain, Germany, Italy, and the UK.
- March 2022 : Cresco Labs entered into a definitive agreement to acquire Columbia Care, one of the top producers, manufacturers, and suppliers of cannabis in the US. The acquisition will also help Cresco Labs expand within the US strategic market, one of the largest and fastest-growing cannabis markets in the world.
- December 2021 : Green Thumb Industries Inc. acquired LeafLine Industries. LeafLine is one of only two licensed cultivators in Minnesota's medical cannabis industry and is licensed to grow, process, and dispense cannabis products directly to patients. With this acquisition, the company expanded its market footprint into Minnesota.
Table of Contents
 Exclusive indicates content/data unique to MarketsandMarkets and not available with any competitors.
Methodology
The study employed two main methods to estimate the current size of the cannabis market. Comprehensive secondary research was conducted to gather information on the market, peer markets, and parent markets. The next stage involved validating these findings, assumptions, and estimates with industry experts across the value chain through primary research. Both top-down and bottom-up approaches were used to determine the overall market size. Subsequently, market segmentation and data triangulation were applied to estimate the sizes of segments and subsegments.
Secondary Research
This research involved extensively using secondary sources such as directories and databases (Bloomberg Businessweek, Factiva, etc.) to gather information for a technical, market-focused, and commercial market study. In the secondary research process, various sources such as company annual reports, press releases, and investor presentations, white papers, food journals, certified publications, articles from recognized authors, directories, and databases were used to identify and gather information.
Secondary research was primarily used to gather key information about the industry’s supply chain, the overall pool of major players, and market classification and segmentation based on industry trends. It also covered regional markets and key developments from market and technology perspectives.
Primary Research
Extensive primary research was conducted after gathering information on the cannabis market scenario through secondary research. Several interviews with market experts from both demand and supply sides were conducted across major countries in North America, Europe, Asia Pacific, South America, and the Rest of the World. Data was collected through questionnaires, emails, and phone calls. On the supply side, primary sources included industry experts such as Chief X Officers (CXOs), Vice Presidents (VPs), Directors from business development, marketing, research, and development teams, along with key opinion leaders. These interviews provided insights on market statistics, revenue data from products and services, market breakdowns, market size estimates, forecasts, and data triangulation. They also helped understand trends related to cannabis product types, compounds, applications, sources, and regions. Stakeholders from the demand side, such as research institutions, universities, and third-party vendors, were interviewed to gain perspectives on the buyer’s view of the service, current cannabis usage, and future business outlook, all of which influence the overall market.

Note: The three tiers of the companies are defined based on their total revenues in 2023 or 2024, as per
the availability of financial data: Tier 1: Revenue > USD 1 billion; Tier 2: USD 100 million = Revenue = USD 1 billion;
Tier 3: Revenue < USD 100 million.
To know about the assumptions considered for the study, download the pdf brochure
|
COMPANY |
DESIGNATION |
|
Canopy Growth Corporation (Canada) |
R&D Expert |
|
Curaleaf (US) |
Sales Manager |
|
Cresco Labs (US) |
Manager |
|
Green Thumb Industries (GTI) (US) |
Sales Manager |
|
Tilray Brands (US) |
Marketing Manager |
Cannabis Market Size Estimation
Both the top-down and bottom-up approaches were employed to estimate and verify the overall size of the cannabis market. These methods were also used extensively to determine the size of various market subsegments. The research methodology for estimating the market size includes the following details:
- The key players in the industry and the overall markets were identified through extensive secondary research.
- All shares, splits, and breakdowns were determined using secondary sources and verified through primary sources.
- All possible parameters that affect the market covered in this research study were accounted for, viewed in extensive detail, verified through primary research, and analyzed to obtain final quantitative and qualitative data.
- The research included the study of reports, reviews, and newsletters of top market players, along with extensive interviews for opinions from leaders, such as CEOs, directors, and marketing executives.
Cannabis Market : Top-Down and Bottom-Up Approach

Data Triangulation
After arriving at the overall market size from the estimation process explained above, the total market was split into several segments and subsegments. The data triangulation and market breakdown procedures were employed, wherever applicable, to estimate the overall cannabis market and arrive at the exact statistics for all segments and subsegments. The data was triangulated by studying various factors and trends from the demand and supply sides. The market size was also validated using both the top-down and bottom-up approaches.
Market Definition
According to the National Institute on Drug Abuse, cannabis refers to the dried leaves, flowers, stems, and seeds of the cannabis plant, which contain various chemical compounds, including tetrahydrocannabinol (THC), the primary psychoactive ingredient responsible for its mind-altering effects. The cannabis market involves the cultivation, processing, distribution, and sale of cannabis and its derivatives for a wide range of applications, including medical, recreational, wellness, and industrial uses. It covers diverse product categories such as dried flower, oils, edibles, topicals, and infused beverages. It is governed by region-specific legal frameworks to ensure product safety, quality standards, and responsible consumer access.
Stakeholders
- Cannabis growers
- Cannabis product manufacturers
- Cannabis importers and exporters
- Cannabis traders, distributors, and suppliers
- Government and research organizations
-
Associations, regulatory bodies, and other industry-related bodies:
- Food and Drug Administration (FDA)
- United States Department of Agriculture (USDA)
- Federal Institute for Drugs and Medical Devices or Bundesinstitut für Arzneimittel und Medizinprodukte (BfArM)
- Bureau for Medicinal Cannabis (BMC)
- Health Canada
- Federal Commission for the Protection against Sanitary Risks (COFEPRIS)
- National Cannabis Industry Association (NCIA)
- The European Medicinal Cannabis Association (EUMCA)
- The National Association of Cannabis Businesses (NACB)
- California Cannabis Industry Association
- Australian Medical Cannabis Association
- Israel Cannabis Association (ICA).
Report Objectives
- To determine and project the size of the cannabis market by product type, compound type, application, source, and region in terms of value and volume from 2025 to 2030
- To identify attractive opportunities in the market by determining the largest and fastest-growing segments across regions
- To provide detailed information about the key factors influencing market growth (drivers, restraints, opportunities, and challenges)
- To analyze the opportunities in the market for stakeholders and provide details of the competitive landscape for market leaders
- To analyze micromarkets with respect to individual growth trends, prospects, and their contribution to the total market
- To identify and profile the key players in the cannabis market
- To understand the competitive landscape and identify the major growth strategies adopted by players across the key regions
Available Customizations
With the given market data, MarketsandMarkets offers customizations according to company-specific scientific needs.
The following customization options are available for the report:
Service Analysis
- Service Matrix, which gives a detailed comparison of the service portfolio of each company.
Geographic Analysis as per Feasibility
With the given market data, MarketsandMarkets offers customizations according to company-specific scientific needs.
- Further breakdown of the Rest of Europe cannabis market into key countries.
- Further breakdown of the Rest of Asia Pacific cannabis market into key countries.
- Further breakdown of the Rest of South America cannabis market into key countries.
Company Information
- Detailed analyses and profiling of additional market players (up to five)
Key Questions Addressed by the Report
What is the current size of the cannabis market?
The cannabis market is estimated to be USD 72.82 billion in 2025 and is projected to reach USD 125.76 billion by 2030, registering a CAGR of 11.5% during the forecast period.
What are the key market players, and how intense is the competition?
Canopy Growth Corporation (Canada), Curaleaf (US), Cresco Labs (US), Green Thumb Industries (GTI) (US), and Tilray Brands (US) are some of the key market players. The cannabis market is expanding rapidly, with more mergers, acquisitions, and product launches. Companies in this sector are also heavily investing.
Which region is projected to account for the largest share of the cannabis market?
In North America, the cannabis market is experiencing stable growth, driven by expanding legalization, increasing medical applications, rising consumer acceptance, and continuous product innovation across recreational and therapeutic segments.
What kind of information is provided in the company profiles section?
The provided company profiles deliver crucial details, including a thorough business summary that covers different segments, financial results, geographic presence, revenue distribution, and business revenue breakdown. They also offer insights into product lines, key achievements, and expert analyst opinions to better illustrate the company's potential.
What are the factors driving the cannabis market?
The global cannabis market is driven by expanding legalization, growing medical and wellness applications, rising consumer awareness, and continuous advancements in product innovation and delivery formats.
Need a Tailored Report?
Customize this report to your needs
Get 10% FREE Customization
Customize This ReportPersonalize This Research
- Triangulate with your Own Data
- Get Data as per your Format and Definition
- Gain a Deeper Dive on a Specific Application, Geography, Customer or Competitor
- Any level of Personalization
Let Us Help You
- What are the Known and Unknown Adjacencies Impacting the Industrial Cannabis Market
- What will your New Revenue Sources be?
- Who will be your Top Customer; what will make them switch?
- Defend your Market Share or Win Competitors
- Get a Scorecard for Target Partners

Custom Market Research Services
We Will Customise The Research For You, In Case The Report Listed Above Does Not Meet With Your Requirements
Get 10% Free CustomisationTESTIMONIALS

Business Innovation Director
US Based Leading Agribusiness,
Food and Ingredients ManufacturerI highly appreciate the team's efficiency for a well conducted study that helped us clarify some blind spots in food and agricultural niche markets. Although compiling information for B2B markets is very difficult, the MnM team pulled out the task successfully. The quality of research, level of insights, and responsiveness of team were commendable.


Growth opportunities and latent adjacency in Industrial Cannabis Market