3D Printed Satellite Market

3D Printed Satellite Market by Component (Antenna, Bracket, Shield, Housing and Propulsion), Satellite Mass (Nano and microsatellite, small satellite, medium and large satellite), Application and Region - Global Forecast to 2030

Report Code: AS 8984 Apr, 2024, by marketsandmarkets.com

[186 Pages Report] 3D printing, also known as additive manufacturing (AM), is printing a three-dimensional solid object with the help of digital files and materials. Metals, ceramics, wax, powders, and filaments are commonly used in 3D printing. An object is created by placing successive layers of material until the object is created. Each layer can be seen as a thinly sliced cross-section of the object. 3D printing enables users to produce complex shapes using less material than traditional manufacturing methods.

The 3D Printed Satellite Market is projected to grow from USD 112 Million in 2024 to USD 487 Million by 2030, at a CAGR of 27.7% from 2024 to 2030. There are numerous factors, such as growing demand for lightweight and fuel-efficient satellites, miniaturization of satellite components, improved strength and durability of the components and parts used in satellites, flexible designing of components, and cost efficiency, which are driving the growth of the 3D Printed Satellite Industry. The increasing adoption of 3D printers in the North American and European regions is one of the major factors augmenting the demand for 3D printing satellites market.

Over the coming years, the 3D printing market for satellites is poised for significant advancements in printer technology, materials, and printing techniques. Innovations are underway to develop processes that reduce production time, catering specifically to the needs of the satellite industry for efficient manufacturing of satellite components. Advanced 3D printers are being engineered with cutting-edge technology to accelerate the adoption of 3D printing within the satellite manufacturing sector.

The stakeholders, such as satellite component 3D printer manufacturers and material suppliers in the 3D printed satellite market, focus on developing new and innovative technologies to meet the increasing demand for 3D printing in the space industry. The companies offering Satellite 3D printing are entering into partnerships to develop this technology and explore new materials that could be used for the 3D printing of satellite components with enhanced capabilities.

3D Printed Satellite Market

3D Printed Satellite Market

3D Printed Satellite Market Forecast to 2030

To know about the assumptions considered for the study, Request for Free Sample Report

3D Printed Satellite Market Dynamics:

Driver: Reduction In Manufacturing Cost and Process Downtime

The ability of 3D printing technology to reduce the time required to design and produce functional parts leads to the rapid production of prototypes without reconfiguring or retooling the manufacturing line. For low-to-medium volume applications, 3D printing eliminates the need for expensive tool production, resulting in reduced costs, lead times, and the associated labor.

The AM technology also enables users to design products and components with intricate geometry and complex features, which nullifies the need for relying on design specialists and any other associated costs. Also, any changes in the products being manufactured using traditional methods require large investments. In traditional manufacturing methods, the entire production line needs to be reconfigured and tailored if the manufacturing process is changed (due to outdated equipment or any other reasons), which calls for large investments in tooling and can potentially lead to prolonged factory downtime. However, while using a 3D printer, such changes can be easily implemented in the CAD file, and the new product can be immediately printed. Recently, GSK Precision Co., Ltd. (Taiwan) demonstrated reducing its prototyping costs by 5–10% and shortening its product development cycle by one month using the 3D printing technology.

Restraint: High Initial Cost

One of the significant restraints facing the 3D printed satellite market is the high initial cost associated with implementing additive manufacturing technologies for satellite production. While 3D printing offers numerous benefits such as customization, rapid prototyping, and complex geometries, the initial investment required for acquiring advanced 3D printing equipment, materials, and expertise can be substantial.

Satellite manufacturers and space agencies often operate within strict budget constraints, and the upfront cost of transitioning to 3D printing technologies may pose a barrier to adoption. Additionally, the cost of developing and optimizing 3D printing processes specific to satellite components, along with ensuring compliance with stringent quality and safety standards, further contributes to the initial financial burden. Furthermore, the high initial cost of 3D printing for satellites may deter smaller satellite manufacturers or startups with limited financial resources from entering the market, potentially limiting competition and innovation within the industry. 

Opportunity: Rapid Advancements In Printing Technologies

From its initial applications in designing and prototyping, 3D printing is shifting toward manufacturing functional parts. 3D printing can help overcome challenges (such as higher tooling costs) associated with traditional manufacturing processes employed for rapid prototyping and short production runs, among others, as 3D printing eliminates the tooling requirement, unlike traditional manufacturing processes. Although traditional manufacturing would cost less per unit produced, it poses a high initial cost in tooling, leading to more expensive, low-volume manufacturing. 3D printing technology also helps reduce the waste produced during manufacturing by building parts layer on layer. Mass customization is another area where 3D printing has an advantage over conventional manufacturing, particularly for short production runs.

It is still uncertain what parts will be printable using 3D printing, whose production might not be feasible with conventional manufacturing methods. Despite this uncertainty, 3D printing can upgrade the supply chain management that may affect the logistics link between manufacturers and customers in certain types of products or parts. The 3D printing market has also been experiencing advancements in printers and printing technologies, improvement in printing materials, and development in the skill set of the associated workforce.

Challenge: Ensuring Product Quality

3D printing provides highly customized designs and products, especially in the space industry. However, material requirements for AM of functional products are limited, which challenges its potential to develop highly customized products. The 3D printing industry has to ensure the quality of end products, particularly when repeatedly manufactured on the same printing machine or different machines. The quality of products, especially exactness and performance, depends on several factors, such as materials, printing technology, and particularly temperature and pressure. Any changes could affect the quality of the end product. However, technological advancements in the existing 3D printing technology and the introduction of new materials as per unique application needs [such as ONYX by Marforged (US) and WoodFill by ColorFabb (Netherlands)] are expected to overcome this challenge associated with product quality.

Ecosystem Map For The 3d Printed Satellite Market

Model Based Enterprise Market by Ecosystem

Based on Component, the Housing Segment is Projected to Grow at the Highest CAGR During the Forecast Period

Based on the components, the 3D Printed Satellite Market has been classified into antenna, bracket, shield, housing, and propulsion. The bracket segment is estimated to grow at the highest CAGR  during the forecast period. 3D printing allows combining multiple parts into a single, unified structure. This reduces complexity, assembly time, and potential points of failure within the satellite housing. Advancements in materials science and additive manufacturing techniques continue to expand the capabilities of the 3D-printed satellite housing segment, driving further adoption and market growth in this segment.

Based on Application, the Communication Segment Will Dominate the Market

Based on application, the 3D Printed Satellite Market has been segmented into technology development, communication, navigation, and Earth Observation & Remote Sensing. The communication segment will dominate the market during the forecast period. This is due to 3D-printed satellites are enabling advancements in wireless satellite internet and the development of miniature hardware systems, catering to the increasing demand for high-speed connectivity.

The North America Region Dominates the Market During the Forecast Period

North America is expected to lead the 3D printed satellite market during the forecast period from  2024 and 2030. The region is estimated to account for the largest share of the 3D-printed satellite market in 2024. The United States dominates the 3D-printed satellite market, capitalizing on its expertise in space exploration and advanced printing technology. Leading companies like Maxar Space systems and Northrop Grumman Corporation use 3D printing for intricate satellite components, focusing on speed, lightweight designs, and cost savings. Ongoing research aims to improve materials for space conditions. The US's strong position in satellite constellations drives affordability and efficiency with 3D printing. Robust growth, supported by government backing, private investment, and the nation's leadership will help in this transformative field.

3D Printed Satellite Market by Region

3D Printed Satellite Market by Region

To know about the assumptions considered for the study, download the pdf brochure

3D Printed Satellite Industry Companies: Top
Key Market Players

The major players in the 3D Printed Satellite Companies are Maxar Space Systems (US), Boeing (US), 3D Systems (US), Northrop Grumman Corporation (US), and Fleet Space Technologies Pty Ltd (Australia). These players have adopted various growth strategies to expand their presence in the 3D printed satellite market.

Get online access to the report on the World's First Market Intelligence Cloud

  • Easy to Download Historical Data & Forecast Numbers
  • Company Analysis Dashboard for high growth potential opportunities
  • Research Analyst Access for customization & queries
  • Competitor Analysis with Interactive dashboard
  • Latest News, Updates & Trend analysis
Request Sample

Scope of the Report

Report Metric

Details

Estimated Market Size

USD 112 Million in 2024

Projected Market Size

USD 487 Million by 2030

Growth Rate

27.7%

Forecast Period

2024 to 2030

Market Size Available for Years

2021–2030

Base Year Considered

2023

Forecast Period

2024-2030

Forecast Units

Value (USD)

Segments Covered

Satellite Mass, Application, Components, Manufacturing technique

Geographies Covered

North America, Asia Pacific, Europe, and Rest of the World

Companies Covered

Maxar Space Systems (US), Boeing (US), 3D Systems (US), Northrop Grumman Corporation (US), and Fleet Space Technologies Pty Ltd (Australia)

3D Printed Satellite Market Highlights

This Research Report Categorizes the 3d Printed Satellite Market Based on Systems, Platform, Type, and Region.

Segment

Subsegment

By Component

  • Antenna
  • Bracket
  • Shield
  • Housing
  • Propulsion

By Application

  • Technology development
  • Communication
  • Navigation
  • Earth Observation & Remote Sensing

By Satellite Mass

  • Nano and microsatellites
  • Small satellites
  • Medium and Large Satellites

By Manufacturing Technique

  • Fused Deposition Modelling (FDM)
  • Selective Laser Sintering (SLS)
  • Electron Beam Melting (EBM)
  • Direct Metal Laser Sintering (DMLS)
  • Others

By Region

  • North America
  •  Europe
  • Asia Pacific
  • Rest of the World

Recent Developments

  • In March 2024, Boeing received a USD 439.6 million contract to build the 12th Wideband Global SATCOM (WGS) communications satellite for U.S. Space Force's Space Systems Command. The WGS constellation delivers vital high-capacity, secure, and resilient communications capabilities to the U.S. military and its allies
  • In November 2023, SWISSto12 announced it is developing Active Electronically Steerable Antennas (AESAs) for airborne, land and maritime platforms in collaboration with Thales Group (France). SWISSto12’s AESAs used innovative 3D-printed miniature horn antennas instead of traditional patch antennas. SWISSto12’s 3D printed antennas were mounted on planar beamformers provided by Thales.
  • In September 2023, SWISSto12 has received USD 28.06 million (CHF 25 million) working capital facility from UBS Switzerland AG, the multinational universal bank. The facility will provide SWISSto12 with flexible growth capital to meet strong customer demand for its geostationary SmallSat HummingSat.
  • In October 2023, Maxar Space Systems (US) chose Zenith Tecnica to manufacture and deliver node components that are vital in the structure of the Solar Electric Propulsion (SEP) Chassis.
  • In May 2023, Fleet Space Technologies received funding of A$50 million (USD 33.1 Million) after the successful completion of its Series C fundraising round. The funding was led by Australasian venture capital firm and existing investor Blackbird. Grok Ventures, Alumni Ventures and Hostplus were also a part in the round.
  • In March 2023, Swissto12 announced the incorporation of St12 RF Solutions, Inc. The new entity has business offices in Manchester, NH and will focus on engaging government and industry partners in the United States to commercialize advanced RF solutions.
  • In February 2023, Lockheed Martin launched a 3D-printed omnidirectional antenna for communication relay. The new antenna contains unique geometric features that can only be fabricated using additive manufacturing. Those features specifically contribute to defect reduction associated with the plating and soldering operations of the antenna’s predecessor. The antenna has been integrated into a GPS III satellite.

Frequently Asked Questions(FAQs):

To speak to our analyst for a discussion on the above findings, click Speak to Analyst

TABLE OF CONTENTS
 
1 INTRODUCTION (Page No. - 18)
    1.1 STUDY OBJECTIVES 
    1.2 MARKET DEFINITION 
           1.2.1 INCLUSIONS AND EXCLUSIONS
                    TABLE 1 INCLUSIONS AND EXCLUSIONS
    1.3 STUDY SCOPE 
           1.3.1 MARKETS COVERED
                    FIGURE 1 3D PRINTED SATELLITE MARKET SEGMENTATION
           1.3.2 REGIONS COVERED
           1.3.3 YEARS CONSIDERED
    1.4 CURRENCY CONSIDERED 
           TABLE 2 USD EXCHANGE RATES
    1.5 STAKEHOLDERS 
    1.6 RECESSION IMPACT 
 
2 RESEARCH METHODOLOGY (Page No. - 23)
    2.1 RESEARCH DATA 
           FIGURE 2 RESEARCH PROCESS FLOW
           FIGURE 3 RESEARCH DESIGN
           2.1.1 SECONDARY DATA
                    2.1.1.1 Key data from secondary sources
           2.1.2 PRIMARY DATA
                    2.1.2.1 Primary respondents
                    2.1.2.2 Key data from primary sources
                    2.1.2.3 Insights from industry experts
    2.2 FACTOR ANALYSIS 
           2.2.1 INTRODUCTION
           2.2.2 DEMAND-SIDE INDICATORS
           2.2.3 SUPPLY-SIDE INDICATORS
           2.2.4 RECESSION IMPACT ANALYSIS
    2.3 MARKET SIZE ESTIMATION 
           2.3.1 BOTTOM-UP APPROACH
                    2.3.1.1 Market size estimation methodology (demand-side)
                               FIGURE 4 BOTTOM-UP APPROACH
           2.3.2 TOP-DOWN APPROACH
                    FIGURE 5 TOP-DOWN APPROACH
    2.4 DATA TRIANGULATION 
           FIGURE 6 DATA TRIANGULATION
    2.5 RESEARCH ASSUMPTIONS 
    2.6 RESEARCH LIMITATIONS 
    2.7 RISK ASSESSMENT 
 
3 EXECUTIVE SUMMARY (Page No. - 34)
    FIGURE 7 SMALL SATELLITES TO BE FASTEST-GROWING SEGMENT DURING FORECAST MARKET
    FIGURE 8 BRACKET SEGMENT TO EXHIBIT HIGHEST GROWTH DURING FORECAST PERIOD
    FIGURE 9 COMMUNICATION TO BE LARGEST SEGMENT DURING FORECAST PERIOD
    FIGURE 10 NORTH AMERICA TO HOLD LARGEST MARKET SHARE IN 2024
 
4 PREMIUM INSIGHTS (Page No. - 37)
    4.1 ATTRACTIVE OPPORTUNITIES FOR PLAYERS IN 3D PRINTED SATELLITE MARKET 
           FIGURE 11 INCREASED GOVERNMENT INVESTMENTS IN 3D PRINTING TECHNOLOGY TO DRIVE MARKET
    4.2 3D PRINTED SATELLITE MARKET, BY SATELLITE MASS 
           FIGURE 12 SMALL SATELLITES TO RECORD HIGHEST CAGR DURING FORECAST PERIOD
    4.3 3D PRINTED SATELLITE MARKET, BY COMPONENT 
           FIGURE 13 HOUSING TO SURPASS OTHER SEGMENTS DURING FORECAST PERIOD
    4.4 3D PRINTED SATELLITE MARKET, BY APPLICATION 
           FIGURE 14 COMMUNICATION SEGMENT TO SECURE LEADING MARKET POSITION DURING FORECAST PERIOD
 
5 MARKET OVERVIEW (Page No. - 39)
    5.1 INTRODUCTION 
    5.2 MARKET DYNAMICS 
           FIGURE 15 3D PRINTED SATELLITE MARKET DYNAMICS
           5.2.1 DRIVERS
                    5.2.1.1 Need for customized functional parts in satellite manufacturing
                    5.2.1.2 Cost efficiencies in satellite production
                    5.2.1.3 Increasing demand for lightweight components from space industry
                               FIGURE 16 MAXAR’S 3D PRINTED SATELLITE COMPONENTS IN ORBIT, 2016–2019
                    5.2.1.4 Government investments in 3D printing projects
                               TABLE 3 GOVERNMENT FUNDING FOR 3D PRINTING PROJECTS
                    5.2.1.5 Short supply chain of space components
                               FIGURE 17 SUPPLY CHAIN FLOW OF SPACE COMPONENTS
           5.2.2 RESTRAINTS
                    5.2.2.1 High cost of 3D printing equipment
                    5.2.2.2 Stringent industry certifications and lack of process control
           5.2.3 OPPORTUNITIES
                    5.2.3.1 Development of new 3D printing technologies requiring less production time
                               FIGURE 18 CLIP VS. OTHER 3D PRINTING TECHNOLOGIES
                    5.2.3.2 Advancements in printing technologies
           5.2.4 CHALLENGES
                    5.2.4.1 Product quality compliance
                    5.2.4.2 Limited availability and high costs of raw materials
    5.3 TRENDS AND DISRUPTIONS IMPACTING CUSTOMERS’ BUSINESSES 
           FIGURE 19 TRENDS AND DISRUPTIONS IMPACTING CUSTOMERS’ BUSINESSES
    5.4 VALUE CHAIN ANALYSIS 
           FIGURE 20 VALUE CHAIN ANALYSIS
           5.4.1 RESEARCH AND DEVELOPMENT
           5.4.2 RAW MATERIALS
           5.4.3 COMPONENT/PRODUCT MANUFACTURERS (OEMS)
           5.4.4 INTEGRATORS AND SYSTEM PROVIDERS
           5.4.5 END USERS
    5.5 PRICING ANALYSIS 
           5.5.1 AVERAGE SELLING PRICE OF 3D PRINTED SATELLITES, BY KEY PLAYER
                    FIGURE 21 AVERAGE SELLING PRICE OF 3D PRINTED SATELLITES, BY KEY PLAYER
                    TABLE 4 AVERAGE SELLING PRICE OF 3D PRINTED SATELLITES, BY KEY PLAYER (USD MILLION)
           5.5.2 AVERAGE SELLING PRICE OF 3D PRINTED SATELLITES, BY SATELLITE MASS
                    TABLE 5 AVERAGE SELLING PRICE OF 3D PRINTED SATELLITES, BY SATELLITE MASS (USD MILLION)
           5.5.3 INDICATIVE PRICING ANALYSIS, BY REGION
                    TABLE 6 INDICATIVE PRICING ANALYSIS, BY REGION
    5.6 OPERATIONAL DATA 
           TABLE 7 OPERATIONAL DATA FOR 3D PRINTED SATELLITE COMPONENTS, BY SATELLITE MASS, 2021–2023
           TABLE 8 OPERATIONAL DATA FOR 3D PRINTED SATELLITE COMPONENTS, BY REGION, 2021–2023
    5.7 VOLUME DATA 
           TABLE 9 VOLUME DATA FOR 3D PRINTED SATELLITE COMPONENTS, BY REGION, 2021–2030
    5.8 ECOSYSTEM MAP 
           5.8.1 PROMINENT COMPANIES
           5.8.2 PRIVATE AND SMALL ENTERPRISES
           5.8.3 END USERS
                    FIGURE 22 ECOSYSTEM MAP
                    TABLE 10 ROLE OF COMPANIES IN ECOSYSTEM
    5.9 USE CASE ANALYSIS 
           5.9.1 REDESIGN OF TITANIUM INSERTS WITH ADDITIVE MANUFACTURING
           5.9.2 3D PRINTING IN SATELLITE MOUNTING STRUCTURES
           5.9.3 ENGINE OPTIMIZATION WITH 3D PRINTING
           5.9.4 ENGINE BLADE REPAIR WITH LASER METAL DEPOSITION
           5.9.5 3D PRINTING IN FLUID SYSTEMS
    5.10 TECHNOLOGY ANALYSIS 
           5.10.1 INNOVATIVE 3D PRINTING TECHNOLOGIES
                    TABLE 11 INNOVATIVE 3D PRINTED TECHNOLOGIES
           5.10.2 4D PRINTING
                    FIGURE 23 4D PRINTING
           5.10.3 ARTIFICIAL INTELLIGENCE
    5.11 TECHNOLOGY ROADMAP OF 3D PRINTED SATELLITE MARKET 
           FIGURE 24 INTRODUCTION TO TECHNOLOGY ROADMAP
           FIGURE 25 EVOLUTION OF 3D PRINTED SATELLITE TECHNOLOGY, 2020–2030
           FIGURE 26 TECHNOLOGY TRENDS RELATED TO 3D PRINTED SATELLITES
    5.12 REGULATORY LANDSCAPE 
           TABLE 12 NORTH AMERICA: REGULATORY BODIES, GOVERNMENT AGENCIES, AND OTHER ORGANIZATIONS
           TABLE 13 EUROPE: REGULATORY BODIES, GOVERNMENT AGENCIES, AND OTHER ORGANIZATIONS
           TABLE 14 ASIA PACIFIC: REGULATORY BODIES, GOVERNMENT AGENCIES, AND OTHER ORGANIZATIONS
    5.13 TRADE DATA ANALYSIS 
           5.13.1 IMPORT VALUE OF SPACECRAFT, INCLUDING SATELLITES AND SUBORBITAL & SPACECRAFT LAUNCH VEHICLES (HS CODE: 880260)
                    FIGURE 27 IMPORT DATA, BY COUNTRY, 2018–2022 (USD THOUSAND)
                    TABLE 15 IMPORT DATA, BY COUNTRY, 2018–2022 (USD THOUSAND)
           5.13.2 EXPORT VALUE OF SPACECRAFT, INCLUDING SATELLITES AND SUBORBITAL & SPACECRAFT LAUNCH VEHICLES (HS CODE: 880260)
                    FIGURE 28 EXPORT DATA, BY COUNTRY, 2018–2022 (USD THOUSAND)
                    TABLE 16 EXPORT DATA, BY COUNTRY, 2018–2022 (USD THOUSAND)
    5.14 KEY CONFERENCES AND EVENTS, 2024–2025 
           TABLE 17 KEY CONFERENCES AND EVENTS, 2024–2025
    5.15 KEY STAKEHOLDERS AND BUYING CRITERIA 
           5.15.1 KEY STAKEHOLDERS IN BUYING PROCESS
                    FIGURE 29 INFLUENCE OF STAKEHOLDERS ON BUYING PROCESS OF 3D PRINTED SATELLITES, BY SATELLITE MASS
                    TABLE 18 INFLUENCE OF STAKEHOLDERS ON BUYING PROCESS OF 3D PRINTED SATELLITES, BY SATELLITE MASS (%)
           5.15.2 BUYING CRITERIA
                    FIGURE 30 KEY BUYING CRITERIA FOR 3D PRINTED SATELLITES, BY SATELLITE MASS
                    TABLE 19 KEY BUYING CRITERIA FOR 3D PRINTED SATELLITES, BY SATELLITE MASS
    5.16 BUSINESS MODELS OF SATELLITE MANUFACTURING 
           FIGURE 31 BUSINESS MODELS OF SATELLITE MANUFACTURING
           5.16.1 BUILD-TO-ORDER
           5.16.2 STANDARDIZED PLATFORM
           5.16.3 CONSTELLATION MANUFACTURING
    5.17 TOTAL COST OF OWNERSHIP 
           TABLE 20 TOTAL COST OF OWNERSHIP
    5.18 BENEFITS OF 3D PRINTING OVER CONVENTIONAL PRINTING METHODS 
           TABLE 21 3D PRINTING VS. CONVENTIONAL PRINTING
           TABLE 22 ATTRIBUTE COMPARISON BETWEEN 3D PRINTING AND CONVENTION PRINTING
    5.19 3D PRINTED SATELLITE OUTSOURCING 
           FIGURE 32 MAKERSPACES AND OUTSOURCED SERVICES IN 3D PRINTED SATELLITE MANUFACTURING
    5.2 INVESTMENT AND FUNDING SCENARIO 
           FIGURE 33 INVESTMENT IN START-UP SPACE COMPANIES, BY INVESTOR TYPE, 2022
           FIGURE 34 VENTURE CAPITAL FUNDING, 2017–2022
           FIGURE 35 VENTURE CAPITAL FUNDING FOR TOP 10 COUNTRIES, 2022
 
6 INDUSTRY TRENDS (Page No. - 73)
    6.1 INTRODUCTION 
    6.2 TECHNOLOGY TRENDS 
           FIGURE 36 TECHNOLOGY TRENDS
           6.2.1 MINIATURIZATION OF SATELLITES
           6.2.2 ADVANCED MATERIALS
           6.2.3 INTEGRATION OF ELECTRONICS
           6.2.4 HYBRID MANUFACTURING
           6.2.5 LARGE-SCALE SPACE 3D PRINTING
    6.3 IMPACT OF MEGATRENDS 
           6.3.1 GLOBAL CONNECTIVITY AND COMMUNICATION
           6.3.2 SPACE EXPLORATION AND COMMERCIALIZATION
           6.3.3 SUSTAINABILITY
    6.4 SUPPLY CHAIN ANALYSIS 
           FIGURE 37 SUPPLY CHAIN ANALYSIS
    6.5 PATENT ANALYSIS 
           FIGURE 38 PATENT ANALYSIS
           TABLE 23 PATENT ANALYSIS
 
7 3D PRINTED SATELLITE MARKET, BY MANUFACTURING TECHNIQUE (Page No. - 83)
    7.1 INTRODUCTION 
    7.2 FUSED DEPOSITION MODELING (FDM) 
    7.3 SELECTIVE LASER SINTERING (SLS) 
    7.4 ELECTRON BEAM MELTING (EBM) 
    7.5 DIRECT METAL LASER SINTERING (DMLS) 
    7.6 OTHER TECHNIQUES 
 
8 3D PRINTED SATELLITE MARKET, BY SATELLITE MASS (Page No. - 85)
    8.1 INTRODUCTION 
           FIGURE 39 3D PRINTED SATELLITE MARKET, BY SATELLITE MASS, 2024–2030
           TABLE 24 3D PRINTED SATELLITE MARKET, BY SATELLITE MASS, 2021–2023 (USD MILLION)
           TABLE 25 3D PRINTED SATELLITE MARKET, BY SATELLITE MASS, 2024–2030 (USD MILLION)
    8.2 NANO & MICRO SATELLITES 
           8.2.1 WIDE SCOPE IN TACTICAL COMMUNICATION DEVICES TO DRIVE MARKET
    8.3 SMALL SATELLITES 
           8.3.1 DEPLOYMENT IN CONSTELLATION ARCHITECTURE TO GATHER SCIENTIFIC DATA TO DRIVE MARKET
    8.4 MEDIUM & LARGE SATELLITES 
           8.4.1 COST ADVANTAGES ASSOCIATED WITH LIGHTWEIGHT STRUCTURES TO DRIVE MARKET
 
9 3D PRINTED SATELLITE MARKET, BY COMPONENT (Page No. - 89)
    9.1 INTRODUCTION 
           FIGURE 40 3D PRINTED SATELLITE MARKET, BY COMPONENT, 2024–2030
           TABLE 26 3D PRINTED SATELLITE MARKET, BY COMPONENT, 2021–2023 (USD MILLION)
           TABLE 27 3D PRINTED SATELLITE MARKET, BY COMPONENT, 2024–2030 (USD MILLION)
    9.2 ANTENNA 
           9.2.1 INNOVATIONS IN ANTENNA DESIGN TO DRIVE MARKET
    9.3 BRACKET 
           9.3.1 EXCELLENT STRUCTURAL INTEGRITY TO DRIVE MARKET
    9.4 SHIELD 
           9.4.1 PROTECTION AGAINST RADIATION-INDUCED DAMAGE TO DRIVE MARKET
    9.5 HOUSING 
           9.5.1 OPTIMIZED SATELLITE PERFORMANCE TO DRIVE MARKET
    9.6 PROPULSION 
           9.6.1 EFFICIENT COMBUSTION AND HEAT TRANSFER TO DRIVE MARKET
 
10 3D PRINTED SATELLITE MARKET, BY APPLICATION (Page No. - 94)
     10.1 INTRODUCTION 
             FIGURE 41 3D PRINTED SATELLITE MARKET, BY APPLICATION, 2024–2030
             TABLE 28 3D PRINTED SATELLITE MARKET, BY APPLICATION, 2021–2023 (USD MILLION)
             TABLE 29 3D PRINTED SATELLITE MARKET, BY APPLICATION, 2024–2030 (USD MILLION)
     10.2 TECHNOLOGY DEVELOPMENT 
             10.2.1 RAPID ITERATION AND PROTOTYPING OF SATELLITE COMPONENTS TO DRIVE MARKET
     10.3 COMMUNICATION 
             10.3.1 RISING ADOPTION OF LEO SATELLITES IN MODERN COMMUNICATION TO DRIVE MARKET
     10.4 NAVIGATION 
             10.4.1 IMPROVED ACCURACY AND PERFORMANCE TO DRIVE MARKET
     10.5 EARTH OBSERVATION & REMOTE SENSING 
             10.5.1 EASE OF DESIGNING COMPLEX COMPONENTS TO DRIVE MARKET
 
11 3D PRINTED SATELLITE MARKET, BY REGION (Page No. - 98)
     11.1 INTRODUCTION 
             FIGURE 42 3D PRINTED SATELLITE MARKET, BY REGION, 2024–2030
             TABLE 30 3D PRINTED SATELLITE MARKET, BY REGION, 2021–2023 (USD MILLION)
             TABLE 31 3D PRINTED SATELLITE MARKET, BY REGION, 2024–2030 (USD MILLION)
     11.2 REGIONAL RECESSION IMPACT ANALYSIS 
     11.3 NORTH AMERICA 
             11.3.1 PESTLE ANALYSIS
             11.3.2 RECESSION IMPACT ANALYSIS
             11.3.3 3D PRINTED SATELLITE PROGRAMS
                        FIGURE 43 NORTH AMERICA: 3D PRINTED SATELLITE PROGRAMS
             11.3.4 US
                        11.3.4.1 Expertise in space exploration and advanced printing technology to drive market
             11.3.5 CANADA
                        11.3.5.1 Collaborative initiatives and ambitious space agendas to drive market
     11.4 EUROPE 
             11.4.1 PESTLE ANALYSIS
             11.4.2 RECESSION IMPACT ANALYSIS
             11.4.3 3D PRINTED SATELLITE PROGRAMS
                        FIGURE 44 EUROPE: 3D PRINTED SATELLITE PROGRAMS
             11.4.4 UK
                        11.4.4.1 Rising adoption of 3D printing technology by prominent players to drive market
             11.4.5 FRANCE
                        11.4.5.1 Increasing satellite launches with 3D printed components to drive market
             11.4.6 ITALY
                        11.4.6.1 Focus on developing specialized 3D printing materials to drive market
             11.4.7 SPAIN
                        11.4.7.1 Strategic collaborations between domestic research institutions and private firms to drive market
             11.4.8 REST OF EUROPE
     11.5 ASIA PACIFIC 
             11.5.1 PESTLE ANALYSIS
             11.5.2 RECESSION IMPACT ANALYSIS
             11.5.3 3D PRINTED SATELLITE PROGRAMS
                        FIGURE 45 ASIA PACIFIC: 3D PRINTED SATELLITE PROGRAMS
             11.5.4 CHINA
                        11.5.4.1 Escalating demand for reduced production costs to drive market
             11.5.5 JAPAN
                        11.5.5.1 Shift toward smaller satellite constellations to drive market
             11.5.6 INDIA
                        11.5.6.1 Rapid integration of 3D printing technology in space missions to drive market
             11.5.7 AUSTRALIA
                        11.5.7.1 Government investments in space technologies to drive market
             11.5.8 REST OF ASIA PACIFIC
     11.6 REST OF THE WORLD 
             11.6.1 PESTLE ANALYSIS
             11.6.2 RECESSION IMPACT ANALYSIS
             11.6.3 3D PRINTED SATELLITE PROGRAMS
                        FIGURE 46 REST OF THE WORLD: 3D PRINTED SATELLITE PROGRAMS
             11.6.4 MIDDLE EAST & AFRICA
                        11.6.4.1 Booming IT industry to drive market
             11.6.5 LATIN AMERICA
                        11.6.5.1 Ongoing collaborations and technological advancements to drive market
 
12 COMPETITIVE LANDSCAPE (Page No. - 115)
     12.1 INTRODUCTION 
     12.2 STRATEGIES ADOPTED BY KEY PLAYERS 
             TABLE 32 STRATEGIES ADOPTED BY KEY PLAYERS
     12.3 MARKET RANKING ANALYSIS, 2023 
             FIGURE 47 MARKET RANKING OF KEY PLAYERS, 2023
     12.4 REVENUE ANALYSIS, 2020–2023 
             FIGURE 48 REVENUE ANALYSIS OF KEY PLAYERS, 2020–2023
     12.5 MARKET SHARE ANALYSIS, 2023 
             FIGURE 49 MARKET SHARE ANALYSIS OF KEY PLAYERS, 2023
             TABLE 33 DEGREE OF COMPETITION
     12.6 COMPANY EVALUATION MATRIX: KEY PLAYERS, 2023 
             12.6.1 STARS
             12.6.2 EMERGING LEADERS
             12.6.3 PERVASIVE PLAYERS
             12.6.4 PARTICIPANTS
                        FIGURE 50 COMPANY EVALUATION MATRIX (KEY PLAYERS), 2023
             12.6.5 COMPANY FOOTPRINT
                        FIGURE 51 COMPANY FOOTPRINT, 2023
                        TABLE 34 APPLICATION FOOTPRINT, 2023
                        TABLE 35 COMPONENT FOOTPRINT, 2023
                        TABLE 36 REGION FOOTPRINT, 2023
     12.7 COMPANY EVALUATION MATRIX: START-UPS/SMES, 2023 
             12.7.1 PROGRESSIVE COMPANIES
             12.7.2 RESPONSIVE COMPANIES
             12.7.3 DYNAMIC COMPANIES
             12.7.4 STARTING BLOCKS
                        FIGURE 52 COMPANY EVALUATION MATRIX (START-UPS/SMES), 2023
             12.7.5 COMPETITIVE BENCHMARKING
                        TABLE 37 KEY START-UPS/SMES
                        TABLE 38 COMPETITIVE BENCHMARKING OF KEY START-UPS/SMES
     12.8 COMPANY VALUATION AND FINANCIAL METRICS 
             FIGURE 53 COMPANY VALUATION OF KEY PLAYERS
             FIGURE 54 EV/EBITDA OF KEY PLAYERS
             FIGURE 55 COMPANY VALUATION OF START-UPS/SMES
             FIGURE 56 EV/EBITDA OF START-UPS/SMES
     12.9 BRAND/PRODUCT COMPARISON 
           FIGURE 57 BRAND/PRODUCT COMPARISON
     12.10 COMPETITIVE SCENARIO 
             12.10.1 MARKET EVALUATION FRAMEWORK
             12.10.2 PRODUCT LAUNCHES
                        TABLE 39 3D PRINTED SATELLITE MARKET: PRODUCT LAUNCHES, 2020–2024
             12.10.3 DEALS
                        TABLE 40 3D PRINTED SATELLITE MARKET: DEALS, 2020–2024
             12.10.4 OTHERS
                        TABLE 41 3D PRINTED SATELLITE MARKET: OTHERS, 2020–2024
 
13 COMPANY PROFILES (Page No. - 135)
     13.1 KEY PLAYERS 
(Business Overview, Products/Solutions/Services offered, Recent Developments, MnM View)*  
             13.1.1 MAXAR SPACE SYSTEMS
                        TABLE 42 MAXAR SPACE SYSTEMS: COMPANY OVERVIEW
                        FIGURE 58 MAXAR SPACE SYSTEMS: COMPANY SNAPSHOT
                        TABLE 43 MAXAR SPACE SYSTEMS: PRODUCTS/SOLUTIONS/SERVICES OFFERED
                        TABLE 44 MAXAR SPACE SYSTEMS: DEALS
             13.1.2 NORTHROP GRUMMAN
                        TABLE 45 NORTHROP GRUMMAN: COMPANY OVERVIEW
                        FIGURE 59 NORTHROP GRUMMAN: COMPANY SNAPSHOT
                        TABLE 46 NORTHROP GRUMMAN: PRODUCTS/SOLUTIONS/SERVICES OFFERED
             13.1.3 FLEET SPACE TECHNOLOGIES PTY LTD
                        TABLE 47 FLEET SPACE TECHNOLOGIES PTY LTD: COMPANY OVERVIEW
                        TABLE 48 FLEET SPACE TECHNOLOGIES PTY LTD: PRODUCTS/SOLUTIONS/SERVICES OFFERED
                        TABLE 49 FLEET SPACE TECHNOLOGIES PTY LTD: DEALS
             13.1.4 3D SYSTEMS, INC.
                        TABLE 50 3D SYSTEMS, INC.: COMPANY OVERVIEW
                        FIGURE 60 3D SYSTEMS, INC.: COMPANY SNAPSHOT
                        TABLE 51 3D SYSTEMS, INC.: PRODUCTS/SOLUTIONS/SERVICES OFFERED
                        TABLE 52 3D SYSTEMS, INC.: DEALS
             13.1.5 BOEING
                        TABLE 53 BOEING: COMPANY OVERVIEW
                        FIGURE 61 BOEING: COMPANY SNAPSHOT
                        TABLE 54 BOEING: PRODUCTS/SOLUTIONS/SERVICES OFFERED
                        TABLE 55 BOEING: OTHERS
             13.1.6 THALES ALENIA SPACE
                        TABLE 56 THALES ALENIA SPACE: COMPANY OVERVIEW
                        FIGURE 62 THALES ALENIA SPACE: COMPANY SNAPSHOT
                        TABLE 57 THALES ALENIA SPACE: PRODUCTS/SOLUTIONS/SERVICES OFFERED
                        TABLE 58 THALES ALENIA SPACE: PRODUCT LAUNCHES
             13.1.7 LOCKHEED MARTIN CORPORATION
                        TABLE 59 LOCKHEED MARTIN CORPORATION: COMPANY OVERVIEW
                        FIGURE 63 LOCKHEED MARTIN CORPORATION: COMPANY SNAPSHOT
                        TABLE 60 LOCKHEED MARTIN CORPORATION: PRODUCTS/SOLUTIONS/SERVICES OFFERED
                        TABLE 61 LOCKHEED MARTIN CORPORATION: PRODUCT LAUNCHES
             13.1.8 MITSUBISHI ELECTRIC CORPORATION
                        TABLE 62 MITSUBISHI ELECTRIC CORPORATION: COMPANY OVERVIEW
                        FIGURE 64 MITSUBISHI ELECTRIC CORPORATION: COMPANY SNAPSHOT
                        TABLE 63 MITSUBISHI ELECTRIC CORPORATION: PRODUCTS/SOLUTIONS/SERVICES OFFERED
                        TABLE 64 MITSUBISHI ELECTRIC CORPORATION: PRODUCT LAUNCHES
             13.1.9 CRP TECHNOLOGY S.R.L
                        TABLE 65 CRP TECHNOLOGY S.R.L: COMPANY OVERVIEW
                        TABLE 66 CRP TECHNOLOGY S.R.L: PRODUCTS/SOLUTIONS/SERVICES OFFERED
                        TABLE 67 CRP TECHNOLOGY S.R.L: PRODUCT LAUNCHES
             13.1.10 SWISSTO12
                        TABLE 68 SWISSTO12: COMPANY OVERVIEW
                        TABLE 69 SWISSTO12: PRODUCTS/SOLUTIONS/SERVICES OFFERED
                        TABLE 70 SWISSTO12: DEALS
                        TABLE 71 SWISSTO12: OTHERS
             13.1.11 REDWIRE CORPORATION
                        TABLE 72 REDWIRE CORPORATION: COMPANY OVERVIEW
                        FIGURE 65 REDWIRE CORPORATION: COMPANY SNAPSHOT
                        TABLE 73 REDWIRE CORPORATION: PRODUCTS/SOLUTIONS/SERVICES OFFERED
             13.1.12 RUAG GROUP
                        TABLE 74 RUAG GROUP: COMPANY OVERVIEW
                        FIGURE 66 RUAG GROUP: COMPANY SNAPSHOT
                        TABLE 75 RUAG GROUP: PRODUCTS/SOLUTIONS/SERVICES OFFERED
                        TABLE 76 RUAG GROUP: OTHERS
             13.1.13 MOOG INC.
                        TABLE 77 MOOG INC.: COMPANY OVERVIEW
                        FIGURE 67 MOOG INC.: COMPANY SNAPSHOT
                        TABLE 78 MOOG INC.: PRODUCTS/SOLUTIONS/SERVICES OFFERED
             13.1.14 RENISHAW PLC
                        TABLE 79 RENISHAW PLC: COMPANY OVERVIEW
                        FIGURE 68 RENISHAW PLC: COMPANY SNAPSHOT
                        TABLE 80 RENISHAW PLC: PRODUCTS/SOLUTIONS/SERVICES OFFERED
             13.1.15 ZENITH TECNICA
                        TABLE 81 ZENITH TECNICA: COMPANY OVERVIEW
                        TABLE 82 ZENITH TECNICA: PRODUCTS/SOLUTIONS/SERVICES OFFERED
                        TABLE 83 ZENITH TECNICA: OTHERS
     13.2 OTHER PLAYERS 
             13.2.1 OC OERLIKON MANAGEMENT AG
                        TABLE 84 OC OERLIKON MANAGEMENT AG: COMPANY OVERVIEW
             13.2.2 STRATASYS
                        TABLE 85 STRATASYS: COMPANY OVERVIEW
             13.2.3 SIDUS SPACE
                        TABLE 86 SIDUS SPACE: COMPANY OVERVIEW
             13.2.4 EXONE
                        TABLE 87 EXONE: COMPANY OVERVIEW
             13.2.5 HEXCEL CORPORATION
                        TABLE 88 HEXCEL CORPORATION: COMPANY OVERVIEW
             13.2.6 NANO DIMENSION
                        TABLE 89 NANO DIMENSION: COMPANY OVERVIEW
             13.2.7 OPTOMEC INC
                        TABLE 90 OPTOMEC INC: COMPANY OVERVIEW
             13.2.8 OPTISYS INC
                        TABLE 91 OPTISYS INC: COMPANY OVERVIEW
             13.2.9 TRUMPF
                        TABLE 92 TRUMPF: COMPANY OVERVIEW
             13.2.10 ANYWAVES
                        TABLE 93 ANYWAVES: COMPANY OVERVIEW
             13.2.11 DAWN AEROSPACE
                        TABLE 94 DAWN AEROSPACE: COMPANY OVERVIEW
*Details on Business Overview, Products/Solutions/Services offered, Recent Developments, MnM View might not be captured in case of unlisted companies.  
 
14 APPENDIX (Page No. - 181)
     14.1 DISCUSSION GUIDE 
     14.2 KNOWLEDGESTORE: MARKETSANDMARKETS’ SUBSCRIPTION PORTAL 
     14.3 CUSTOMIZATION OPTIONS 
     14.4 RELATED REPORTS 
     14.5 AUTHOR DETAILS 
 

This research study on the 3D printed satellite market involved the extensive use of secondary sources, directories, and databases, such as D&B Hoovers, Bloomberg BusinessWeek, and Factiva, to identify and collect information relevant to the market. Primary sources considered included industry experts, as well as component manufacturers, system providers, technology developers, alliances, and organizations related to all segments of the value chain of the 3D printed satellite market. In-depth interviews with various primary respondents, including key industry participants, subject-matter experts, industry consultants, and C-level executives, were conducted to obtain and verify critical qualitative and quantitative information pertaining to the market, as well as assess its growth prospects.

Secondary Research

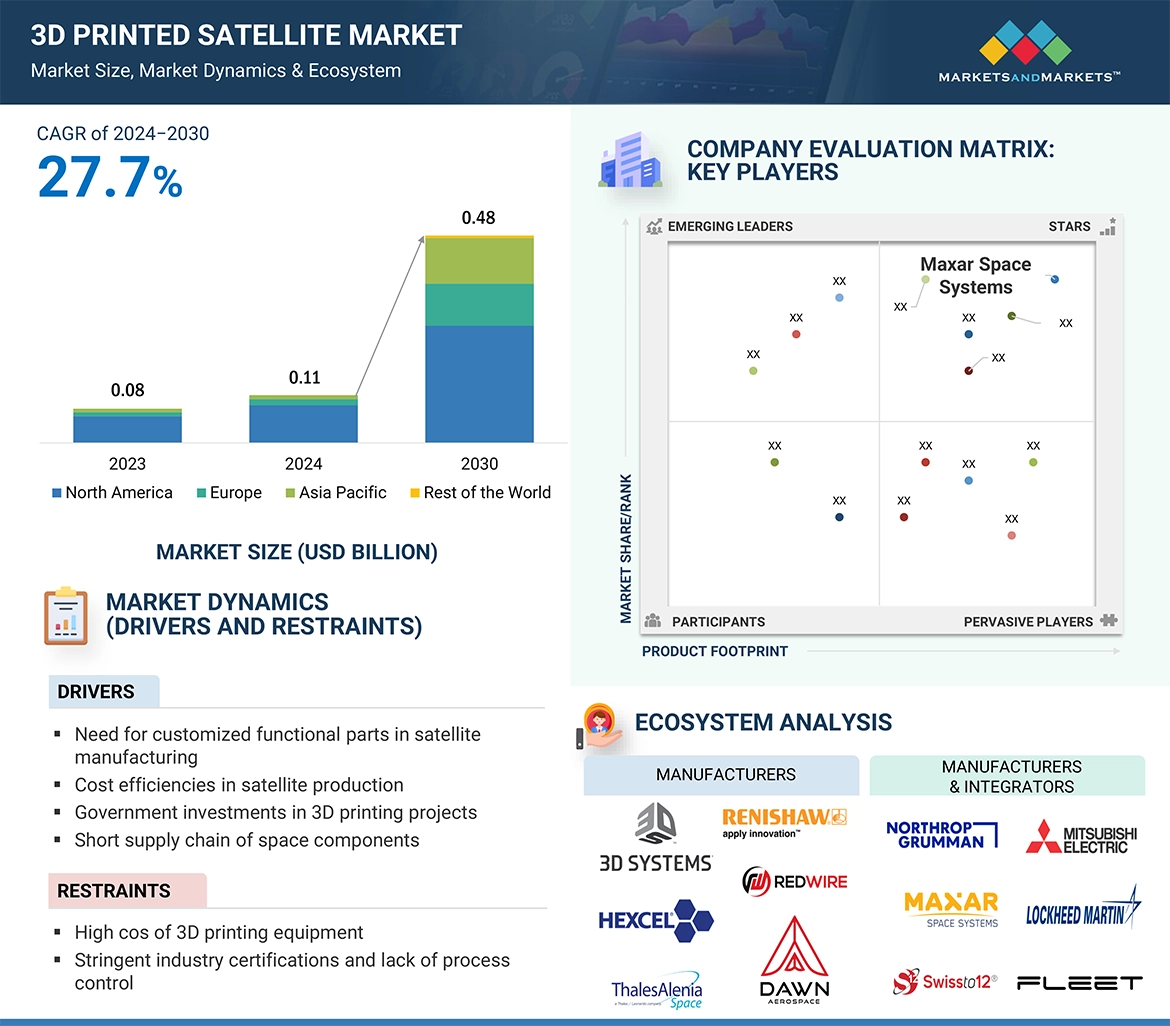
The ranking analysis of companies in the 3D printed satellite market was determined using secondary data from paid and unpaid sources and by analyzing major companies’ product portfolios and service offerings. These companies were rated based on the performance and quality of their 3d printed components. These data points were further validated by primary sources.

Secondary sources referred for this research study on the 3D printed satellite market included financial statements of companies offering 3D printed satellite components, along with various trade, business, and professional associations, among others. The secondary data was collected and analyzed to arrive at the overall size of the 3D-printed satellite market, which was validated by primary respondents.

In addition, the secondary research was used to obtain key information about the industry’s value chain and supply chain to identify key players operating in the market; market classifications and segmentation according to offerings of major players; and industry trends related to the components, application, manufacturing technique, satellite mass, and regions as well as key developments in the market.

Primary Research

Extensive primary research was conducted after obtaining information about the current scenario of the 3D printed satellite market through secondary research. Several primary interviews were conducted with market experts from both the demand and supply sides across four regions: North America, Europe, Asia Pacific, the rest of the world. This primary data was collected through questionnaires, emails, and telephonic interviews.

These interviews were conducted to gather insights such as market statistics, data on revenue collected from the products and services, market breakdowns, market size estimations, market size forecasting, and data triangulation. It also helped analyze the components, application, manufacturing technique, satellite mass segments of the market for four key regions.

3D Printed Satellite Market
 Size, and Share

To know about the assumptions considered for the study, download the pdf brochure

Market Size Estimation

Both the top-down and bottom-up approaches have been used to estimate and validate the size of the market. The research methodology used to estimate the market size also includes the following details:

The key players were identified through secondary research, and their market ranking was determined through primary and secondary research. This included a study of the annual and financial reports of the top market players and extensive interviews of leaders, including chief executive officers (CEO), directors, and marketing executives.
All percentage shares, splits, and breakdowns were determined using secondary sources and verified through primary sources. All possible parameters that affect the markets covered in this research study were accounted for, viewed in extensive detail, verified through primary research, and analyzed to obtain the final quantitative and qualitative data. This data was consolidated, enhanced with detailed inputs, analyzed by MarketsandMarkets, and presented in this report.

Market size estimation methodology: Bottom-up Approach

3D Printed Satellite Market
 Size, and Bottom-up Approach

Market size estimation methodology: Top- Down Approach

3D Printed Satellite Market
 Size, and Top- Down Approach

Data Triangulation

After arriving at the overall size of the 3D printed satellite market from the market size estimation process explained above, the total market was split into several segments and subsegments. To complete the overall market engineering process and arrive at the exact statistics for various market segments and subsegments, data triangulation and market breakdown procedures explained below were implemented, wherever applicable. The data was triangulated by studying various factors and trends from both the demand and supply sides. Along with this, the market size was validated using both top-down and bottom-up approaches.

3D Printed Satellite Market
 Size, and Data Triangulation

Market Definition

3D printing, also known as additive manufacturing, is a process used to manufacture components in a layer-by-layer process using 3D design data stored in a digital file. The technology aids designers in developing superior-quality parts without facing restrictions, such as production feasibility, cost, or complexity. 3D Printed Satellites Market is a rapidly growing market dedicated to prolonging the operational life of orbiting satellites. 3D printing technology enables the production of intricate components without the necessity for conventional soldering and welding processes, thereby mitigating structural concerns associated with these traditional methods.

The 3D printed satellite market has the potential to make space exploration more accessible and affordable. By reducing the cost and complexity of satellite manufacturing, 3D printing could enable more countries and companies to participate in the space industry. Satellites that have less physical weight are also given higher preference in space missions as their weight directly affects the costs involved in the manufacturing of components used in satellites.

Stakeholders

  • 3D printed satellite manufacturers
  • Component Manufacturers
  • Space Contractors
  • Government and Defence organizations related to the market
  • Research Organizations
  • Investors and Venture Capitalists
  • Ministries of Defense
  • R&D Companies

Report Objectives

  • To define, describe, and forecast the size of the 3D printed satellite market based on satellite mass, application, components, manufacturing technique, and region.
  • To forecast the size of the various segments of the 3D printed satellite market based on four regions: North America, Europe, Asia Pacific, and the Rest of the World, along with key countries in each of these regions.
  • To identify and analyze key drivers, restraints, opportunities, and challenges influencing the growth of the market
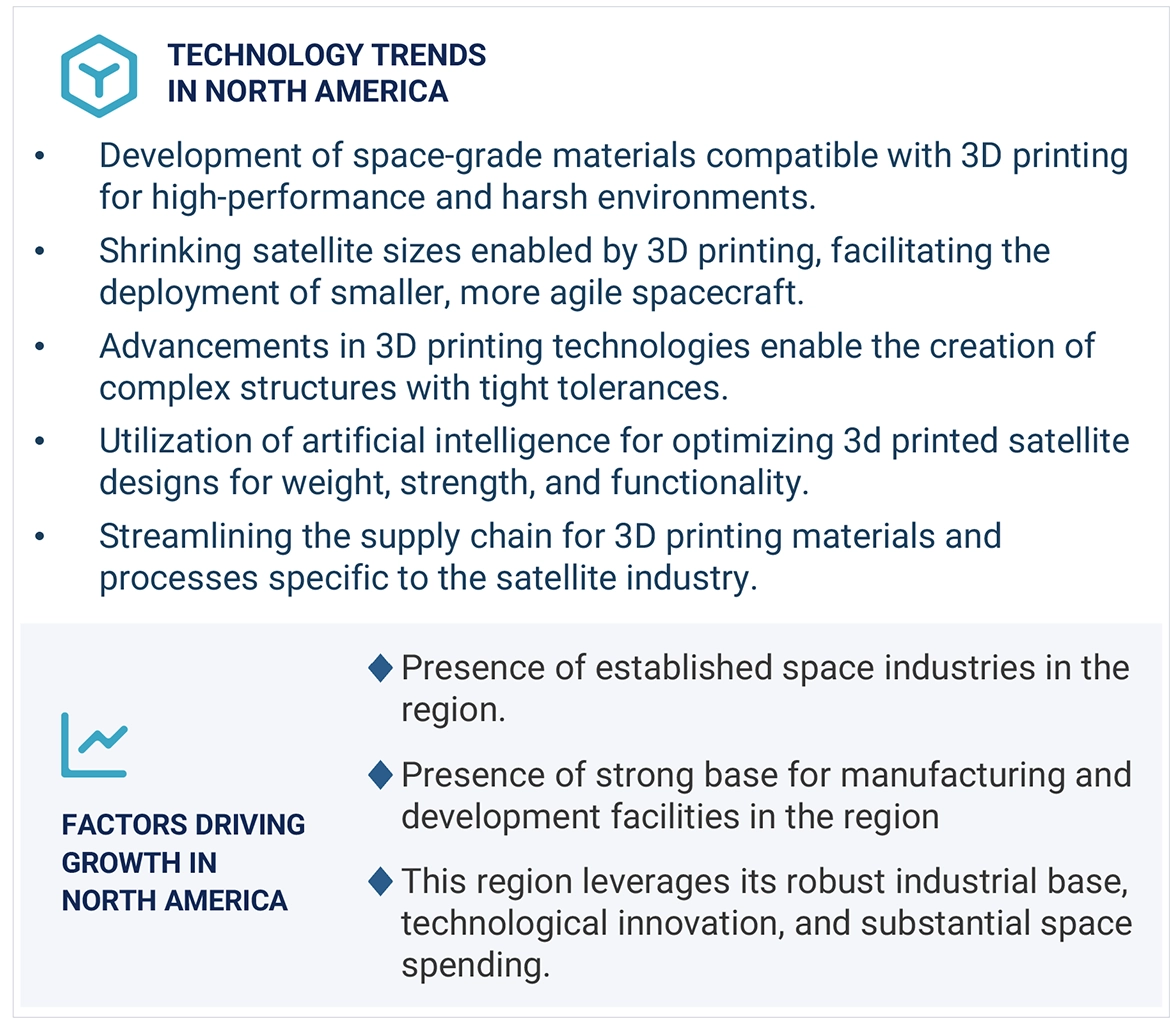
  • To identify industry trends, market trends, and technology trends prevailing in the market
  • To analyze micromarkets with respect to individual technological trends, prospects, and their contribution to the overall market
  • To provide a detailed competitive landscape of the market and analyze competitive growth strategies such as new product developments, contracts, partnerships, joint ventures, agreements, and collaborations adopted by key players in the market
  • To identify the detailed financial position, key products, unique selling points, and key developments of leading companies in the market
  • To strategically profile key market players and comprehensively analyze their market rank analysis and core competencies.

Available customizations

Along with the market data, MarketsandMarkets offers customizations as per the specific needs of companies. The following customization options are available for the report:

Product Analysis

  • Product matrix, which gives a detailed comparison of the product portfolio of each company

Regional Analysis

  • Further breakdown of the market segments at country-level

Company Information

  • Detailed analysis and profiling of additional market players (up to 5)
Custom Market Research Services

We will customize the research for you, in case the report listed above does not meet with your exact requirements. Our custom research will comprehensively cover the business information you require to help you arrive at strategic and profitable business decisions.

Request Customization
Report Code
AS 8984
Published ON
Apr, 2024
Choose License Type
BUY NOW
  • SHARE
X
Request Customization
Speak to Analyst
Speak to Analyst
OR FACE-TO-FACE MEETING
PERSONALIZE THIS RESEARCH
  • Triangulate with your Own Data
  • Get Data as per your Format and Definition
  • Gain a Deeper Dive on a Specific Application, Geography, Customer or Competitor
  • Any level of Personalization
REQUEST A FREE CUSTOMIZATION
LET US HELP YOU!
  • What are the Known and Unknown Adjacencies Impacting the 3D Printed Satellite Market
  • What will your New Revenue Sources be?
  • Who will be your Top Customer; what will make them switch?
  • Defend your Market Share or Win Competitors
  • Get a Scorecard for Target Partners
CUSTOMIZED WORKSHOP REQUEST
+1-888-600-6441
  • Call Us
  • +1-888-600-6441 (Corporate office hours)
  • +1-888-600-6441 (US/Can toll free)
  • +44-800-368-9399 (UK office hours)
CONNECT WITH US
ABOUT TRUST ONLINE
©2024 MarketsandMarkets Research Private Ltd. All rights reserved
DMCA.com Protection Status Website Feedback