5G NTN Market

5G NTN Market by Offering (Hardware, Software, and Services), End-Use Industry (Maritime, Aerospace & Defense, Government, Mining), Application (EMBB, URLLC, MMTC), Location (Urban, Rural, Remote, Isolated), Platform and Region - Global Forecast to 2029

Report Code: TC 8514 Jul, 2024, by marketsandmarkets.com

The 5G NTN market is estimated to be worth USD 7.2 billion in 2024 and is projected to reach USD 31.7  billion by 2029 at a Compound Annual Growth Rate (CAGR) of 34.7% during the forecast period. The 5G NTN market is gaining momentum due to its unique ability to ensure communication continuity in critical situations. Unlike terrestrial networks vulnerable to natural disasters or physical damage, 5G NTN offers resilience. This ensures the uninterrupted operation of critical infrastructure and emergency response systems during disasters. Additionally, the ever-growing number of IoT devices and machine-to-machine (M2M) communication rely on dependable and scalable connectivity. 5G NTN fulfills this need by providing reliable data exchange across vast geographical regions, driving significant market growth.

5G NTN Market

To know about the assumptions considered for the study, Request for Free Sample Report

5G NTN Market  Opportunities

To know about the assumptions considered for the study, download the pdf brochure

5G NTN Market Trends

Driver:  3GPP evolution toward NTN interworking and integration

Integrating terrestrial networks with NTN, such as HAPS in the stratosphere or satellites in Low Earth Orbit (LEO) or Geostationary Orbit (GEO), is a significant advancement introduced in 5G. The initial phase of this evolution was completed in Release 16, and 3GPP is now focusing on further developments in Release 17, including enabling NTNs within the 5G system. NTN functionality is crucial to the 3GPP Release 17 standard and continues to evolve in 5G-Advanced, becoming a key component of the 3GPP Release 18 work plan. NTNs are categorized into two groups: NTN-HOT and NTN-NR. The NTN-IoT group focuses on low-complexity NB-IoT/MIC terminal satellite IoT services, such as global asset tracking for sea containers or other terminals outside cellular network coverage. In the future, direct satellite connections to mobile phones will be widely used in personal applications and various vertical industries, significantly broadening the scope of satellite applications. Convergence technology innovation is actively pursued worldwide, accelerating the integration chain and fostering deep integration between the cellular and satellite industries. The merging of satellite networks with terrestrial networks promises substantial commercial benefits.

Restraint: Need for radio components to be grounded

Radio components like NB and relay operate in space, while the core network must be ground-based. This means that satellites or airborne platforms must eventually connect to a ground station. The challenge lies in a satellite's limited distance before losing connection with the ground station. Consequently, numerous ground stations and satellites are needed to cover extensive areas. Establishing ground stations can be particularly difficult in certain situations, such as covering a large ocean, requiring multiple satellites and their corresponding ground stations. Building ground stations capable of covering such satellites would be challenging. One proposed solution is allowing satellites to connect to the core network indirectly through another satellite rather than directly to a ground station. This would require the creation of relay networks or mesh networks among the satellites. While theoretically feasible and considered in most satellite communication systems from the outset, practical implementation remains challenging. These implementation difficulties could hinder the growth of the 5G NTN market and affect investments from players in the ecosystem.

Opportunity: Need for NTN in Evolution Toward 5G and 6G

Space communications hold promise as a key enabler not only for 5G but also for future 6G wireless technology. Integrating air and spaceborne platforms with terrestrial networks is anticipated to achieve even greater success in 6G. 6G-enabled NTNs may incorporate new technologies such as laser communications, optical and holographic communications, machine learning (ML) and artificial intelligence (AI), and photonic-based cognitive radio to achieve low latency and high reliability in space-Earth transmissions. NTN communications may become essential in 6G wireless to ensure flexibility and integration of terrestrial and satellite networks.

Challenge: Signal interception

Intercepting 5G NTN  signals presents significant technical challenges due to the advanced security features and the unique nature of these communications.In order to create a complex and dynamic network environment, 5G NTN integrates terrestrial 5G infrastructure with satellite and aircraft platforms. Interception attempts are made more difficult by the improved encryption and authentication procedures included into 5G technology, as well as the increased mobility of satellites and airborne platforms. Furthermore, the extremely directional and adaptable signal transmission provided by beamforming and phased array antennas in 5G NTN makes it challenging for unauthorised organisations to intercept these signals without the employment of advanced tools and methods.

Ecosystem of 5G NTN Market

Top Companies in 5G NTN Market

The prominent players in the 5G NTN market include Thales (France), Qualcomm Technologies (US), MediaTek (Taiwan), and so on. These companies have been operating in the market for several years and possess a diversified product portfolio, state-of-the-art technologies, and a well-established geographic footprint.

"By location, rural segment to hold the largest market size during the forecast period.”

The digital gap is being substantially reduced by the increasing demand in rural areas for 5G NTN , which gives residents of these areas access to high-speed internet. Big participants in the industry are taking advantage of this chance to increase their footprint as suppliers of internet access. In places where terrestrial networks are unable to reach, NTN  plays a critical role in enabling multicast broadcasting, Internet of Vehicles, Internet of Remote Things, and IoT communication. Fixed wireless access, wide-area connectivity, network resilience, emergency response, and disaster management are among of the key uses of 5G NTN in rural areas. Furthermore, 5G NTN can facilitate remote learning, telemedicine, and precision agriculture, improving the standard of living and job prospects in rural areas.

“Aerospace & defense segment is expected to have the fastest growth rate during the forecast period.” 

Increasing adoption of innovative technology and digitalized solutions are the key factors for success in the aerospace and defense industry. Adopting the 5G network in this industry supports various new use cases for the Government and military that enable enterprises to improve public safety communication. In the aerospace industry, 5G is improving the efficiency of various operations, such as urban air mobility, airport operations, and aircraft interiors. 5G NTN solutions are focused on enhancing 5G coverage to support various applications in this industry and provide high-speed internet connectivity to aircraft passengers to ensure the same level of connectivity in the plane as on the ground. In the defense sector, a 5G NTN system will play an important role in supporting application areas, including static communication, deployable CIS for expeditionary operations, land operations, real-time remote surgery, and maritime operations.

“North America to have the largest market size during the forecast period.”

5G NTN adoption is accelerating in North America as a result of both the need for reliable connections in underdeveloped areas and technological advancements. OneWeb and Galaxy Broadband Communications announced on February 1, 2023, that they had reached an agreement worth USD 50 million to provide OneWeb's Low Earth Orbit (LEO) access across Canada, including Nunavut. Being a pioneer in the world of 5G, the US gains from early adoption thanks to industry leaders and forward-thinking government programs. With the creation of the USD 9 billion 5G Fund for Rural America, the USD 1 billion allocation for precision agriculture, and the revision of rules to speed up the attachment of 5G backhaul equipment and investment in next-generation networks, the Federal Communications Commission (FCC) has played a crucial role.

5G NTN Market  Size, and Share

Market Players:

The major players in the 5G NTN market are Qualcomm Technologies Inc (US), SoftBank Group Corporation (Japan), Thales Group (France), Rohde & Schwarz GmbH & Co KG (Germany), Keysight Technologies, Inc (US), MediaTek Inc. (Taiwan), SES S.A. (Luxembourg), EchoStar Corporation (US), SpaceX (US), AST SpaceMobile (US), ZTE Corporation (China), GateHouse SatCom (Denmark), OneWeb (UK), Omnispace LLC (US), Nelco (India), Skylo Technologies (US), Globalstar Inc (US), Spirent Communications (UK), Ericsson (Sweden), Nokia Corporation (Finland), Telefonica S.A. (Spain), Viasat Inc, (US), Telesat (Canada), Kuiper Systems (US), Sateliot (Spain), VIAVI Solutions (US), Radisys (US). These players have adopted various growth strategies, such as partnerships, agreements and collaborations, new product launches and enhancements, and acquisitions to expand their 5G NTN market footprint.

Get online access to the report on the World's First Market Intelligence Cloud

  • Easy to Download Historical Data & Forecast Numbers
  • Company Analysis Dashboard for high growth potential opportunities
  • Research Analyst Access for customization & queries
  • Competitor Analysis with Interactive dashboard
  • Latest News, Updates & Trend analysis
Request Sample

Scope of the Report

Report Metrics

Details

Market size available for years

2023-2029

Base year considered

2023

Forecast period

2024–2029

Forecast units

Value (USD Billion)

Segments Covered

By offering (hardware, software, services), by platform (UAS, LEO Satellite, MEO satellite, GEO satellite), By application (eMBB, mMTC, URLLC), by end-use industry (maritime, aerospace & defense, government, mining, other end-use industries) by location (urban, rural, remote, isolated)

Region covered

North America, Europe, Asia Pacific, Middle East & Africa, and Latin America.

Companies covered

Qualcomm Technologies Inc (US), SoftBank Group Corporation (Japan), Thales Group (France), Rohde & Schwarz GmbH & Co KG (Germany), Keysight Technologies, Inc (US), MediaTek Inc. (Taiwan), SES S.A. (Luxembourg), EchoStar Corporation (US), SpaceX (US), AST SpaceMobile (US), ZTE Corporation (China), GateHouse SatCom  (Denmark), OneWeb (UK),  Omnispace LLC (US), Nelco (India), Skylo Technologies (US), Globalstar Inc (US), Spirent Communications (UK), Ericsson  (Sweden), Nokia Corporation (Finland), Telefonica S.A. (Spain), Viasat Inc, (US), Telesat (Canada), Kuiper Systems (US), Sateliot (Spain), VIAVI Solutions (US), Radisys (US).

This research report categorizes the 5G NTN market to forecast revenues and analyze trends in each of the following submarkets:

Based on Offering:
  • Hardware
  • Software
  • Services
  • Deployment services
  • Connectivity services
Based on Platform:
  • UAS Platform
  • LEO Satellite
  • MEO Satellite
  • GEO Satellite
Based on Application
  • eMBB
  • mMTC
  • URLLC
By End-Use Industry:
  • Maritime
  • Aerospace & Defense
  • Government
  • Mining
  • Other end-use industries
By Location:
  • Urban
  • Rural
  • Remote
  • Isolated
By Region:
  • North America
    • United States (US)
    • Canada
  • Europe
    • United Kingdom (UK)
    • Germany
    • France
    • Italy
    • Rest of Europe
  • Asia Pacific
    • China
    • Japan
    • India
    • South Korea
    • Rest of Asia Pacific
  • Middle East & Africa
    • GCC Countries
      • Kingdom of Saudi Arabia (KSA)
      • United Arab Emirates (UAE)
      • Rest of GCC Countries
    • South Africa
    • Rest of the Middle East & Africa
  • Latin America
    • Brazil
    • Mexico
    • Rest of Latin America

Recent Developments

  • In March 2024, SpaceX and John Deere partnered to provide cutting-edge satellite communications (SATCOM) service to farmers, utilizing the Starlink network. This will allow farmers facing rural connectivity challenges to leverage precision agriculture technologies fully.
  • In March 2024, Gatehouse Satcom and Druid Software signed an MOU to collaborate on efforts to enhance NTN services. This partnership aims to integrate satellite and terrestrial network solutions, creating a more accessible and interoperable infrastructure for the satellite communications industry.
  • In October 2023, The Government of Rwanda, in collaboration with SoftBank Corp., announced the successful testing of SoftBank’s exclusive 5G communications payload in the stratosphere. During the demonstration conducted for HAPS research in Rwandan airspace, SoftBank and the Government of Rwanda made history by publicly delivering 5G connectivity from a HAPS UAV in the stratosphere.

Frequently Asked Questions (FAQ):

To speak to our analyst for a discussion on the above findings, click Speak to Analyst

TABLE OF CONTENTS
 
1 INTRODUCTION (Page No. - 24)
    1.1 STUDY OBJECTIVES 
    1.2 MARKET DEFINITION 
    1.3 STUDY SCOPE 
           1.3.1 MARKET SEGMENTATION
           1.3.2 REGIONS COVERED
           1.3.3 INCLUSIONS & EXCLUSIONS
    1.4 YEARS CONSIDERED 
    1.5 CURRENCY CONSIDERED 
           TABLE 1 USD EXCHANGE RATES, 2020–2023
    1.6 LIMITATIONS 
    1.7 STAKEHOLDERS 
    1.8 SUMMARY OF CHANGES 
           1.8.1 RECESSION IMPACT
 
2 RESEARCH METHODOLOGY (Page No. - 29)
    2.1 RESEARCH DATA 
           FIGURE 1 5G NTN MARKET: RESEARCH DESIGN
           2.1.1 SECONDARY DATA
                    2.1.1.1 Key data from secondary sources
           2.1.2 PRIMARY DATA
                    2.1.2.1 Primary interviews with experts
                    2.1.2.2 List of key primary interview participants
                    2.1.2.3 Breakdown of primaries
                    2.1.2.4 Key data from primary sources
                    2.1.2.5 Key industry insights
    2.2 MARKET SIZE ESTIMATION 
           2.2.1 BOTTOM-UP APPROACH
                    FIGURE 2 MARKET SIZE ESTIMATION METHODOLOGY, BOTTOM-UP (SUPPLY SIDE): COLLECTIVE REVENUE FROM HARDWARE, SOFTWARE, AND SERVICES OF 
5G NTN MARKET
           2.2.2 TOP-DOWN APPROACH
           2.2.3 5G NTN MARKET SIZE ESTIMATION: SUPPLY-SIDE ANALYSIS (TOP-DOWN)
                    FIGURE 3 MARKET SIZE ESTIMATION METHODOLOGY: SUPPLY-SIDE ANALYSIS (TOP-DOWN)
           2.2.4 5G NTN MARKET SIZE ESTIMATION: DEMAND-SIDE ANALYSIS
                    FIGURE 4 MARKET SIZE ESTIMATION METHODOLOGY: DEMAND-SIDE ANALYSIS
           2.2.5 MARKET FORECAST
                    TABLE 2 MARKET FORECAST
    2.3 MARKET BREAKDOWN AND DATA TRIANGULATION 
           FIGURE 5 DATA TRIANGULATION
    2.4 RESEARCH ASSUMPTIONS 
    2.5 LIMITATIONS & RISK ASSESSMENT 
           FIGURE 6 LIMITATIONS
    2.6 IMPACT OF RECESSION ON 5G NTN MARKET 
 
3 EXECUTIVE SUMMARY (Page No. - 40)
    FIGURE 7 5G NTN MARKET, 2024–2029 (USD MILLION) 
    FIGURE 8 5G NTN MARKET, BY REGION, 2024 
 
4 PREMIUM INSIGHTS (Page No. - 42)
    4.1 OPPORTUNITIES FOR PLAYERS IN 5G NTN MARKET 
           FIGURE 9 INCREASING DEMAND FOR INTERNET IN REMOTE AND ISOLATED AREAS TO DRIVE MARKET GROWTH
    4.2 MARKET, BY OFFERING 
           FIGURE 10 SERVICES SEGMENT TO REGISTER HIGHEST GROWTH RATE DURING FORECAST PERIOD
    4.3 MARKET, BY LOCATION 
           FIGURE 11 RURAL SEGMENT ESTIMATED TO LEAD MARKET IN 2024
    4.4 MARKET, BY APPLICATION 
           FIGURE 12 EMBB SEGMENT TO ACCOUNT FOR LARGEST MARKET BY 2029
    4.5 5G NTN MARKET, BY END-USE INDUSTRY 
           FIGURE 13 MARITIME TO ACCOUNT FOR LARGEST MARKET BY 2029
    4.6 MARKET, BY PLATFORM 
           FIGURE 14 GEO SATELLITE TO ACCOUNT FOR LARGEST MARKET BY 2024
    4.7 NORTH AMERICA: 5G NTN MARKET, BY OFFERING AND KEY PLATFORM 
           FIGURE 15 HARDWARE AND GEO SATELLITE SEGMENTS TO ACCOUNT FOR SIGNIFICANT SHARES IN 2024
 
5 5G NTN MARKET OVERVIEW AND INDUSTRY TRENDS (Page No. - 46)
    5.1 INTRODUCTION 
    5.2 MARKET DYNAMICS 
           FIGURE 16 MARKET: DRIVERS, RESTRAINTS, OPPORTUNITIES, AND CHALLENGES
           5.2.1 DRIVERS
                    5.2.1.1 Adoption of software-centric approach
                    5.2.1.2 Need to address extreme coverage extension
                    5.2.1.3 3GPP evolution toward NTN interworking and integration
                    5.2.1.4 Growing demand for IoT
           5.2.2 RESTRAINTS
                    5.2.2.1 Need for radio components to be grounded
                    5.2.2.2 Regulatory constraints
           5.2.3 OPPORTUNITIES
                    5.2.3.1 Impact of NR-NTN integration on 5G connectivity
                    5.2.3.2 Need for NTN in evolution toward 5G and 6G
                    5.2.3.3 5G NB-IoT NTN to contribute to global high speed
           5.2.4 CHALLENGES
                    5.2.4.1 Signal interception
                    5.2.4.2 Propagation delay and low latency due to great distance between satellites and terrestrial user equipment
                    5.2.4.3 Doppler frequency shift owing to mobility issues
    5.3 BRIEF HISTORY OF 5G NTN TECHNOLOGY 
           FIGURE 17 BRIEF HISTORY OF 5G NTN TECHNOLOGY
           5.3.1 2000–2015
           5.3.2 2016–2018
           5.3.3 2019–2021
           5.3.4 2022–2023
           5.3.5 2024–PRESENT
    5.4 TRENDS & DISRUPTIONS IMPACTING CUSTOMERS’ BUSINESSES 
           FIGURE 18 TRENDS & DISRUPTIONS IMPACTING CUSTOMERS’ BUSINESSES
    5.5 PRICING ANALYSIS 
           5.5.1 AVERAGE SELLING PRICE TREND OF KEY PLAYERS, BY HARDWARE
                    FIGURE 19 AVERAGE SELLING PRICE TRENDS OF KEY PLAYERS, BY HARDWARE
                    TABLE 3 AVERAGE SELLING PRICE TREND OF KEY PLAYERS, BY HARDWARE (USD)
           5.5.2 INDICATIVE PRICING ANALYSIS OF KEY PLAYERS, BY SERVICE
           TABLE 4 INDICATIVE PRICING ANALYSIS OF 5G NTN, BY SERVICE (USD)
    5.6 VALUE CHAIN ANALYSIS 
           FIGURE 20 5G NTN MARKET: VALUE CHAIN ANALYSIS
    5.7 5G NTN MARKET: ECOSYSTEM ANALYSIS 
           FIGURE 21 5G NTN MARKET: ECOSYSTEM ANALYSIS
           TABLE 5 5G NTN MARKET: ROLE OF PLAYERS IN MARKET ECOSYSTEM
    5.8 TECHNOLOGY ANALYSIS 
           5.8.1 KEY TECHNOLOGIES
                    5.8.1.1 Satellite communications
                    5.8.1.2 IoT
                    5.8.1.3 High-Altitude Platforms (HAPs)
           5.8.2 COMPLEMENTARY TECHNOLOGIES
                    5.8.2.1 Wi-Fi
                    5.8.2.2 Cloud computing
                    5.8.2.3 Fiber optic
           5.8.3 ADJACENT TECHNOLOGIES
                    5.8.3.1 Artificial Intelligence and Machine Learning
                    5.8.3.2 Edge computing
    5.9 PATENT ANALYSIS 
           5.9.1 METHODOLOGY
                    FIGURE 22 LIST OF MAJOR PATENTS IN 5G NTN MARKET
           5.9.2 LIST OF MAJOR PATENTS GRANTED, 2022–2023
    5.1 HS CODES 
           5.10.1 EXPORT SCENARIO FOR HS CODE: 851761
                    FIGURE 23 EXPORT SCENARIO FOR HS CODE: 851761, BY COUNTRY, 2021–2023 (USD THOUSAND)
                    TABLE 6 EXPORT SCENARIO FOR HS CODE: 851761, BY COUNTRY, 2021–2023 (USD THOUSAND)
           5.10.2 IMPORT SCENARIO FOR HS CODE: 851761
                    FIGURE 24 IMPORT SCENARIO FOR HS CODE: 851761, BY COUNTRY, 2021–2023 (USD THOUSAND)
                    TABLE 7 IMPORT SCENARIO FOR HS CODE: 851761, BY COUNTRY, 2021–2023 (USD THOUSAND)
    5.11 CASE STUDY ANALYSIS 
           5.11.1 CASE STUDY 1: KEYSIGHT TECHNOLOGIES AND QUALCOMM TECHNOLOGIES ESTABLISHED END-TO-END 5G NTN CONNECTION
           5.11.2 CASE STUDY 2: ERICSSON, QUALCOMM, AND THALES COLLABORATED TO PROVIDE GLOBAL COVERAGE THROUGH 5G SMARTPHONES
           5.11.3 CASE STUDY 3: SMART AND OMNISPACE TEAMED UP TO EXPLORE SPACE-BASED 5G TECHNOLOGIES
           5.11.4 CASE STUDY 4: T-MOBILE AND SPACEX COLLABORATED TO PROVIDE TEXT COVERAGE AND OFFER NO-DEAD ZONES
           5.11.5 CASE STUDY 5: ZTE CORPORATION AND CHINA MOBILE SHOWCASED FIRST 5G NTN FIELD TRIAL
    5.12 KEY CONFERENCES & EVENTS 
                    TABLE 8 5G NTN MARKET: DETAILED LIST OF CONFERENCES & EVENTS, 2024–2025
    5.13 5G NTN MARKET: BUSINESS MODELS 
           5.13.1 SATELLITE INTERNET SERVICE PROVIDERS (ISPS)
           5.13.2 AERIAL NETWORK PROVIDERS
           5.13.3 ENTERPRISE SOLUTIONS
           5.13.4 SUBSCRIPTION-BASED SERVICES
           5.13.5 INFRASTRUCTURE-AS-A-SERVICE (IAAS)
    5.14 BEST PRACTICES IN 5G NTN MARKET 
           5.14.1 STRATEGIC DEPLOYMENT PLANNING
           5.14.2 TECHNOLOGY INTEGRATION
           5.14.3 ADVANCED ANTENNA AND MODEM TECHNOLOGIES
           5.14.4 EFFICIENT SPECTRUM MANAGEMENT
           5.14.5 ROBUST BACKHAUL SOLUTIONS
           5.14.6 POWER MANAGEMENT AND SUSTAINABILITY
           5.14.7 SECURITY AND PRIVACY
           5.14.8 COLLABORATIONS AND PARTNERSHIPS
           5.14.9 ROBUST API DOCUMENTATION
                    5.14.10 USER EXPERIENCE AND FEEDBACK
    5.15 5G NTN TOOLS, FRAMEWORKS, AND TECHNIQUES 
    5.16 REGULATORY LANDSCAPE 
           5.16.1 REGULATORY BODIES, GOVERNMENT AGENCIES, AND OTHER ORGANIZATIONS
                    TABLE 9 NORTH AMERICA: LIST OF REGULATORY BODIES, GOVERNMENT AGENCIES, AND OTHER ORGANIZATIONS
                    TABLE 10 EUROPE: LIST OF REGULATORY BODIES, GOVERNMENT AGENCIES, AND OTHER ORGANIZATIONS
                    TABLE 11 ASIA PACIFIC: LIST OF REGULATORY BODIES, GOVERNMENT AGENCIES, AND OTHER ORGANIZATIONS
                    TABLE 12 MIDDLE EAST & AFRICA: LIST OF REGULATORY BODIES, GOVERNMENT AGENCIES, AND OTHER ORGANIZATIONS
                    TABLE 13 LATIN AMERICA: LIST OF REGULATORY BODIES, GOVERNMENT AGENCIES, AND OTHER ORGANIZATIONS
           5.16.2 REGULATIONS, BY REGION
                    5.16.2.1 North America
                               5.16.2.1.1 US
                               5.16.2.1.2 Canada
                    5.16.2.2 Europe
                    5.16.2.3 Asia Pacific
                               5.16.2.3.1 China
                               5.16.2.3.2 Australia
                               5.16.2.3.3 Japan
                    5.16.2.4 Middle East & Africa
                               5.16.2.4.1 UAE
                               5.16.2.4.2 KSA
                    5.16.2.5 Latin America
                               5.16.2.5.1 Mexico
    5.17 PORTER’S FIVE FORCES ANALYSIS 
                    FIGURE 25 5G NTN MARKET: PORTER’S FIVE FORCES ANALYSIS
                    TABLE 14 IMPACT OF PORTER’S FIVE FORCES ON 5G NTN MARKET
           5.17.1 THREAT OF NEW ENTRANTS
           5.17.2 THREAT OF SUBSTITUTES
           5.17.3 BARGAINING POWER OF BUYERS
           5.17.4 BARGAINING POWER OF SUPPLIERS
           5.17.5 INTENSITY OF COMPETITIVE RIVALRY
    5.18 KEY STAKEHOLDERS & BUYING CRITERIA 
           5.18.1 KEY STAKEHOLDERS IN BUYING PROCESS
                    FIGURE 26 INFLUENCE OF KEY STAKEHOLDERS ON BUYING PROCESS FOR KEY LOCATIONS
                    TABLE 15 INFLUENCE OF STAKEHOLDERS ON BUYING PROCESS FOR KEY LOCATIONS
           5.18.2 BUYING CRITERIA
                    FIGURE 27 KEY BUYING CRITERIA
                    TABLE 16 KEY BUYING CRITERIA
    5.19 INVESTMENT & FUNDING SCENARIO 
                    FIGURE 28 INVESTMENT AND FUNDING SCENARIO
 
6 5G NTN MARKET, BY OFFERING (Page No. - 79)
    6.1 INTRODUCTION 
           6.1.1 OFFERINGS: MARKET DRIVERS
                    FIGURE 29 SERVICES SEGMENT TO GROW AT HIGHEST CAGR DURING FORECAST PERIOD
                    TABLE 17 5G NTN MARKET, BY OFFERING, 2023–2029 (USD MILLION)
    6.2 HARDWARE 
           6.2.1 SHIFT TOWARD 5G NTN HARDWARE INSTALLATION TO ENHANCE NETWORK COVERAGE
                    TABLE 18 HARDWARE: MARKET, BY REGION, 2023–2029 (USD MILLION)
    6.3 SOFTWARE 
           6.3.1 SOFTWARE SOLUTIONS TO ENSURE SEAMLESS CONNECTIVITY IN REMOTE LOCATIONS
                    TABLE 19 SOFTWARE: MARKET, BY REGION, 2023–2029 (USD MILLION)
    6.4 SERVICES 
           6.4.1 DEMAND FOR UNINTERRUPTED CONNECTIVITY IN UNDERSERVED AREAS TO DRIVE MARKET FOR 5G NTN SERVICES
                    TABLE 20 5G NTN MARKET, BY SERVICE, 2023–2029 (USD MILLION)
                    TABLE 21 SERVICES: MARKET, BY REGION, 2023–2029 (USD MILLION)
           6.4.2 DEPLOYMENT SERVICES
                    TABLE 22 DEPLOYMENT SERVICES: MARKET, BY REGION, 2023–2029 (USD MILLION)
           6.4.3 CONNECTIVITY SERVICES
                    TABLE 23 CONNECTIVITY SERVICES: MARKET, BY REGION, 2023–2029 (USD MILLION)
 
7 5G NTN MARKET, BY PLATFORM (Page No. - 85)
    7.1 INTRODUCTION 
           7.1.1 PLATFORMS: 5G NTN MARKET DRIVERS
                    FIGURE 30 LEO SATELLITE SEGMENT TO GROW AT HIGHEST CAGR DURING FORECAST PERIOD
                    TABLE 24 5G NTN MARKET, BY PLATFORM, 2023–2029 (USD MILLION)
    7.2 UAS PLATFORM 
           7.2.1 FOCUS ON SUPPORTING AIRBORNE COMMUNICATION TO SPUR GROWTH
                    TABLE 25 UAS PLATFORM: 5G NTN MARKET, BY REGION, 2023–2029 (USD MILLION)
    7.3 LEO SATELLITE 
           7.3.1 LEO SATELLITES PROVIDE CONNECTIVITY COVERAGE AT ALTITUDES RANGING FROM 300 TO 1500 KM
                    TABLE 26 LEO SATELLITE: MARKET, BY REGION, 2023–2029 (USD MILLION)
    7.4 MEO SATELLITE 
           7.4.1 MEO SATELLITES HAVE LOWER ORBITS THAN GEO SATELLITES, REDUCING RF POWER REQUIREMENTS AND COMMUNICATION DELAYS
                    TABLE 27 MEO SATELLITE: MARKET, BY REGION, 2023–2029 (USD MILLION)
    7.5 GEO SATELLITE 
           7.5.1 GEO PLATFORMS SUPPORT AND ENHANCE NETWORK COVERAGE IN REMOTE, ISOLATED, AND UNDERSERVED AREAS
                    TABLE 28 GEO SATELLITE: MARKET, BY REGION, 2023–2029 (USD MILLION)
 
8 5G NTN MARKET, BY APPLICATION (Page No. - 90)
    8.1 INTRODUCTION 
           FIGURE 31 MMTC SEGMENT TO GROW AT HIGHEST CAGR DURING FORECAST PERIOD
           TABLE 29 5G NTN MARKET, BY APPLICATION, 2023–2029 (USD MILLION)
           8.1.1 APPLICATIONS: MARKET DRIVERS
    8.2 EMBB 
           8.2.1 NEED TO OFFER HIGH-SPEED BROADBAND CONNECTIVITY IN DENSELY POPULATED AREAS TO PROPEL GROWTH
                    TABLE 30 EMBB: MARKET, BY REGION, 2023–2029 (USD MILLION)
    8.3 MMTC 
           8.3.1 NEED FOR SCALABLE AND EFFICIENT CONNECTIVITY OF MANY DEVICES TO BOOST MARKET EXPANSION
                    TABLE 31 MMTC: MARKET, BY REGION, 2023–2029 (USD MILLION)
    8.4 URLLC 
           8.4.1 URLLC PROVIDES DATA TRANSMISSION WITH HIGH RELIABILITY IN 5G NTN SYSTEMS
                    TABLE 32 URLLC: MARKET, BY REGION, 2023–2029 (USD MILLION)
 
9 5G NTN MARKET, BY END-USE INDUSTRY (Page No. - 95)
    9.1 INTRODUCTION 
           9.1.1 END-USE INDUSTRIES: MARKET DRIVERS
                    FIGURE 32 AEROSPACE & DEFENSE SEGMENT TO GROW AT HIGHEST CAGR DURING FORECAST PERIOD
                    TABLE 33 5G NTN MARKET, BY END-USE INDUSTRY, 2023–2029 (USD MILLION)
    9.2 MARITIME 
           9.2.1 ENHANCED 5G NETWORK COVERAGE TO SUPPORT TRACKING AND MONITORING IN MARITIME INDUSTRY
           9.2.2 USE CASES
                    9.2.2.1 Vessel Connectivity
                    9.2.2.2 Port Operations Optimization
                               TABLE 34 MARITIME: 5G NTN MARKET, BY REGION, 2023–2029 (USD MILLION)
    9.3 AEROSPACE & DEFENSE 
           9.3.1 INCREASING ADOPTION OF INNOVATIVE TECHNOLOGY AND DIGITALIZED SOLUTIONS TO DRIVE MARKET
           9.3.2 USE CASES
                    9.3.2.1 Military Tactical Communication
                    9.3.2.2 Airborne Command and Control
                    9.3.2.3 Defense Surveillance and Reconnaissance
                               TABLE 35 AEROSPACE & DEFENSE: MARKET, BY REGION, 2023–2029 (USD MILLION)
    9.4 GOVERNMENT 
           9.4.1 RISING NEED FOR IMPROVED SAFETY AND SECURITY OF GOVERNMENT NETWORKS TO BOOST MARKET
           9.4.2 USE CASES
                    9.4.2.1 Disaster Response Coordination
                    9.4.2.2 Remote Governance and Public Services
                               TABLE 36 GOVERNMENT: 5G NTN MARKET, BY REGION, 2023–2029 (USD MILLION)
    9.5 MINING 
           9.5.1 ADOPTION OF 5G CONNECTIVITY IN MINING SECTOR TO FACILITATE WORKER SAFETY
           9.5.2 USE CASES
                    9.5.2.1 Remote Equipment Monitoring
                    9.5.2.2 Environmental Monitoring
                               TABLE 37 MINING: MARKET, BY REGION, 2023–2029 (USD MILLION)
    9.6 OTHER END-USE INDUSTRIES 
           9.6.1 USE CASES
                    9.6.1.1 Smart Warehousing
                    9.6.1.2 Wildfire Detection and Prevention
                    9.6.1.3 Autonomous Driving
                    9.6.1.4 Real-Time Patient Monitoring
                               TABLE 38 OTHER END-USE INDUSTRIES: 5G NTN MARKET, BY REGION, 2023–2029 (USD MILLION)
 
10 5G NTN MARKET, BY LOCATION (Page No. - 103)
     10.1 INTRODUCTION 
             10.1.1 LOCATIONS: MARKET DRIVERS
                       FIGURE 33 ISOLATED SEGMENT TO GROW AT HIGHEST CAGR DURING FORECAST PERIOD
                       TABLE 39 MARKET, BY LOCATION, 2023–2029 (USD MILLION)
     10.2 URBAN 
             10.2.1 HIGH-SPEED INTERNET CONNECTIVITY TO STRENGTHEN SMART INFRASTRUCTURE IN URBAN AREAS
                       TABLE 40 URBAN: MARKET, BY REGION, 2023–2029 (USD MILLION)
     10.3 RURAL 
             10.3.1 FOCUS ON ELIMINATING DIGITAL DIVIDE IN RURAL AREAS TO ENCOURAGE ADOPTION OF 5G NTN SYSTEMS
                       TABLE 41 RURAL: MARKET, BY REGION, 2023–2029 (USD MILLION)
     10.4 REMOTE 
             10.4.1 5G NTN SYSTEMS SUPPORT MOVEMENT OF WORKERS FROM URBAN TO REMOTE AREAS
                       TABLE 42 REMOTE: MARKET, BY REGION, 2023–2029 (USD MILLION)
     10.5 ISOLATED 
             10.5.1 5G NTN SERVICES PROVIDE 5G COVERAGE IN ISOLATED AREAS
                       TABLE 43 ISOLATED: 5G NTN MARKET, BY REGION, 2023–2029 (USD MILLION)
 
11 5G NTN MARKET, BY REGION (Page No. - 108)
     11.1 INTRODUCTION 
               FIGURE 34 MARKET: REGIONAL SNAPSHOT
               FIGURE 35 MARKET, BY REGION, 2024 VS. 2029 (USD MILLION)
               TABLE 44 MARKET, BY REGION, 2023–2029 (USD MILLION)
     11.2 NORTH AMERICA 
             11.2.1 NORTH AMERICA: MARKET DRIVERS
             11.2.2 NORTH AMERICA: RECESSION IMPACT
                       FIGURE 36 NORTH AMERICA: MARKET SNAPSHOT
                       TABLE 45 NORTH AMERICA: MARKET, BY OFFERING, 2023–2029 (USD MILLION)
                       TABLE 46 NORTH AMERICA: MARKET, BY SERVICE, 2023–2029 (USD MILLION)
                       TABLE 47 NORTH AMERICA: MARKET, BY PLATFORM, 2023–2029 (USD MILLION)
                       TABLE 48 NORTH AMERICA: MARKET, BY END-USE INDUSTRY, 2023–2029 (USD MILLION)
                       TABLE 49 NORTH AMERICA: MARKET, BY APPLICATION, 2023–2029 (USD MILLION)
                       TABLE 50 NORTH AMERICA: MARKET, BY LOCATION, 2023–2029 (USD MILLION)
                       TABLE 51 NORTH AMERICA: MARKET, BY COUNTRY, 2023–2029 (USD MILLION)
             11.2.3 US
                       11.2.3.1 Remarkable growth of smart connected devices to boost market growth
             11.2.4 CANADA
                       11.2.4.1 Improvement in network connectivity in rural areas to drive market
     11.3 EUROPE 
             11.3.1 EUROPE: MARKET DRIVERS
             11.3.2 EUROPE: RECESSION IMPACT
                       TABLE 52 EUROPE: MARKET, BY OFFERING, 2023–2029 (USD MILLION)
                       TABLE 53 EUROPE: MARKET, BY SERVICE, 2023–2029 (USD MILLION)
                       TABLE 54 EUROPE: MARKET, BY PLATFORM, 2023–2029 (USD MILLION)
                       TABLE 55 EUROPE: MARKET, BY END-USE INDUSTRY, 2023–2029 (USD MILLION)
                       TABLE 56 EUROPE: MARKET, BY APPLICATION, 2023–2029 (USD MILLION)
                       TABLE 57 EUROPE: MARKET, BY LOCATION, 2023–2029 (USD MILLION)
                       TABLE 58 EUROPE: MARKET, BY COUNTRY, 2023–2029 (USD MILLION)
             11.3.3 UK
                       11.3.3.1 Deployment of 5G services to help reduce carbon emission
             11.3.4 GERMANY
                       11.3.4.1 Initiatives by government to expand 5G coverage to spur growth
             11.3.5 FRANCE
                       11.3.5.1 Advanced economy and flourishing IT market to drive use of 5G NTN systems
             11.3.6 ITALY
                       11.3.6.1 Government initiatives and funding to drive use of 5G NTN systems
             11.3.7 REST OF EUROPE
     11.4 ASIA PACIFIC 
             11.4.1 ASIA PACIFIC: MARKET DRIVERS
             11.4.2 ASIA PACIFIC: RECESSION IMPACT
                       FIGURE 37 ASIA PACIFIC: MARKET SNAPSHOT
                       TABLE 59 ASIA PACIFIC: MARKET, BY OFFERING, 2023–2029 (USD MILLION)
                       TABLE 60 ASIA PACIFIC: MARKET, BY SERVICE, 2023–2029 (USD MILLION)
                       TABLE 61 ASIA PACIFIC: MARKET, BY PLATFORM, 2023–2029 (USD MILLION)
                       TABLE 62 ASIA PACIFIC: MARKET, BY END-USE INDUSTRY, 2023–2029 (USD MILLION)
                       TABLE 63 ASIA PACIFIC: MARKET, BY APPLICATION, 2023–2029 (USD MILLION)
                       TABLE 64 ASIA PACIFIC: MARKET, BY LOCATION, 2023–2029 (USD MILLION)
                       TABLE 65 ASIA PACIFIC: MARKET, BY COUNTRY, 2023–2029 (USD MILLION)
             11.4.3 CHINA
                       11.4.3.1 Successful field trial of 5G NTN to demonstrate communication services
             11.4.4 INDIA
                       11.4.4.1 Increasing focus on smart infrastructure development to lead to adoption of 5G NTN services
             11.4.5 SOUTH KOREA
                       11.4.5.1 Demand for 5G and 6G wireless technology to drive market
             11.4.6 JAPAN
                       11.4.6.1 Strategic collaborations and 5G NTN advancements to drive market
             11.4.7 REST OF ASIA PACIFIC
     11.5 MIDDLE EAST & AFRICA 
             11.5.1 MIDDLE EAST & AFRICA: MARKET DRIVERS
             11.5.2 MIDDLE EAST & AFRICA: RECESSION IMPACT
                       TABLE 66 MIDDLE EAST & AFRICA: MARKET, BY OFFERING, 2023–2029 (USD MILLION)
                       TABLE 67 MIDDLE EAST & AFRICA: MARKET, BY SERVICE, 2023–2029 (USD MILLION)
                       TABLE 68 MIDDLE EAST & AFRICA: MARKET, BY PLATFORM, 2023–2029 (USD MILLION)
                       TABLE 69 MIDDLE EAST & AFRICA: MARKET, BY END-USE INDUSTRY, 2023–2029 (USD MILLION)
                       TABLE 70 MIDDLE EAST & AFRICA: MARKET, BY APPLICATION, 2023–2029 (USD MILLION)
                       TABLE 71 MIDDLE EAST & AFRICA: MARKET, BY LOCATION, 2023–2029 (USD MILLION)
                       TABLE 72 MIDDLE EAST & AFRICA: MARKET, BY REGION, 2023–2029 (USD MILLION)
             11.5.3 GCC COUNTRIES
                       11.5.3.1 UAE
                                   11.5.3.1.1 Government initiatives and major companies to drive growth
                       11.5.3.2 Saudi Arabia
                                   11.5.3.2.1 Initiatives by major players to drive growth
                       11.5.3.3 Rest of GCC Countries
             11.5.4 SOUTH AFRICA
                       11.5.4.1 Focus of rural connectivity to drive growth of market
             11.5.5 REST OF MIDDLE EAST & AFRICA
     11.6 LATIN AMERICA 
             11.6.1 LATIN AMERICA: MARKET DRIVERS
             11.6.2 LATIN AMERICA: RECESSION IMPACT
                       TABLE 73 LATIN AMERICA: MARKET, BY OFFERING, 2023–2029 (USD MILLION)
                       TABLE 74 LATIN AMERICA: MARKET, BY SERVICE, 2023–2029 (USD MILLION)
                       TABLE 75 LATIN AMERICA: MARKET, BY PLATFORM, 2023–2029 (USD MILLION)
                       TABLE 76 LATIN AMERICA: MARKET, BY END-USE INDUSTRY, 2023–2029 (USD MILLION)
                       TABLE 77 LATIN AMERICA: MARKET, BY APPLICATION, 2023–2029 (USD MILLION)
                       TABLE 78 LATIN AMERICA: MARKET, BY LOCATION, 2023–2029 (USD MILLION)
                       TABLE 79 LATIN AMERICA: MARKET, BY COUNTRY, 2023–2029 (USD MILLION)
             11.6.3 BRAZIL
                       11.6.3.1 Increased investment in digital infrastructure to drive demand for 5G NTN solutions
             11.6.4 MEXICO
                       11.6.4.1 Focus of select companies on enhancing network connectivity to propel market
             11.6.5 REST OF LATIN AMERICA
 
12 COMPETITIVE LANDSCAPE (Page No. - 136)
     12.1 INTRODUCTION 
     12.2 KEY PLAYER STRATEGIES/RIGHT TO WIN 
             12.2.1 OVERVIEW OF STRATEGIES DEPLOYED BY KEY 5G NTN PLAYERS
     12.3 REVENUE ANALYSIS 
               FIGURE 38 HISTORICAL REVENUE ANALYSIS OF KEY PLAYERS, 2019–2023 (USD MILLION)
     12.4 5G NTN MARKET SHARE ANALYSIS 
               FIGURE 39 SHARE OF LEADING COMPANIES IN MARKET, 2023
               TABLE 80 MARKET: DEGREE OF COMPETITION
             12.4.1 MARKET RANKING ANALYSIS
                       FIGURE 40 MARKET RANKING ANALYSIS OF TOP FIVE PLAYERS
     12.5 COMPANY EVALUATION MATRIX: KEY PLAYERS, 2023 
             12.5.1 STARS
             12.5.2 EMERGING LEADERS
             12.5.3 PERVASIVE PLAYERS
             12.5.4 PARTICIPANTS
                       FIGURE 41 5G NTN MARKET: COMPANY EVALUATION MATRIX (KEY PLAYERS), 2023
             12.5.5 COMPANY FOOTPRINT: KEY PLAYERS, 2023
                       12.5.5.1 Company Footprint
                                   FIGURE 42 COMPANY FOOTPRINT, 2024
                       12.5.5.2 Offering Footprint
                                   TABLE 81 OFFERING FOOTPRINT, 2023
                       12.5.5.3 Location Footprint
                                   TABLE 82 LOCATION FOOTPRINT, 2023
                       12.5.5.4 Regional Footprint
                                   TABLE 83 REGIONAL FOOTPRINT, 2023
     12.6 STARTUP/SME EVALUATION MATRIX, 2023 
             12.6.1 PROGRESSIVE COMPANIES
             12.6.2 RESPONSIVE COMPANIES
             12.6.3 DYNAMIC COMPANIES
             12.6.4 STARTING BLOCKS
                       FIGURE 43 5G NTN MARKET: STARTUP/SME EVALUATION MATRIX, 2023
             12.6.5 COMPETITIVE BENCHMARKING
                       TABLE 84 DETAILED LIST OF STARTUPS/SMES, 2023
                       TABLE 85 COMPETITIVE BENCHMARKING OF KEY STARTUPS/SMES
     12.7 COMPETITIVE SCENARIO 
             12.7.1 PRODUCT LAUNCHES
                       TABLE 86 5G NTN MARKET: PRODUCT LAUNCHES, JANUARY 2021–JUNE 2023
             12.7.2 DEALS
                       TABLE 87 5G NTN MARKET: DEALS, JANUARY 2021–MARCH 2024
     12.8 BRAND/PRODUCT COMPARISON 
               FIGURE 44 BRAND/PRODUCT COMPARISON
     12.9 COMPANY VALUATION AND FINANCIAL METRICS 
               FIGURE 45 COMPANY VALUATION (USD MILLION)
               FIGURE 46 FINANCIAL METRICS OF KEY 5G NTN VENDORS, 2024
 
13 COMPANY PROFILES (Page No. - 158)
     13.1 KEY PLAYERS 
             13.1.1 THALES
                       TABLE 88 THALES: BUSINESS OVERVIEW
                       FIGURE 47 THALES: COMPANY SNAPSHOT
                       TABLE 89 THALES: PRODUCTS/SOLUTIONS/SERVICES OFFERED
                       TABLE 90 THALES: DEALS
             13.1.2 ECHOSTAR CORPORATION
                       TABLE 91 ECHOSTAR CORPORATION: BUSINESS OVERVIEW
                       FIGURE 48 ECHOSTAR CORPORATION: COMPANY SNAPSHOT
                       TABLE 92 ECHOSTAR CORPORATION: PRODUCTS/SOLUTIONS/SERVICES OFFERED
                       TABLE 93 ECHOSTAR CORPORATION: PRODUCT LAUNCHES
                       TABLE 94 ECHOSTAR CORPORATION: DEALS
                       TABLE 95 ECHOSTAR CORPORATION: CONTRACTS
             13.1.3 QUALCOMM TECHNOLOGIES
                       TABLE 96 QUALCOMM: BUSINESS OVERVIEW
                       FIGURE 49 QUALCOMM: COMPANY SNAPSHOT
                       TABLE 97 QUALCOMM: PRODUCTS/SOLUTIONS/SERVICES OFFERED
                       TABLE 98 QUALCOMM: PRODUCT LAUNCHES
                       TABLE 99 QUALCOMM: DEALS
             13.1.4 MEDIATEK
                       TABLE 100 MEDIATEK: BUSINESS OVERVIEW
                       FIGURE 50 MEDIATEK: COMPANY SNAPSHOT
                       TABLE 101 MEDIATEK: PRODUCTS/SOLUTIONS/SERVICES OFFERED
                       TABLE 102 MEDIATEK: PRODUCT LAUNCHES
                       TABLE 103 MEDIATEK: DEALS
             13.1.5 SPACEX
                       TABLE 104 SPACEX: BUSINESS OVERVIEW
                       TABLE 105 SPACEX: PRODUCTS/SOLUTIONS/SERVICES OFFERED
                       TABLE 106 SPACEX: PRODUCT LAUNCHES
                       TABLE 107 SPACEX: DEALS
             13.1.6 KEYSIGHT TECHNOLOGIES
                       TABLE 108 KEYSIGHT TECHNOLOGIES: BUSINESS OVERVIEW
                       FIGURE 51 KEYSIGHT TECHNOLOGIES: COMPANY SNAPSHOT
                       TABLE 109 KEYSIGHT TECHNOLOGIES: PRODUCTS/SOLUTIONS/SERVICES OFFERED
                       TABLE 110 KEYSIGHT TECHNOLOGIES: PRODUCT LAUNCHES
                       TABLE 111 KEYSIGHT TECHNOLOGIES: DEALS
             13.1.7 GATEHOUSE
                       TABLE 112 GATEHOUSE: BUSINESS OVERVIEW
                       TABLE 113 GATEHOUSE: PRODUCTS/SOLUTIONS/SERVICES OFFERED
                       TABLE 114 GATEHOUSE: DEALS
             13.1.8 SOFTBANK GROUP
                       TABLE 115 SOFTBANK GROUP: BUSINESS OVERVIEW
                       FIGURE 52 SOFTBANK GROUP: COMPANY SNAPSHOT
                       TABLE 116 SOFTBANK GROUP: PRODUCTS/SOLUTIONS/SERVICES OFFERED
                       TABLE 117 SOFTBANK GROUP: PRODUCT LAUNCHES
                       TABLE 118 SOFTBANK GROUP: DEALS
             13.1.9 ROHDE & SCHWARZ
                       TABLE 119 ROHDE & SCHWARZ: BUSINESS OVERVIEW
                       TABLE 120 ROHDE & SCHWARZ: PRODUCTS/SOLUTIONS/SERVICES OFFERED
                       TABLE 121 ROHDE & SCHWARZ: DEALS
             13.1.10 SES
                                   TABLE 122 SES: BUSINESS OVERVIEW
                                   FIGURE 53 SES: COMPANY SNAPSHOT
                                   TABLE 123 SES: PRODUCTS/SOLUTIONS/SERVICES OFFERED
                                   TABLE 124 SES: DEALS
             13.1.11 ZTE
                                   TABLE 125 ZTE: BUSINESS OVERVIEW
                                   FIGURE 54 ZTE: COMPANY SNAPSHOT
                                   TABLE 126 ZTE: PRODUCTS/SOLUTIONS/SERVICES OFFERED
                                   TABLE 127 ZTE: PRODUCT LAUNCHES
                                   TABLE 128 ZTE: DEALS
             13.1.12 VIAVI SOLUTIONS INC.
             13.1.13 TELEFONICA
             13.1.14 VIASAT
             13.1.15 GLOBALSTAR
             13.1.16 SPIRENT COMMUNICATIONS
             13.1.17 ERICSSON
             13.1.18 NOKIA
             13.1.19 RADISYS
             13.1.20 TELESAT
     13.2 STARTUPS/SMES 
             13.2.1 AST SPACEMOBILE
             13.2.2 ONEWEB
             13.2.3 OMNISPACE
             13.2.4 SKYLO
             13.2.5 SPACEIOT
             13.2.6 SATELIOT
             13.2.7 NELCO
             13.2.8 KUIPER SYSTEMS
 
14 ADJACENT/RELATED MARKETS (Page No. - 213)
     14.1 MARITIME SATELLITE COMMUNICATION 
             14.1.1 MARKET OVERVIEW
             14.1.2 MARITIME SATELLITE COMMUNICATION MARKET, BY COMPONENT
                       TABLE 129 MARITIME SATELLITE COMMUNICATION MARKET, BY COMPONENT, 2016–2018 (USD MILLION)
                       TABLE 130 MARITIME SATELLITE COMMUNICATION MARKET, BY COMPONENT, 2019–2025 (USD MILLION)
                       TABLE 131 SOLUTIONS: MARITIME SATELLITE COMMUNICATION MARKET, BY REGION, 2016–2018 (USD MILLION)
                       TABLE 132 SOLUTIONS: MARITIME SATELLITE COMMUNICATION MARKET, BY REGION, 2019–2025 (USD MILLION)
                       TABLE 133 SERVICES: MARITIME SATELLITE COMMUNICATION MARKET, BY REGION, 2016–2018 (USD MILLION)
                       TABLE 134 SERVICES: MARITIME SATELLITE COMMUNICATION MARKET, BY REGION, 2019–2025 (USD MILLION)
             14.1.3 MARITIME SATELLITE COMMUNICATION MARKET, BY SOLUTION
                       TABLE 135 MARITIME SATELLITE COMMUNICATION MARKET, BY SOLUTION, 2016–2018 (USD MILLION)
                       TABLE 136 MARITIME SATELLITE COMMUNICATION MARKET, BY SOLUTION, 2019–2025 (USD MILLION)
                       TABLE 137 VSAT: MARITIME SATELLITE COMMUNICATION MARKET, BY REGION, 2016–2018 (USD MILLION)
                       TABLE 138 VSAT: MARITIME SATELLITE COMMUNICATION MARKET, BY REGION, 2019–2025 (USD MILLION)
             14.1.4 MARITIME SATELLITE COMMUNICATION MARKET, BY SERVICE
                       TABLE 139 MARITIME SATELLITE COMMUNICATION MARKET, BY SERVICE, 2016–2018 (USD MILLION)
                       TABLE 140 MARITIME SATELLITE COMMUNICATION MARKET, BY SERVICE, 2019–2025 (USD MILLION)
             14.1.5 MARITIME SATELLITE COMMUNICATION MARKET, BY END USER
                       TABLE 141 MARITIME SATELLITE COMMUNICATION MARKET, BY END USER, 2016–2018 (USD MILLION)
                       TABLE 142 MARITIME SATELLITE COMMUNICATION MARKET, BY END USER, 2019–2025 (USD MILLION)
     14.2 NANOSATELLITE AND MICROSATELLITE MARKET 
             14.2.1 MARKET DEFINITION
             14.2.2 NANOSATELLITE AND MICROSATELLITE MARKET, BY COMPONENT
                       TABLE 143 NANOSATELLITE AND MICROSATELLITE MARKET, BY COMPONENT, 2017–2021 (USD MILLION)
                       TABLE 144 NANOSATELLITE AND MICROSATELLITE MARKET, BY COMPONENT, 2022–2027 (USD MILLION)
             14.2.3 NANOSATELLITE AND MICROSATELLITE MARKET, BY TYPE
                       TABLE 145 NANOSATELLITE AND MICROSATELLITE MARKET, BY TYPE, 2017–2021 (USD MILLION)
                       TABLE 146 NANOSATELLITE AND MICROSATELLITE MARKET, BY TYPE, 2022–2027 (USD MILLION)
             14.2.4 NANOSATELLITE AND MICROSATELLITE MARKET, BY ORGANIZATION SIZE
                       TABLE 147 NANOSATELLITE AND MICROSATELLITE MARKET, BY ORGANIZATION SIZE, 2017–2021 (USD MILLION)
                       TABLE 148 NANOSATELLITE AND MICROSATELLITE MARKET, BY ORGANIZATION SIZE, 2022–2027 (USD MILLION)
             14.2.5 NANOSATELLITE AND MICROSATELLITE MARKET, BY APPLICATION
                       TABLE 149 NANOSATELLITE AND MICROSATELLITE MARKET, BY APPLICATION, 2017–2021 (USD MILLION)
                       TABLE 150 NANOSATELLITE AND MICROSATELLITE MARKET, BY APPLICATION, 2022–2027 (USD MILLION)
             14.2.6 NANOSATELLITE AND MICROSATELLITE MARKET, BY VERTICAL
                       TABLE 151 NANOSATELLITE AND MICROSATELLITE MARKET, BY VERTICAL, 2017–2021 (USD MILLION)
                       TABLE 152 NANOSATELLITE AND MICROSATELLITE MARKET, BY VERTICAL, 2022–2027 (USD MILLION)
             14.2.7 NANOSATELLITE AND MICROSATELLITE MARKET, BY FREQUENCY
                       TABLE 153 NANOSATELLITE AND MICROSATELLITE MARKET, BY FREQUENCY, 2017–2021 (USD MILLION)
                       TABLE 154 NANOSATELLITE AND MICROSATELLITE MARKET, BY FREQUENCY, 2022–2027 (USD MILLION)
 
15 APPENDIX (Page No. - 225)
     15.1 DISCUSSION GUIDE 
     15.2 KNOWLEDGESTORE: MARKETSANDMARKETS’ SUBSCRIPTION PORTAL 
     15.3 CUSTOMIZATION OPTIONS 
     15.4 RELATED REPORTS 
     15.5 AUTHOR DETAILS 

The study involved four major activities in estimating the current size of the global 5G NTN market. Exhaustive secondary research collected information on the market, peer, and parent markets. The next step was to validate these findings, assumptions, and sizing with industry experts across the value chain through primary research. Both top-down and bottom-up approaches were employed to estimate the total 5G NTN market size. After that, the market breakup and data triangulation techniques were used to estimate the market size of segments and subsegments.

Secondary Research

Various secondary sources, such as Bloomberg and BusinessWeek, were consulted in the secondary research process to identify and collect information for this study. The secondary sources included company annual reports, press releases, investor presentations, white papers, journals, articles from recognized authors, directories, and databases.

Primary Research

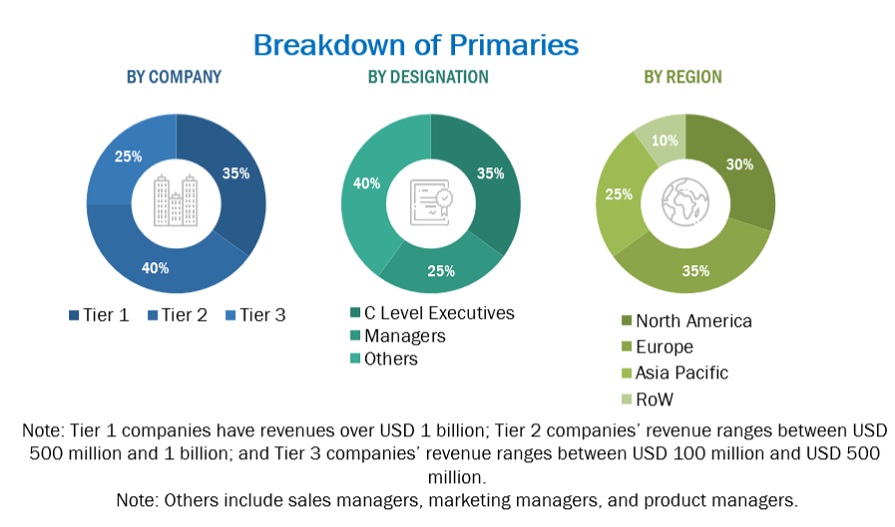
Various primary sources from the supply and demand sides were interviewed to obtain qualitative and quantitative information for this report. The primary sources from the supply side included industry experts, such as Chief Executive Officers (CEOs), Chief Marketing Officers (CMO), Vice Presidents (VPs), Managing Directors (MDs), technology and innovation directors, and related key executives from various key companies and organizations operating in the 5G NTN market along with the associated service providers, and system integrators operating in the targeted regions. All possible parameters that affect the market covered in this research study have been accounted for, viewed in extensive detail, verified through primary research, and analyzed to get the final quantitative and qualitative data. Following is the breakup of primary respondents.
5G NTN Market  Size, and Share

To know about the assumptions considered for the study, download the pdf brochure

Market Size Estimation

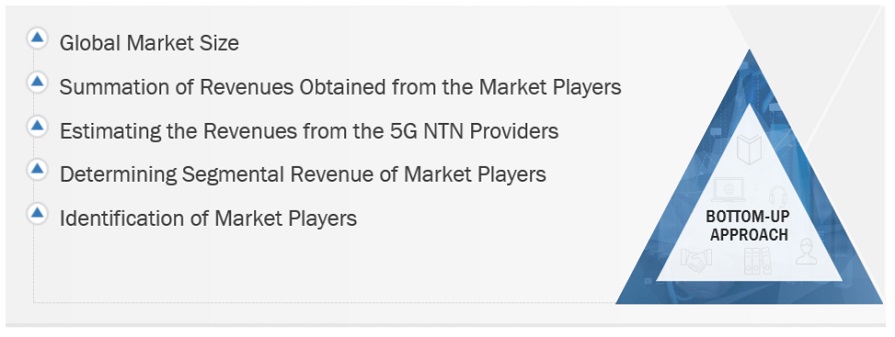
The top-down and bottom-up approaches were used to estimate and forecast the 5G NTN and other dependent submarkets. The bottom-up procedure was used to arrive at the overall market size of the global 5G NTN market using key companies’ revenue and their offerings in the market. The research methodology used to estimate the market size includes the following:

  • Key players in the market have been identified through extensive secondary research.
  • In terms of value, the industry’s supply chain and market size have been determined through primary and secondary research processes.
  • All percentage shares, splits, and breakups have been determined using secondary sources and verified through primary sources.

5G NTN Market Size: Bottom-Up Approach
5G NTN Market  Bottom Up Approach

5G NTN Market Size: Top-Down Approach

5G NTN Market  Top Down Approach

Data Triangulation

After arriving at the overall market size, the 5G NTN market was divided into several segments and subsegments. A data triangulation procedure was used to complete the overall market engineering process and arrive at the exact statistics for all segments and subsegments, wherever applicable. The data was triangulated by studying various factors and trends from the demand and supply sides. Along with data triangulation and market breakdown, the market size was validated by the top-down and bottom-up approaches.

Market Definition

Non-Terrestrial Networks (NTN) can satisfy requests for anywhere and anytime connection by offering wide-area coverage and ensuring service availability, continuity, and scalability. 5G NTN, a 5G non-terrestrial network, expands 5G technology by incorporating satellite communication into its infrastructure. This allows for global connectivity, bridging the gap for remote and underserved areas. 5G NTN leverages a unique combination of satellite constellations, ground-based infrastructure, and advanced protocols, enabling seamless and reliable global communication.

Key Stakeholders

  • Satellite operators
  • Suppliers, distributors, and contractors
  • Mobile operators
  • Business organizations
  • Government organizations
  • System integrators
  • Value-added resellers
  • Vendors of software applications
  • Investors and venture capitalists
  • Government and financial institutions
  • Research institutes and organizations

Report Objectives

  • To determine, segment, and forecast the 5G NTN market by offering, platform, end-use industry, application, and region in terms of value.
  • To forecast the size of the market segments with respect to five main regions: North America, Europe, Asia Pacific, Middle East & Africa, and Latin America
  • To provide detailed information about the major factors (drivers, restraints, opportunities, and challenges) influencing the growth of the 5G NTN market.
  • To study the complete value chain and related industry segments and perform a value chain analysis of the market landscape
  • To strategically analyze the macro and micro-markets with respect to individual growth trends, prospects, and contributions to the total market
  • To analyze the industry trends, pricing data, patents, and innovations related to the market
  • To analyze the opportunities for stakeholders by identifying the high-growth segments of the market
  • To profile the key players in the market and comprehensively analyze their market share/ranking and core competencies
  • To track and analyze competitive developments, such as mergers & acquisitions, product launches & developments, partnerships, agreements, collaborations, business expansions, and R&D activities

Available Customizations

With the given market data, MarketsandMarkets offers customizations per the company’s specific needs

The following customization options are available for the report:

Country-wise information

  • Analysis for additional countries (up to five)

Company Information

  • Detailed analysis and profiling of additional market players (up to 5)
Custom Market Research Services

We will customize the research for you, in case the report listed above does not meet with your exact requirements. Our custom research will comprehensively cover the business information you require to help you arrive at strategic and profitable business decisions.

Request Customization

Instant Answers with GPT - Ask Now!

Ask real questions. Get complete answers !
Report Code
TC 8514
Published ON
Jul, 2024
Choose License Type
BUY NOW
  • SHARE
X
Request Customization
Speak to Analyst
Speak to Analyst
OR FACE-TO-FACE MEETING
PERSONALIZE THIS RESEARCH
  • Triangulate with your Own Data
  • Get Data as per your Format and Definition
  • Gain a Deeper Dive on a Specific Application, Geography, Customer or Competitor
  • Any level of Personalization
REQUEST A FREE CUSTOMIZATION
LET US HELP YOU!
  • What are the Known and Unknown Adjacencies Impacting the 5G NTN Market
  • What will your New Revenue Sources be?
  • Who will be your Top Customer; what will make them switch?
  • Defend your Market Share or Win Competitors
  • Get a Scorecard for Target Partners
CUSTOMIZED WORKSHOP REQUEST
  • Call Us
  • +1-888-600-6441 (Corporate office hours)
  • +1-888-600-6441 (US/Can toll free)
  • +44-800-368-9399 (UK office hours)
CONNECT WITH US
ABOUT TRUST ONLINE
©2024 MarketsandMarkets Research Private Ltd. All rights reserved
DMCA.com Protection Status Website Feedback