AI Studio Market

AI Studio Market by Offering (Software (Type, User Interface, Deployment Mode) and Services), Application (Customer Service Automation, Automatic Content Generation, Sentiment Analysis), Data Modality, Vertical and Region - Global Forecast to 2029

Report Code: TC 9034 May, 2024, by marketsandmarkets.com

[337 Pages Report] The AI Studio market is projected to grow from USD 6.4 billion in 2024 to USD 32.7 billion by 2029, at a compound annual growth rate (CAGR) of 38.4% during the forecast period. Due to various business drivers, the AI Studio market is expected to grow significantly during the forecast period. The growing demand for data democratization is facilitating data-driven business decisions, increasing the need to optimize data science workflows through historical data-driven predictive models, and effortlessly customized pre-built AI solutions are being sought to address distinct organizational pain points and growth prospects.

AI Studio Market

To know about the assumptions considered for the study, Request for Free Sample Report

AI Studio Market Opportunities

To know about the assumptions considered for the study, download the pdf brochure

Market Dynamics

Driver: Increasing demand for data democratization to facilitate data-driven business decisions

The increasing demand for data democratization to facilitate data-driven business decisions is a significant driving factor in the adoption of AI Studio solutions in the market. This demand stems from the necessity for businesses to empower their decision-making processes with data insights accessible to a broader range of users within the organization. By democratizing data, companies can ensure that decision-makers at all levels have access to relevant and timely information, enabling more informed and strategic choices. This trend towards data democratization aligns closely with the capabilities offered by AI Studio solutions, which leverage artificial intelligence to analyze vast amounts of data and generate actionable insights. These solutions enable businesses to extract valuable information from their data, optimize processes, enhance customer experiences, and drive innovation. As organizations seek to harness the power of data to stay competitive and agile in the market, the demand for AI Studio solutions that support data democratization continues to grow.

Data democratization allows employees at all levels to access and interpret data, which traditionally was only available to IT or data science teams. AI Studio solutions offer user-friendly interfaces and no-code or low-code platforms that enable non-technical users to create and deploy machine learning models. According to a report by the US Department of Commerce, empowering employees with data can lead to more informed decision-making and increased innovation within organizations. Therefore, the increasing emphasis on democratizing data to empower data-driven decision-making processes plays a pivotal role in fueling the adoption of AI Studio solutions, as businesses recognize the importance of leveraging data effectively to drive success and growth in today's competitive landscape.

Restraints: Vulnerability to privacy and security breaches

Data privacy and security concerns are major restraints on the adoption of AI Studio solutions. Organizations need to handle vast amounts of sensitive and personal data when using AI technologies. Ensuring compliance with data protection regulations such as the General Data Protection Regulation (GDPR) in the EU and the Health Insurance Portability and Accountability Act (HIPAA) in the US is crucial. Any lapses in data security can lead to breaches, legal penalties, and loss of consumer trust, making organizations wary of adopting AI Studio solutions. According to the Cybersecurity and Infrastructure Security Agency (CISA), data breaches can have severe consequences, including financial losses, reputational damage, and legal liabilities. The agency emphasizes the importance of implementing strong cybersecurity practices, such as encryption, access controls, and regular security assessments, to protect sensitive data from unauthorized access and cyber threats.

Opportunity: The rising need to adopt AI models to elevate the quality of patient care in the medical industry

The rising need to adopt AI models to elevate the quality of patient care in the medical industry is expected to offer huge opportunities for AI Studio solutions in the market significantly. As healthcare organizations increasingly recognize the benefits of integrating AI technologies to enhance patient outcomes and streamline healthcare delivery, the demand for advanced AI solutions like AI Studio is likely to surge. By leveraging AI models to improve decision-making, personalize patient experiences, and optimize healthcare processes, organizations can achieve better clinical outcomes and operational efficiencies.

This growing emphasis on utilizing AI in healthcare to enhance patient care quality aligns with the capabilities offered by AI Studio solutions, making them essential tools for healthcare providers looking to innovate and improve their services. Moreover, AI enables the creation of personalized treatment plans based on a patient’s unique medical history and genetic information. The US Food and Drug Administration (FDA) supports the use of AI in developing personalized medicine, which can revolutionize patient care by tailoring treatments to individual needs. For instance, H2O.ai offers AI and ML solutions that empower organizations in the healthcare sector to address and solve various challenges, such as hospital operations, public health, clinical applications, precision medicine, supply chain management, and more. Their platform supports diverse functions within the pharma industry and enables applications for patient-facing organizations and healthcare payers.

Challenge: Compatibility issues with current systems and workflows

Compatibility issues with current systems and workflows pose a significant challenge in the adoption of AI Studio solutions in the market. When organizations attempt to integrate AI Studio platforms with their existing systems and processes, they often encounter difficulties that can hinder the successful implementation of AI. AI Studio solutions may not seamlessly integrate with legacy systems and workflows, requiring extensive customization and integration work. This can be both costly and time-consuming, deterring organizations from adopting AI Studio solutions. AI Studio platforms often require specific data formats and structures, which may not align with the data stored in existing systems. Ensuring data compatibility and migration can be a significant challenge, especially for organizations with large and complex datasets. To mitigate compatibility issues, organizations should carefully evaluate AI Studio solutions based on their ability to integrate with existing systems, support for common data formats, and flexibility in adapting to current workflows. Furthermore, organizations should prioritize solutions that offer robust documentation, support, and a strong ecosystem of partners and integrations.

AI Studio Market Ecosystem

Top Companies in AI Studio Market

By professional services, the Support & Maintenance segment registered the highest CAGR during the forecast period.

Support and maintenance services play a crucial role in the AI Studio market, ensuring the smooth functioning and optimization of AI-powered models and tools. These services encompass a range of activities aimed at addressing issues, improving performance, and enhancing user experience. Support services in AI Studio involve aiding users and clients in resolving technical issues, troubleshooting problems, and answering queries. This includes offering timely responses to inquiries, guiding users through troubleshooting steps, and resolving issues related to bot functionality, integration, or performance. Effective support services contribute significantly to customer satisfaction and retention by ensuring that users receive prompt and reliable assistance when needed.

By vertical, Healthcare & Life Sciences segment to register the highest CAGR during the forecast period.

The AI Studio market is experiencing exponential growth within the healthcare and life sciences industry, revolutionizing patient care and administrative processes alike. AI Studio technologies offer unparalleled convenience and accessibility, enabling patients to interact with healthcare providers and access medical information seamlessly through natural language interfaces like chatbots and virtual assistants. AI Studio solutions are increasingly adept at understanding medical terminology and interpreting complex queries, thereby facilitating accurate diagnosis, personalized treatment recommendations, and even remote monitoring of patient's health conditions.

By application, Customer Service Automation to register the largest market size during the forecast period.

The market for internal enterprise systems within the AI Studio sector is experiencing significant growth driven by several key factors. Businesses are increasingly recognizing the value of leveraging AI Studio technologies to streamline internal processes and improve operational efficiency. These systems offer a user-friendly interface that allows employees to interact with enterprise applications more intuitively, leading to faster task completion and reduced workload on IT departments. Additionally, the rise of remote work has highlighted the importance of effective communication and collaboration tools, and AI Studio platforms can facilitate seamless interactions among distributed teams.

By region,  North America to witness the largest & fastest market size during the forecast period.

The AI Studio market in North America is experiencing rapid growth, driven by several key factors. Rapid adoption of AI technologies across various industries in the U.S., including healthcare, retail, IT & telecom, BFSI, automotive, advertising & media, and manufacturing, is a significant driver for the AI Studio market. The healthcare and retail sectors, in particular, have dominated the market share, showcasing the widespread integration of AI solutions in these industries. The presence of industry giants like Amazon, IBM, Microsoft, Google, and Intel is a significant catalyst for the North American AI market. These behemoths are making substantial investments in AI research, development, and integration into their product portfolios, setting the pace for technological advancement.

North American AI Studio Market Size, and Share

Key Market Players

The AI Studio solution and service providers have implemented various types of organic and inorganic growth strategies, such as product upgrades, new product launches, partnerships, and agreements, business expansions, and mergers and acquisitions to strengthen their offerings in the market. Some major players in the AI Studio market include Microsoft (US), IBM (US), Google (US), AWS (US), Vonage (US), Sprinklr (US), Blaize (US), DataRobot (US),  Altair (US), C3 AI (US), HP (US), SparkCognition (US), Icertis (US), Intel (US), DeepBrain AI (US),  AgileEngine (US), Expert.ai (Italy), Ushur (US), Avenue Code (US), Qubika (US), Anthropic (US), Evolve IP (US), Databricks (US), Brillio (US), Appy Pie (US), Conju (Canada), Bricabrac AI (US), Donakosy (UK), Bappfy AI (France), DeepOpinion (Austria), Orkes (US), and Branchbob AI (Germany).

Get online access to the report on the World's First Market Intelligence Cloud

  • Easy to Download Historical Data & Forecast Numbers
  • Company Analysis Dashboard for high growth potential opportunities
  • Research Analyst Access for customization & queries
  • Competitor Analysis with Interactive dashboard
  • Latest News, Updates & Trend analysis
Request Sample

Scope of the Report

Report Metrics

Details

Market size available for years

2019–2029

Base year considered

2023

Forecast period

2024–2029

Forecast units

USD (Billion)

Segments Covered

Offering, Data Modality, Application, Vertical, and Region

Geographies covered

North America, Asia Pacific, Europe, Middle East & Africa, and Latin America

Companies covered

Microsoft (US), IBM (US), Google (US), AWS (US), Vonage (US), Sprinklr (US), Blaize (US), DataRobot (US),  Altair (US), C3 AI (US), HP (US), SparkCognition (US), Icertis (US), Intel (US), DeepBrain AI (US),  AgileEngine (US), Expert.ai (Italy), Ushur (US), Avenue Code (US), Qubika (US), Anthropic (US), Evolve IP (US), Databricks (US), Brillio (US), Appy Pie (US), Conju (Canada), Bricabrac AI (US), Donakosy (UK), Bappfy AI (France), DeepOpinion (Austria), Orkes (US), and Branchbob AI (Germany).

This research report categorizes the AI Studio market based on offering, data modality, application,  vertical, and region.

By Offering:
  • Software by Type
    • Application Development Platforms
      • MLOPs
      • DataOPs
      • DevOps
      • Chatbot Development
      • LLM Development
    • AI Model Management
      • Training & Deployment Tools
      • Interpretablity & Explainability tools
      • Monitoring Software
      • Optimization & HyperParameter Tuning tools
      • Versioning & Automation Software
      • Performance Evaluation & Benchmarking Tools
      • Governance & Compliance Software
    • Data Annotation and Labeling
      • AutoML
      • AI Experimentation and Collaboration Platforms
      • Reporting and Analytics Tools
  • Software by Deployment Mode
    • Cloud
    • On-Premises
  • Services
    • Professional Services
    • Consulting & Advisory
    • Integration & Deployment
    • Support & Maintenance
    • Training & Education
    • Managed Services
  • Software by User Interface
    • Web-based
    • Mobile Based
By Application:
  • Sentiment Analysis
  • Customer Service Automation
  • Image Classification and Labelling
  • Synthetic Data Generation
  • Predictive Modelling and Forecasting
  • Automatic Content Generation
  • Others (Demand and Sales Prediction, Customer Engagement, Anomaly Detection, and Account Management)
By Vertical:
  • BFSI
    • Fraud Detection and Prevention
    • Risk Assessment and Management
    • Algorithmic Trading
    • Credit Scoring and Underwriting
    • Personalized Financial Recommendations
    • Investment Portfolio Management
    • Regulatory Compliance Monitoring
    • Others (Anti-Money Laundering, Insurance Fraud Investigation and Detection)
  • Retail & eCommerce
    • Personalized Product Recommendation
    • Customer Relationship Management
    • Visual Search
    • Virtual Customer Assistant
    • Price Optimization
    • Supply Chain Management & Demand Planning
    • Virtual Stores
    • Others ( Customer Churn Prediction And Retention Strategies)
  • Telecom
    • Network Optimization
    • Network Security
    • Network Planning And Optimization
    • Network Analytics
    • Intelligent Call Routing
    • Network Fault Prediction
    • Virtual Network Assistants
    • Others (Autonomous Billing And Payment Processing, Revenue Assurance)
  • Manufacturing
    • Material Movement Management
    • Predictive Maintenance And Machinery Inspection
    • Production Planning
    • Recyclable Material Reclamation
    • Quality Control
    • Production Line Optimization
    • Intelligent Inventory Management
    • Others ( Product Design And Prototyping Optimization) 
  • Healthcare & Life Sciences
    • Patient Data And Risk Analysis
    • Lifestyle Management And Monitoring
    • Precision Medicine
    • Inpatient Care And Hospital Management
    • Medical Imaging And Diagnostics
    • Drug Discovery
    • Robotic Surgery And Assistance
    • Medical Research
    • Others (Patient Data Privacy And Security)
  • Media & Entertainment
    • Content Recommendation Systems
    • Content Creation And Generation
    • Content Copyright Protection
    • Audience Analytics And Segmentation
    • Personalized Advertising
    • Others (Campaign Management, Audience Sentiment Analysis)
  • IT and ITeS
    • Automated Code Generation And Optimization
    • Automated It Asset Management
    • IT Ticketing And Support Automation
    • Intelligent Data Backup And Recovery
    • Automated Software Testing And Quality Assurance
    • Others (Intelligent IT Infrastructure Management)
  • Government & Defense
    • Surveillance And Situational Awareness
    • Law Enforcement
    • Intelligence Analysis And Data Processing
    • Simulation And Training
    • Command And Control
    • Disaster Response And Recovery Assistance
    • Egovernance And Digital City Services
    • Others (Cybersecurity And Threat Detection)
  • Automotive & Transportation
    • Semi-Autonomous And Autonomous Vehicles
    • Route Optimization
    • Intelligent Traffic Management
    • Driver Assistance Systems
    • Smart Logistics And Warehousing
    • Supply Chain Visibility And Tracking
    • Fleet Management
    • Vehicle Diagnostics And Telematics
    • Others (Intelligent Parking Systems And Traffic Pattern Analysis)
  • Other Applications (Construction, Education, Energy & Utilities, and Travel & Hospitality)
By Region:
  • North America
    • US
    • Canada
  • Europe
    • UK
    • Germany
    • France
    • Italy
    • Spain
    • Rest of Europe
  • Asia Pacific
    • China
    • Japan
    • India
    • South Korea
    • Australia and New Zealand (ANZ)
    • ASEAN Countries
    • Rest of Asia Pacific
  • Middle East & Africa
    • UAE
    • Saudi Arabia
    • South Africa
    • Turkey
    • Qatar
    • Rest of the Middle East & Africa
  • Latin America
    • Brazil
    • Mexico
    • Argentina
    • Rest of Latin America

Recent Developments:

  • In April 2024, Microsoft and The Coca-Cola Company unveiled a five-year strategic partnership to revolutionize technology adoption and innovation globally. Coca-Cola committed USD 1.1 billion to leverage Microsoft Cloud and generative AI capabilities, focusing on Azure OpenAI Service for transformative AI applications. This collaboration aims to enhance productivity and efficiency by partnership signifies Coca-Cola's digital transformation journey, migrating applications to Microsoft Azure and pioneering generative AI solutions.exploring cutting-edge technologies like Copilot for Microsoft 365. The In February 2024, Wipro and IBM came in partnership to offer the Wipro Enterprise AI-Ready Platform, which leverages IBM's Watsonx capabilities. This platform enables enterprises to build fully integrated, customized AI environments. The collaboration combines Wipro's industry expertise with IBM's AI innovation, aiming to accelerate AI adoption and deliver reliable, enterprise-ready AI solutions. Key features include infrastructure for AI and generative AI, dynamic resource management, and support for industry-specific use cases across different sectors.
  • In April 2024, the enhancement of Google’s flagship Gemini 1.5 Pro model, Google's most sophisticated multimodal AI, is accessible through Vertex AI, empowering developers to tailor and deploy Gemini-powered solutions. Google also introduced new Gemini-based AI assistants designed to enhance productivity and user experiences across various business domains, from cloud infrastructure management to application development.
  • In January 2024, IBM and SAP announced a collaboration to develop new AI solutions for the consumer-packaged goods (CPG) and retail industries. The solutions will leverage IBM's AI capabilities, including Watson, to enhance supply chain, finance operations, sales, and services for SAP's clients in these sectors. The partnership aims to help organizations in the CPG and retail industries optimize their operations and decision-making using advanced AI technologies. This collaboration builds on the long-standing 50-year partnership between IBM and SAP, further strengthening their joint offerings for enterprises.
  • In October 2023, IBM launched Watsonx Code Assistant, a generative AI-powered tool designed to assist enterprise developers and IT operators in coding more efficiently and accurately. This tool leverages generative AI based on IBM's Granite foundation models for code, enhancing the development process by providing AI-generated code recommendations and facilitating a seamless coding experience. The watsonx Code Assistant aims to drive enterprise application modernization by enabling faster translation of COBOL to Java and supporting automated test-case generation to validate new code implementations

Frequently Asked Questions (FAQ):

To speak to our analyst for a discussion on the above findings, click Speak to Analyst

TABLE OF CONTENTS
 
1 INTRODUCTION (Page No. - 30)
    1.1 STUDY OBJECTIVES 
    1.2 MARKET DEFINITION 
           1.2.1 INCLUSIONS & EXCLUSIONS
    1.3 STUDY SCOPE 
           1.3.1 MARKET SEGMENTATION
    1.4 YEARS CONSIDERED 
    1.5 CURRENCY CONSIDERED 
           TABLE 1 USD EXCHANGE RATES, 2019–2023
    1.6 STAKEHOLDERS 
 
2 RESEARCH METHODOLOGY (Page No. - 35)
    2.1 RESEARCH DATA 
           FIGURE 1 AI STUDIO MARKET: RESEARCH DESIGN
           2.1.1 SECONDARY DATA
           2.1.2 PRIMARY DATA
                    TABLE 2 PRIMARY INTERVIEWS
                    2.1.2.1 Breakup of primary profiles
                    2.1.2.2 Key industry insights
    2.2 DATA TRIANGULATION 
           FIGURE 2 DATA TRIANGULATION
    2.3 MARKET SIZE ESTIMATION 
           FIGURE 3 AI STUDIO MARKET: TOP-DOWN AND BOTTOM-UP APPROACHES
           2.3.1 TOP-DOWN APPROACH
           2.3.2 BOTTOM-UP APPROACH
                    FIGURE 4 APPROACH 1, BOTTOM-UP (SUPPLY SIDE): REVENUE FROM SOFTWARE/SERVICES OF AI STUDIO MARKET
                    FIGURE 5 APPROACH 2, BOTTOM-UP (SUPPLY-SIDE): COLLECTIVE REVENUE FROM ALL SOFTWARE/SERVICES OF AI STUDIO MARKET
                    FIGURE 6 APPROACH 3, BOTTOM-UP (SUPPLY-SIDE): COLLECTIVE REVENUE FROM ALL SOFTWARE/SERVICES OF AI STUDIO MARKET
                    FIGURE 7 APPROACH 4, BOTTOM-UP (DEMAND SIDE): SHARE OF AI STUDIO THROUGH OVERALL DIGITAL SOLUTIONS SPENDING
    2.4 MARKET FORECAST 
           TABLE 3 FACTOR ANALYSIS
    2.5 RESEARCH ASSUMPTIONS 
    2.6 RISK ASSESSMENT 
    2.7 STUDY LIMITATIONS 
    2.8 IMPLICATIONS OF RECESSION ON AI STUDIO MARKET 
           TABLE 4 IMPACT OF RECESSION ON GLOBAL AI STUDIO MARKET
 
3 EXECUTIVE SUMMARY (Page No. - 49)
    TABLE 5 AI STUDIO MARKET SIZE AND GROWTH RATE, 2019–2023 (USD MILLION, Y-O-Y) 
    TABLE 6 AI STUDIO MARKET SIZE AND GROWTH RATE, 2024–2029 (USD MILLION, Y-O-Y) 
    FIGURE 8 AI STUDIO SOFTWARE SEGMENT TO DOMINATE MARKET IN 2024 
    FIGURE 9 APPLICATION DEVELOPMENT PLATFORMS SEGMENT TO LEAD MARKET IN 2024 
    FIGURE 10 CLOUD SEGMENT TO ACCOUNT FOR LARGER SHARE IN 2024 
    FIGURE 11 WEB-BASED SEGMENT TO DOMINATE MARKET IN 2024 
    FIGURE 12 PROFESSIONAL SERVICES SEGMENT TO LEAD MARKET IN 2024 
    FIGURE 13 INTEGRATION & DEPLOYMENT SEGMENT TO ACCOUNT FOR LARGEST SHARE IN 2024 
    FIGURE 14 SPEECH AND LANGUAGE TO BE KEY MODALITIES IN AI STUDIO MARKET IN 2024 
    FIGURE 15 CUSTOMER SERVICE AUTOMATION TO BE LARGEST APPLICATION IN 2024 
    FIGURE 16 BFSI VERTICAL TO BE LUCRATIVE MARKET FOR INVESTMENT IN 2024 
    FIGURE 17 ASIA PACIFIC TO GROW AT HIGHEST CAGR DURING FORECAST PERIOD 
 
4 PREMIUM INSIGHTS (Page No. - 56)
    4.1 ATTRACTIVE OPPORTUNITIES FOR AI STUDIO MARKET PLAYERS 
           FIGURE 18 INCREASING DEMAND FOR DATA DEMOCRATIZATION TO FACILITATE DATA-DRIVEN BUSINESS DECISIONS TO FUEL MARKET GROWTH
    4.2 AI STUDIO MARKET: TOP THREE APPLICATIONS 
           FIGURE 19 AUTOMATIC CONTENT GENERATION APPLICATION TO GROW AT HIGHEST CAGR DURING FORECAST PERIOD
    4.3 NORTH AMERICA: AI STUDIO MARKET, BY OFFERING AND SERVICE 
           FIGURE 20 SOFTWARE AND PROFESSIONAL SERVICES SEGMENTS TO ACCOUNT FOR SIGNIFICANT SHARE IN 2024
    4.4 AI STUDIO MARKET, BY REGION 
           FIGURE 21 NORTH AMERICA TO BE LARGEST MARKET IN 2024
 
5 MARKET OVERVIEW AND INDUSTRY TRENDS (Page No. - 58)
    5.1 INTRODUCTION 
    5.2 MARKET DYNAMICS 
           FIGURE 22 AI STUDIO MARKET: DRIVERS, RESTRAINTS, OPPORTUNITIES, AND CHALLENGES
           5.2.1 DRIVERS
                    5.2.1.1 Increase in demand for data democratization to facilitate data-driven business decisions
                    5.2.1.2 Rise in need to optimize data science workflows through historical data-driven predictive models
                    5.2.1.3 Need for customizing pre-built AI solutions to tackle distinct organizational pain points and growth prospects
           5.2.2 RESTRAINTS
                    5.2.2.1 High implementation costs
                    5.2.2.2 Vulnerability to privacy and security breaches
           5.2.3 OPPORTUNITIES
                    5.2.3.1 Demand for AI models to elevate quality of patient care in medical industry
                    5.2.3.2 Increase in demand for AI-powered predictive analytics
           5.2.4 CHALLENGES
                    5.2.4.1 Potential vendor lock-in
                    5.2.4.2 Compatibility issues with current systems and workflows
                    5.2.4.3 Lack of advanced data visualization capabilities
    5.3 EVOLUTION OF AI STUDIO MARKET 
           FIGURE 23 AI STUDIO MARKET: EVOLUTION
    5.4 AI STUDIO MARKET ARCHITECTURE 
           FIGURE 24 AI STUDIO MARKET: ARCHITECTURE
    5.5 SUPPLY CHAIN ANALYSIS 
           FIGURE 25 AI STUDIO MARKET: SUPPLY CHAIN ANALYSIS
    5.6 ECOSYSTEM ANALYSIS 
           TABLE 7 AI STUDIO MARKET ECOSYSTEM
           FIGURE 26 KEY PLAYERS IN AI STUDIO MARKET ECOSYSTEM
           5.6.1 AI STUDIO MARKET: PLATFORM AND SERVICE PROVIDERS
           5.6.2 AI STUDIO MARKET: PLATFORM PROVIDERS
           5.6.3 AI STUDIO MARKET: SERVICE PROVIDERS
           5.6.4 AI STUDIO MARKET: END USERS
           5.6.5 AI STUDIO MARKET: REGULATORY BODIES
    5.7 CASE STUDY ANALYSIS 
           5.7.1 EDGER FINANCE COLLABORATED WITH IBM CLIENT ENGINEERING AND IBM INNOVATION STUDIO TO ENHANCE EFFICIENCY AND STRENGTHEN PROCESSES AND PLATFORMS
           5.7.2 AI21 LABS ACCELERATED GENERATIVE AI MODEL ADOPTION USING AMAZON SAGEMAKER
           5.7.3 RONLIGHT LEVERAGED VONAGE AI TO ENHANCE SERVICE DELIVERY
           5.7.4 CNVRG.IO HELPED SEAGATE TECHNOLOGY TRANSFORM ITS LEGACY AI WORKFLOW INTO SCALABLE, MODERN, AND AUTOMATED PIPELINE
           5.7.5 KRONES PARTNERED WITH ICERTIS FOR DIGITAL CONTRACT MANAGEMENT TRANSFORMATION
    5.8 TECHNOLOGY ANALYSIS 
           5.8.1 KEY TECHNOLOGIES
                    5.8.1.1 NLP
                    5.8.1.2 Speech Recognition
                    5.8.1.3 Text-to-Speech (TTS)
           5.8.2 COMPLEMENTARY TECHNOLOGIES
                    5.8.2.1 Big Data and Analytics
                    5.8.2.2 Cloud Computing
           5.8.3 ADJACENT TECHNOLOGIES
                    5.8.3.1 AR & VR
                    5.8.3.2 IoT
                    5.8.3.3 Blockchain
    5.9 KEY CONFERENCES & EVENTS 
           TABLE 8 AI STUDIO MARKET: DETAILED LIST OF CONFERENCES & EVENTS, 2024–2025
    5.10 REGULATORY LANDSCAPE 
           5.10.1 REGULATORY BODIES, GOVERNMENT AGENCIES, AND OTHER ORGANIZATIONS
                    TABLE 9 NORTH AMERICA: LIST OF REGULATORY BODIES, GOVERNMENT AGENCIES, AND OTHER ORGANIZATIONS
                    TABLE 10 EUROPE: LIST OF REGULATORY BODIES, GOVERNMENT AGENCIES, AND OTHER ORGANIZATIONS
                    TABLE 11 ASIA PACIFIC: LIST OF REGULATORY BODIES, GOVERNMENT AGENCIES, AND OTHER ORGANIZATIONS
                    TABLE 12 MIDDLE EAST & AFRICA: LIST OF REGULATORY BODIES, GOVERNMENT AGENCIES, AND OTHER ORGANIZATIONS
                    TABLE 13 LATIN AMERICA: LIST OF REGULATORY BODIES, GOVERNMENT AGENCIES, AND OTHER ORGANIZATIONS
           5.10.2 REGULATIONS
                    5.10.2.1 North America
                               5.10.2.1.1 National Artificial Intelligence Initiative Act (NAIIA)
                               5.10.2.1.2 Artificial Intelligence and Data Act (AIDA) - Canada
                               5.10.2.1.3 California Consumer Privacy Act (CCPA)
                               5.10.2.1.4 Health Insurance Portability and Accountability Act (HIPAA)
                    5.10.2.2 Europe
                               5.10.2.2.1 General Data Protection Regulation (GDPR)
                               5.10.2.2.2 Audiovisual Media Services Directive (AVMSD)
                               5.10.2.2.3 ePrivacy directive
                    5.10.2.3 Asia Pacific
                               5.10.2.3.1 Personal Information Protection Law (PIPL)
                               5.10.2.3.2 Act on the Protection of Personal Information (APPI)
                    5.10.2.4 Middle East & Africa
                               5.10.2.4.1 Consumer protection regulations
                               5.10.2.4.2 UAE Artificial Intelligence Strategy 2031
                    5.10.2.5 Latin America
                               5.10.2.5.1 Protection of Personal Information Act (POPIA)
                               5.10.2.5.2 Federal Law on Protection of Personal Data Held by Private Parties (LFPDPPP)
    5.11 PATENT ANALYSIS 
           5.11.1 METHODOLOGY
           5.11.2 PATENTS FILED, BY DOCUMENT TYPE
                    TABLE 14 PATENTS FILED, 2013–2023
           5.11.3 INNOVATION AND PATENT APPLICATIONS
                    FIGURE 27 TOTAL NUMBER OF PATENTS GRANTED, 2013–2023
                    5.11.3.1 Top 10 patent applicants in AI Studio market
                               FIGURE 28 TOP 10 APPLICANTS IN AI STUDIO MARKET, 2013–2023
                               TABLE 15 TOP 15 PATENT OWNERS IN AI STUDIO MARKET, 2013–2023
                               TABLE 16 LIST OF PATENTS GRANTED IN AI STUDIO MARKET, 2022–2023
                               FIGURE 29 REGIONAL ANALYSIS OF PATENTS GRANTED, 2013–2023
    5.12 PRICING ANALYSIS 
           5.12.1 AVERAGE SELLING PRICE TREND OF KEY PLAYERS FOR TOP THREE APPLICATIONS
                    FIGURE 30 AVERAGE SELLING PRICE TREND OF KEY PLAYERS FOR TOP THREE APPLICATIONS (USD/MONTH)
                    TABLE 17 AVERAGE SELLING PRICE TREND OF KEY PLAYERS FOR TOP THREE APPLICATIONS (USD/YEAR)
           5.12.2 INDICATIVE PRICING ANALYSIS, BY APPLICATION
                    TABLE 18 INDICATIVE PRICING LEVELS OF AI STUDIO SOFTWARE, BY APPLICATION
    5.13 PORTER’S FIVE FORCES ANALYSIS 
                    TABLE 19 PORTER’S FIVE FORCES’ IMPACT ON AI STUDIO MARKET
                    FIGURE 31 AI STUDIO MARKET: PORTER’S FIVE FORCES ANALYSIS
           5.13.1 THREAT OF NEW ENTRANTS
           5.13.2 THREAT OF SUBSTITUTES
           5.13.3 BARGAINING POWER OF SUPPLIERS
           5.13.4 BARGAINING POWER OF BUYERS
           5.13.5 INTENSITY OF COMPETITIVE RIVALRY
    5.14 INVESTMENT LANDSCAPE AND FUNDING SCENARIO 
                    FIGURE 32 INVESTMENT LANDSCAPE AND FUNDING SCENARIO, BY NUMBER OF FUNDING ROUNDS AND TOTAL FUNDING VALUE
    5.15 AI STUDIO MARKET: BUSINESS MODELS 
           5.15.1 SUBSCRIPTION-BASED MODELS
           5.15.2 PAY-PER-USE MODEL
           5.15.3 LICENSING AND PERPETUAL SOFTWARE MODEL
           5.15.4 CUSTOM DEVELOPMENT AND CONSULTATION MODEL
           5.15.5 TRANSACTIONAL MODEL
           5.15.6 PARTNERSHIP AND REVENUE-SHARING MODEL
    5.16 TRENDS/DISRUPTIONS IMPACTING CUSTOMERS’ BUSINESSES 
                    FIGURE 33 TRENDS/DISRUPTIONS IMPACTING CUSTOMERS’ BUSINESSES
    5.17 KEY STAKEHOLDERS & BUYING CRITERIA 
           5.17.1 KEY STAKEHOLDERS IN BUYING PROCESS
                    FIGURE 34 INFLUENCE OF STAKEHOLDERS ON BUYING PROCESS FOR TOP THREE APPLICATIONS
                    TABLE 20 INFLUENCE OF STAKEHOLDERS ON BUYING PROCESS FOR TOP THREE VERTICALS
           5.17.2 BUYING CRITERIA
                    FIGURE 35 KEY BUYING CRITERIA FOR TOP THREE APPLICATIONS
                    TABLE 21 KEY BUYING CRITERIA FOR TOP THREE APPLICATIONS
 
6 AI STUDIO MARKET, BY OFFERING (Page No. - 103)
    6.1 INTRODUCTION 
           6.1.1 OFFERINGS: AI STUDIO MARKET DRIVERS
                    FIGURE 36 SERVICES SEGMENT TO GROW AT HIGHER CAGR DURING FORECAST PERIOD
                    TABLE 22 AI STUDIO MARKET, BY OFFERING, 2019–2023 (USD MILLION)
                    TABLE 23 AI STUDIO MARKET, BY OFFERING, 2024–2029 (USD MILLION)
    6.2 SOFTWARE, BY TYPE 
           FIGURE 37 DATA ANNOTATION & LABELING SEGMENT TO GROW AT HIGHEST CAGR DURING FORECAST PERIOD
           TABLE 24 AI STUDIO SOFTWARE MARKET, BY TYPE, 2019–2023 (USD MILLION)
           TABLE 25 AI STUDIO SOFTWARE MARKET, BY TYPE, 2024–2029 (USD MILLION)
           6.2.1 APPLICATION DEVELOPMENT PLATFORMS
                    6.2.1.1 Application development platforms help maintain comprehensive documentation and reproducibility of AI models and applications
                               TABLE 26 APPLICATION DEVELOPMENT PLATFORMS: AI STUDIO SOFTWARE MARKET, BY REGION, 2019–2023 (USD MILLION)
                               TABLE 27 APPLICATION DEVELOPMENT PLATFORMS: AI STUDIO SOFTWARE MARKET, BY REGION, 2024–2029 (USD MILLION)
                    6.2.1.2 MLOps
                    6.2.1.3 DataOps
                    6.2.1.4 DevOps
                    6.2.1.5 Chatbot development
                    6.2.1.6 LLM development
           6.2.2 AI MODEL MANAGEMENT
                    6.2.2.1 AI model management facilitates collaboration and integration while ensuring compliance with regulatory requirements
                               TABLE 28 AI MODEL MANAGEMENT: AI STUDIO SOFTWARE MARKET, BY REGION, 2019–2023 (USD MILLION)
                               TABLE 29 AI MODEL MANAGEMENT: AI STUDIO SOFTWARE MARKET, BY REGION, 2024–2029 (USD MILLION)
                    6.2.2.2 Training & deployment tools
                    6.2.2.3 Interpretability & explainability tools
                    6.2.2.4 Monitoring software
                    6.2.2.5 Optimization & hyperparameter tuning tools
                    6.2.2.6 Versioning & automation software
                    6.2.2.7 Performance evaluation & benchmarking tools
                    6.2.2.8 Governance & compliance tools
           6.2.3 DATA ANNOTATION & LABELING
                    6.2.3.1 Data annotation & labeling tools provide foundation for training accurate and effective machine learning models
                               TABLE 30 DATA ANNOTATION & LABELING: AI STUDIO SOFTWARE MARKET, BY REGION, 2019–2023 (USD MILLION)
                               TABLE 31 DATA ANNOTATION & LABELING: AI STUDIO SOFTWARE MARKET, BY REGION, 2024–2029 (USD MILLION)
           6.2.4 AUTOML
                    6.2.4.1 AutoML tools simplify model development process for users with varying levels of expertise
                               TABLE 32 AUTOML: AI STUDIO SOFTWARE MARKET, BY REGION, 2019–2023 (USD MILLION)
                               TABLE 33 AUTOML: AI STUDIO SOFTWARE MARKET, BY REGION, 2024–2029 (USD MILLION)
           6.2.5 AI EXPERIMENTATION & COLLABORATION PLATFORMS
                    6.2.5.1 AI experimentation & collaboration platforms help organizations develop robust and effective AI solutions
                               TABLE 34 AI EXPERIMENTATION & COLLABORATION PLATFORMS: AI STUDIO SOFTWARE MARKET, BY REGION, 2019–2023 (USD MILLION)
                               TABLE 35 AI EXPERIMENTATION & COLLABORATION PLATFORMS: AI STUDIO SOFTWARE MARKET, BY REGION, 2024–2029 (USD MILLION)
           6.2.6 REPORTING & ANALYTICS TOOLS
                    6.2.6.1 Need for developing robust and effective AI solutions by enhancing collaboration and experimentation to drive segment growth
                               TABLE 36 REPORTING & ANALYTICS TOOLS: AI STUDIO SOFTWARE MARKET, BY REGION, 2019–2023 (USD MILLION)
                               TABLE 37 REPORTING & ANALYTICS TOOLS: AI STUDIO SOFTWARE MARKET, BY REGION, 2024–2029 (USD MILLION)
    6.3 SOFTWARE, BY USER INTERFACE 
           FIGURE 38 MOBILE-BASED SEGMENT TO GROW AT HIGHER CAGR DURING FORECAST PERIOD
           TABLE 38 AI STUDIO SOFTWARE MARKET, BY USER INTERFACE, 2019–2023 (USD MILLION)
           TABLE 39 AI STUDIO SOFTWARE MARKET, BY USER INTERFACE, 2024–2029 (USD MILLION)
           6.3.1 WEB-BASED
                    6.3.1.1 Web-based AI Studio software facilitates real-time collaboration among team members
                               TABLE 40 WEB-BASED: AI STUDIO SOFTWARE MARKET, BY REGION, 2019–2023 (USD MILLION)
                               TABLE 41 WEB-BASED: AI STUDIO SOFTWARE MARKET, BY REGION, 2024–2029 (USD MILLION)
           6.3.2 MOBILE-BASED
                    6.3.2.1 Mobile-based AI Studio software helps users manage and interact with AI models
                               TABLE 42 MOBILE-BASED: AI STUDIO SOFTWARE MARKET, BY REGION, 2019–2023 (USD MILLION)
                               TABLE 43 MOBILE-BASED: AI STUDIO SOFTWARE MARKET, BY REGION, 2024–2029 (USD MILLION)
    6.4 SOFTWARE, BY DEPLOYMENT MODE 
           FIGURE 39 ON-PREMISES SEGMENT TO GROW AT HIGHER CAGR DURING FORECAST PERIOD
           TABLE 44 AI STUDIO SOFTWARE MARKET, BY DEPLOYMENT MODE, 2019–2023 (USD MILLION)
           TABLE 45 AI STUDIO SOFTWARE MARKET, BY DEPLOYMENT MODE, 2024–2029 (USD MILLION)
           6.4.1 ON-PREMISES
                    6.4.1.1 Need for enterprises to seek maximum control, security, and compliance over AI Studio deployments to boost growth
                               TABLE 46 ON-PREMISES: AI STUDIO SOFTWARE MARKET, BY REGION, 2019–2023 (USD MILLION)
                               TABLE 47 ON-PREMISES: AI STUDIO SOFTWARE MARKET, BY REGION, 2024–2029 (USD MILLION)
           6.4.2 CLOUD
                    6.4.2.1 Need for scalability, flexibility, and cost-effectiveness to fuel demand for cloud deployment of AI Studio solutions
                               TABLE 48 CLOUD: AI STUDIO SOFTWARE MARKET, BY REGION, 2019–2023 (USD MILLION)
                               TABLE 49 CLOUD: AI STUDIO SOFTWARE MARKET, BY REGION, 2024–2029 (USD MILLION)
    6.5 SERVICES 
           FIGURE 40 MANAGED SERVICES SEGMENT TO GROW AT HIGHER CAGR DURING FORECAST PERIOD
           TABLE 50 AI STUDIO MARKET, BY SERVICE, 2019–2023 (USD MILLION)
           TABLE 51 AI STUDIO MARKET, BY SERVICE, 2024–2029 (USD MILLION)
           TABLE 52 SERVICES: AI STUDIO MARKET, BY REGION, 2019–2023 (USD MILLION)
           TABLE 53 SERVICES: AI STUDIO MARKET, BY REGION, 2024–2029 (USD MILLION)
           6.5.1 PROFESSIONAL SERVICES
                    FIGURE 41 SUPPORT & MAINTENANCE SERVICES SEGMENT TO GROW AT HIGHEST CAGR DURING FORECAST PERIOD
                    TABLE 54 AI STUDIO MARKET, BY PROFESSIONAL SERVICE, 2019–2023 (USD MILLION)
                    TABLE 55 AI STUDIO MARKET, BY PROFESSIONAL SERVICE, 2024–2029 (USD MILLION)
                    TABLE 56 PROFESSIONAL SERVICES: AI STUDIO MARKET, BY REGION, 2019–2023 (USD MILLION)
                    TABLE 57 PROFESSIONAL SERVICES: AI STUDIO MARKET, BY REGION, 2024–2029 (USD MILLION)
           6.5.2 CONSULTING & ADVISORY SERVICES
                    6.5.2.1 Increasing demand for personalized customer experiences and efficient business operations to spur market growth
                               TABLE 58 CONSULTING & ADVISORY SERVICES: AI STUDIO MARKET, BY REGION, 2019–2023 (USD MILLION)
                               TABLE 59 CONSULTING & ADVISORY SERVICES: AI STUDIO MARKET, BY REGION, 2024–2029 (USD MILLION)
           6.5.3 INTEGRATION & DEPLOYMENT SERVICES
                    6.5.3.1 Integration & deployment services to facilitate seamless incorporation and efficient utilization of AI-powered software systems
                               TABLE 60 INTEGRATION & DEPLOYMENT SERVICES: AI STUDIO MARKET, BY REGION, 2019–2023 (USD MILLION)
                               TABLE 61 INTEGRATION & DEPLOYMENT SERVICES: AI STUDIO MARKET, BY REGION, 2024–2029 (USD MILLION)
           6.5.4 SUPPORT & MAINTENANCE SERVICES
                    6.5.4.1 Support & maintenance services to ensure smooth functioning and optimization of AI-powered solutions
                               TABLE 62 SUPPORT & MAINTENANCE SERVICES: AI STUDIO MARKET, BY REGION, 2019–2023 (USD MILLION)
                               TABLE 63 SUPPORT & MAINTENANCE SERVICES: AI STUDIO MARKET, BY REGION, 2024–2029 (USD MILLION)
           6.5.5 TRAINING & EDUCATION SERVICES
                    6.5.5.1 Training & education services to impart expertise in developing, implementing, and managing user interfaces
                               TABLE 64 TRAINING & EDUCATION SERVICES: AI STUDIO MARKET, BY REGION, 2019–2023 (USD MILLION)
                               TABLE 65 TRAINING & EDUCATION SERVICES: AI STUDIO MARKET, BY REGION, 2024–2029 (USD MILLION)
           6.5.6 MANAGED SERVICES
                    6.5.6.1 Managed services maintain, monitor, and optimize AI Studio solutions on ongoing basis
                               TABLE 66 MANAGED SERVICES: AI STUDIO MARKET, BY REGION, 2019–2023 (USD MILLION)
                               TABLE 67 MANAGED SERVICES: AI STUDIO MARKET, BY REGION, 2024–2029 (USD MILLION)
 
7 AI STUDIO MARKET, BY DATA MODALITY (Page No. - 130)
    7.1 INTRODUCTION 
           7.1.1 DATA MODALITIES: AI STUDIO MARKET DRIVERS
                    FIGURE 42 LANGUAGE SEGMENT TO GROW AT HIGHEST CAGR DURING FORECAST PERIOD
                    TABLE 68 AI STUDIO MARKET, BY DATA MODALITY, 2019–2023 (USD MILLION)
                    TABLE 69 AI STUDIO MARKET, BY DATA MODALITY, 2024–2029 (USD MILLION)
    7.2 SPEECH 
           7.2.1 AI STUDIOS UTILIZE SPEECH RECOGNITION AND NLU TO AUTOMATE AND STREAMLINE CUSTOMER SERVICE OPERATIONS
                    TABLE 70 SPEECH: AI STUDIO MARKET, BY REGION, 2019–2023 (USD MILLION)
                    TABLE 71 SPEECH: AI STUDIO MARKET, BY REGION, 2024–2029 (USD MILLION)
    7.3 VISION 
           7.3.1 VISION DATA WITH AI MODELS AND OTHER MODALITIES GENERATE DIVERSE OUTPUTS
                    TABLE 72 VISION: AI STUDIO MARKET, BY REGION, 2019–2023 (USD MILLION)
                    TABLE 73 VISION: AI STUDIO MARKET, BY REGION, 2024–2029 (USD MILLION)
    7.4 LANGUAGE 
           7.4.1 BUSINESSES SEEK TO LEVERAGE LANGUAGE IN DATA MODALITY TO DRIVE INNOVATION AND DESIGN MODEL PERFORMANCE
                    TABLE 74 LANGUAGE: AI STUDIO MARKET, BY REGION, 2019–2023 (USD MILLION)
                    TABLE 75 LANGUAGE: AI STUDIO MARKET, BY REGION, 2024–2029 (USD MILLION)
    7.5 MULTIMODAL 
           7.5.1 MULTIMODAL AI SYSTEMS ARE DESIGNED TO PROCESS AND UNDERSTAND DIFFERENT DATA TYPES, WHICH HELPS IN BETTER DECISION-MAKING
                    TABLE 76 MULTIMODAL: AI STUDIO MARKET, BY REGION, 2019–2023 (USD MILLION)
                    TABLE 77 MULTIMODAL: AI STUDIO MARKET, BY REGION, 2024–2029 (USD MILLION)
 
8 AI STUDIO MARKET, BY APPLICATION (Page No. - 138)
    8.1 INTRODUCTION 
           8.1.1 APPLICATIONS: AI STUDIO MARKET DRIVERS
                    FIGURE 43 AUTOMATIC CONTENT GENERATION SEGMENT TO GROW AT HIGHEST CAGR DURING FORECAST PERIOD
                    TABLE 78 AI STUDIO MARKET, BY APPLICATION, 2019–2023 (USD MILLION)
                    TABLE 79 AI STUDIO MARKET, BY APPLICATION, 2024–2029 (USD MILLION)
    8.2 SENTIMENT ANALYSIS 
           8.2.1 SENTIMENT ANALYSIS HELPS MANAGE COMPETITIVE LEVERAGE BY PROVIDING CUSTOMER INSIGHTS
                    TABLE 80 SENTIMENT ANALYSIS: AI STUDIO MARKET, BY REGION, 2019–2023 (USD MILLION)
                    TABLE 81 SENTIMENT ANALYSIS: AI STUDIO MARKET, BY REGION, 2024–2029 (USD MILLION)
    8.3 CUSTOMER SERVICE AUTOMATION 
           8.3.1 CUSTOMER SERVICE AUTOMATION ENHANCES CUSTOMER EXPERIENCE, INCREASES OPERATIONAL EFFICIENCY, AND SUPPORTS SEAMLESS OMNICHANNEL INTEGRATION
                    TABLE 82 CUSTOMER SERVICE AUTOMATION: AI STUDIO MARKET, BY REGION, 2019–2023 (USD MILLION)
                    TABLE 83 CUSTOMER SERVICE AUTOMATION: AI STUDIO MARKET, BY REGION, 2024–2029 (USD MILLION)
    8.4 IMAGE CLASSIFICATION & LABELLING 
           8.4.1 IMAGE CLASSIFICATION AND LABELING ARE ESSENTIAL FOR CREATING ANNOTATED DATASETS USED TO TRAIN MACHINE LEARNING MODELS
                    TABLE 84 IMAGE CLASSIFICATION & LABELING: AI STUDIO MARKET, BY REGION, 2019–2023 (USD MILLION)
                    TABLE 85 IMAGE CLASSIFICATION & LABELING: AI STUDIO MARKET, BY REGION, 2024–2029 (USD MILLION)
    8.5 SYNTHETIC DATA GENERATION 
           8.5.1 SYNTHETIC DATA HELPS GENERATE CUSTOMER BEHAVIOR DATA FOR PERSONALIZED RECOMMENDATION SYSTEMS AND ENHANCE CUSTOMER EXPERIENCE
                    TABLE 86 SYNTHETIC DATA GENERATION: AI STUDIO MARKET, BY REGION, 2019–2023 (USD MILLION)
                    TABLE 87 SYNTHETIC DATA GENERATION: AI STUDIO MARKET, BY REGION, 2024–2029 (USD MILLION)
    8.6 PREDICTIVE MODELING & FORECASTING 
           8.6.1 AI STUDIO SOLUTIONS HELP DERIVE INSIGHTS AND IMPROVE RESOURCE ALLOCATION AND STRATEGIC PLANNING
                    TABLE 88 PREDICTIVE MODELING & FORECASTING: AI STUDIO MARKET, BY REGION, 2019–2023 (USD MILLION)
                    TABLE 89 PREDICTIVE MODELING & FORECASTING: AI STUDIO MARKET, BY REGION, 2024–2029 (USD MILLION)
    8.7 AUTOMATIC CONTENT GENERATION 
           8.7.1 AUTOMATIC CONTENT GENERATION ENHANCES PRODUCTIVITY, REDUCES COSTS, AND ENSURES CONSISTENCY IN COMMUNICATION
                    TABLE 90 AUTOMATIC CONTENT GENERATION: AI STUDIO MARKET, BY REGION, 2019–2023 (USD MILLION)
                    TABLE 91 AUTOMATIC CONTENT GENERATION: AI STUDIO MARKET, BY REGION, 2024–2029 (USD MILLION)
    8.8 OTHER APPLICATIONS 
                    TABLE 92 OTHER APPLICATIONS: AI STUDIO MARKET, BY REGION, 2019–2023 (USD MILLION)
                    TABLE 93 OTHER APPLICATIONS: AI STUDIO MARKET, BY REGION, 2024–2029 (USD MILLION)
 
9 AI STUDIO MARKET, BY VERTICAL (Page No. - 149)
    9.1 INTRODUCTION 
           9.1.1 VERTICALS: AI STUDIO MARKET DRIVERS
                    FIGURE 44 HEALTHCARE & LIFE SCIENCES SEGMENT TO GROW AT HIGHEST CAGR DURING FORECAST PERIOD
                    TABLE 94 AI STUDIO MARKET, BY VERTICAL, 2019–2023 (USD MILLION)
                    TABLE 95 AI STUDIO MARKET, BY VERTICAL 2024–2029 (USD MILLION)
    9.2 BFSI 
           9.2.1 AI STUDIO SOLUTIONS LEVERAGE ADVANCED TECHNOLOGIES TO ENHANCE VARIOUS ASPECTS OF OPERATIONS AND MACHINE LEARNING MODELS TAILORED TO UNIQUE NEEDS OF FINANCIAL INSTITUTIONS
                    TABLE 96 BFSI: AI STUDIO MARKET, BY REGION, 2019–2023 (USD MILLION)
                    TABLE 97 BFSI: AI STUDIO MARKET, BY REGION, 2024–2029 (USD MILLION)
           9.2.2 FRAUD DETECTION & PREVENTION
           9.2.3 RISK ASSESSMENT & MANAGEMENT
           9.2.4 ALGORITHMIC TRADING
           9.2.5 CREDIT SCORING & UNDERWRITING
           9.2.6 PERSONALIZED FINANCIAL RECOMMENDATIONS
           9.2.7 INVESTMENT PORTFOLIO MANAGEMENT
           9.2.8 REGULATORY COMPLIANCE MONITORING
           9.2.9 OTHERS
    9.3 RETAIL & ECOMMERCE 
           9.3.1 AI STUDIO CREATES TARGETED PRODUCT SUGGESTIONS THAT IMPROVE CONVERSION RATES AND ORDER VALUES
                    TABLE 98 RETAIL & ECOMMERCE: AI STUDIO MARKET, BY REGION, 2019–2023 (USD MILLION)
                    TABLE 99 RETAIL & ECOMMERCE: AI STUDIO MARKET, BY REGION, 2024–2029 (USD MILLION)
           9.3.2 PERSONALIZED PRODUCT RECOMMENDATION
           9.3.3 CUSTOMER RELATIONSHIP MANAGEMENT
           9.3.4 VISUAL SEARCH
           9.3.5 VIRTUAL CUSTOMER ASSISTANT
           9.3.6 PRICE OPTIMIZATION
           9.3.7 SUPPLY CHAIN MANAGEMENT & DEMAND PLANNING
           9.3.8 VIRTUAL STORES
           9.3.9 OTHERS
    9.4 TELECOM 
           9.4.1 NEED FOR OPTIMIZING NETWORK OPERATIONS AND DRIVE INNOVATION TO BOOST GROWTH
                    TABLE 100 TELECOM: AI STUDIO MARKET, BY REGION, 2019–2023 (USD MILLION)
                    TABLE 101 TELECOM: AI STUDIO MARKET, BY REGION, 2024–2029 (USD MILLION)
           9.4.2 NETWORK OPTIMIZATION
           9.4.3 NETWORK SECURITY
           9.4.4 NETWORK PLANNING & OPTIMIZATION
           9.4.5 NETWORK ANALYTICS
           9.4.6 INTELLIGENT CALL ROUTING
           9.4.7 NETWORK FAULT PREDICTION
           9.4.8 VIRTUAL NETWORK ASSISTANTS
           9.4.9 OTHERS
    9.5 MANUFACTURING 
           9.5.1 DEMAND FOR USE OF ADVANCED TECHNOLOGIES IN MANUFACTURING SECTOR TO DRIVE ADOPTION OF AI STUDIO SOLUTIONS
                    TABLE 102 MANUFACTURING: AI STUDIO MARKET, BY REGION, 2019–2023 (USD MILLION)
                    TABLE 103 MANUFACTURING: AI STUDIO MARKET, BY REGION, 2024–2029 (USD MILLION)
           9.5.2 MATERIAL MOVEMENT MANAGEMENT
           9.5.3 PREDICTIVE MAINTENANCE & MACHINERY INSPECTION
           9.5.4 PRODUCTION PLANNING
           9.5.5 RECYCLABLE MATERIAL RECLAMATION
           9.5.6 QUALITY CONTROL
           9.5.7 PRODUCTION LINE OPTIMIZATION
           9.5.8 INTELLIGENT INVENTORY MANAGEMENT
           9.5.9 OTHERS
    9.6 HEALTHCARE & LIFE SCIENCES 
           9.6.1 AI STUDIO TRANSFORMS HEALTHCARE INDUSTRY BY ENABLING FASTER DIAGNOSIS AND TREATMENT PLANS
                    TABLE 104 HEALTHCARE & LIFE SCIENCES: AI STUDIO MARKET, BY REGION, 2019–2023 (USD MILLION)
                    TABLE 105 HEALTHCARE & LIFE SCIENCES: AI STUDIO MARKET, BY REGION, 2024–2029 (USD MILLION)
           9.6.2 PATIENT DATA & RISK ANALYSIS
           9.6.3 LIFESTYLE MANAGEMENT & MONITORING
           9.6.4 PRECISION MEDICINE
           9.6.5 INPATIENT CARE & HOSPITAL MANAGEMENT
           9.6.6 MEDICAL IMAGING & DIAGNOSTICS
           9.6.7 DRUG DISCOVERY
           9.6.8 ROBOTIC SURGERY & ASSISTANCE
           9.6.9 MEDICAL RESEARCH
           9.6.10 OTHERS
    9.7 MEDIA & ENTERTAINMENT 
           9.7.1 AI STUDIO SOLUTIONS HELP MEDIA & ENTERTAINMENT COMPANIES ACHIEVE CREATIVITY
                    TABLE 106 MEDIA & ENTERTAINMENT: AI STUDIO MARKET, BY REGION, 2019–2023 (USD MILLION)
                    TABLE 107 MEDIA & ENTERTAINMENT: AI STUDIO MARKET, BY REGION, 2024–2029 (USD MILLION)
           9.7.2 CONTENT RECOMMENDATION SYSTEMS
           9.7.3 CONTENT CREATION & GENERATION
           9.7.4 CONTENT COPYRIGHT PROTECTION
           9.7.5 AUDIENCE ANALYTICS & SEGMENTATION
           9.7.6 PERSONALIZED ADVERTISING
           9.7.7 OTHERS
    9.8 IT & ITES 
           9.8.1 SYNERGY BETWEEN IT AND ITES SECTORS TO ACCELERATE GROWTH OF AI STUDIO MARKET
                    TABLE 108 IT & ITES: AI STUDIO MARKET, BY REGION, 2019–2023 (USD MILLION)
                    TABLE 109 IT & ITES: AI STUDIO MARKET, BY REGION, 2024–2029 (USD MILLION)
           9.8.2 AUTOMATED CODE GENERATION & OPTIMIZATION
           9.8.3 AUTOMATED IT ASSET MANAGEMENT
           9.8.4 IT TICKETING & SUPPORT AUTOMATION
           9.8.5 INTELLIGENT DATA BACKUP & RECOVERY
           9.8.6 AUTOMATED SOFTWARE TESTING & QUALITY ASSURANCE
           9.8.7 OTHERS
    9.9 GOVERNMENT & DEFENSE 
           9.9.1 FOCUS OF GOVERNMENTS ON ESTABLISHING FRAMEWORKS AND STANDARDS TO ENSURE ETHICAL DEVELOPMENT OF AI TECHNOLOGIES WITHIN DEFENSE CONTEXTS TO SPUR DEMAND
                    TABLE 110 GOVERNMENT & DEFENSE: AI STUDIO MARKET, BY REGION, 2019–2023 (USD MILLION)
                    TABLE 111 GOVERNMENT & DEFENSE: AI STUDIO MARKET, BY REGION, 2024–2029 (USD MILLION)
           9.9.2 SURVEILLANCE & SITUATIONAL AWARENESS
           9.9.3 LAW ENFORCEMENT
           9.9.4 INTELLIGENCE ANALYSIS & DATA PROCESSING
           9.9.5 SIMULATION & TRAINING
           9.9.6 COMMAND & CONTROL
           9.9.7 DISASTER RESPONSE & RECOVERY ASSISTANCE
           9.9.8 E-GOVERNANCE & DIGITAL CITY SERVICES
           9.9.9 OTHERS
    9.10 AUTOMOTIVE & TRANSPORTATION 
           9.10.1 RAPID ADVANCEMENTS REDEFINING MOBILITY AND TRANSPORTATION TO SERVE AS KEY DRIVER BOOSTING ADOPTION OF AI STUDIO SOLUTIONS
                    TABLE 112 AUTOMOTIVE & TRANSPORTATION: AI STUDIO MARKET, BY REGION, 2019–2023 (USD MILLION)
                    TABLE 113 AUTOMOTIVE & TRANSPORTATION: AI STUDIO MARKET, BY REGION, 2024–2029 (USD MILLION)
           9.10.2 SEMI-AUTONOMOUS & AUTONOMOUS VEHICLES
           9.10.3 ROUTE OPTIMIZATION
           9.10.4 INTELLIGENT TRAFFIC MANAGEMENT
           9.10.5 DRIVER ASSISTANCE SYSTEMS
           9.10.6 SMART LOGISTICS & WAREHOUSING
           9.10.7 SUPPLY CHAIN VISIBILITY & TRACKING
           9.10.8 FLEET MANAGEMENT
           9.10.9 VEHICLE DIAGNOSTICS & TELEMATICS
                    9.10.10 OTHERS (INTELLIGENT PARKING SYSTEMS & TRAFFIC PATTERN ANALYSIS)
    9.11 OTHER VERTICALS 
                    TABLE 114 OTHER VERTICALS: AI STUDIO MARKET, BY REGION, 2019–2023 (USD MILLION)
                    TABLE 115 OTHER VERTICALS: AI STUDIO MARKET, BY REGION, 2024–2029 (USD MILLION)
 
10 AI STUDIO MARKET, BY REGION (Page No. - 180)
     10.1 INTRODUCTION 
               FIGURE 45 INDIA TO REGISTER HIGHEST CAGR DURING FORECAST PERIOD
               FIGURE 46 ASIA PACIFIC TO WITNESS HIGHEST CAGR DURING FORECAST PERIOD
               TABLE 116 AI STUDIO MARKET, BY REGION, 2019–2023 (USD MILLION)
               TABLE 117 AI STUDIO MARKET, BY REGION, 2024–2029 (USD MILLION)
     10.2 NORTH AMERICA 
             10.2.1 NORTH AMERICA: AI STUDIO MARKET DRIVERS
             10.2.2 NORTH AMERICA: IMPACT OF RECESSION
                       FIGURE 47 NORTH AMERICA: MARKET SNAPSHOT
                       TABLE 118 NORTH AMERICA: AI STUDIO MARKET, BY OFFERING, 2019–2023 (USD MILLION)
                       TABLE 119 NORTH AMERICA: AI STUDIO MARKET, BY OFFERING, 2024–2029 (USD MILLION)
                       TABLE 120 NORTH AMERICA: AI STUDIO SOFTWARE MARKET, BY TYPE, 2019–2023 (USD MILLION)
                       TABLE 121 NORTH AMERICA: AI STUDIO SOFTWARE MARKET, BY TYPE, 2024–2029 (USD MILLION)
                       TABLE 122 NORTH AMERICA: AI STUDIO SOFTWARE MARKET, BY USER INTERFACE, 2019–2023 (USD MILLION)
                       TABLE 123 NORTH AMERICA: AI STUDIO SOFTWARE MARKET, BY USER INTERFACE, 2024–2029 (USD MILLION)
                       TABLE 124 NORTH AMERICA: AI STUDIO SOFTWARE MARKET, BY DEPLOYMENT MODE, 2019–2023 (USD MILLION)
                       TABLE 125 NORTH AMERICA: AI STUDIO SOFTWARE MARKET, BY DEPLOYMENT MODE, 2024–2029 (USD MILLION)
                       TABLE 126 NORTH AMERICA: AI STUDIO MARKET, BY SERVICE, 2019–2023 (USD MILLION)
                       TABLE 127 NORTH AMERICA: AI STUDIO MARKET, BY SERVICE, 2024–2029 (USD MILLION)
                       TABLE 128 NORTH AMERICA: AI STUDIO MARKET, BY PROFESSIONAL SERVICE, 2019–2023 (USD MILLION)
                       TABLE 129 NORTH AMERICA: AI STUDIO MARKET, BY PROFESSIONAL SERVICE, 2024–2029 (USD MILLION)
                       TABLE 130 NORTH AMERICA: AI STUDIO MARKET, BY DATA MODALITY, 2019–2023 (USD MILLION)
                       TABLE 131 NORTH AMERICA: AI STUDIO MARKET, BY DATA MODALITY, 2024–2029 (USD MILLION)
                       TABLE 132 NORTH AMERICA: AI STUDIO MARKET, BY APPLICATION, 2019–2023 (USD MILLION)
                       TABLE 133 NORTH AMERICA: AI STUDIO MARKET, BY APPLICATION, 2024–2029 (USD MILLION)
                       TABLE 134 NORTH AMERICA: AI STUDIO MARKET, BY VERTICAL, 2019–2023 (USD MILLION)
                       TABLE 135 NORTH AMERICA: AI STUDIO MARKET, BY VERTICAL, 2024–2029 (USD MILLION)
                       TABLE 136 NORTH AMERICA: AI STUDIO MARKET, BY COUNTRY, 2019–2023 (USD MILLION)
                       TABLE 137 NORTH AMERICA: AI STUDIO MARKET, BY COUNTRY, 2024–2029 (USD MILLION)
             10.2.3 US
                       10.2.3.1 Prominent tech companies offering solutions with flexibility, scalability, and user-friendly interfaces preferred by start-ups
             10.2.4 CANADA
                       10.2.4.1 Government frameworks for companies help with ethical AI deployment to maintain transparency and promote fairness
     10.3 EUROPE 
             10.3.1 EUROPE: AI STUDIO MARKET DRIVERS
             10.3.2 EUROPE: IMPACT OF RECESSION
                       TABLE 138 EUROPE: AI STUDIO MARKET, BY OFFERING, 2019–2023 (USD MILLION)
                       TABLE 139 EUROPE: AI STUDIO MARKET, BY OFFERING, 2024–2029 (USD MILLION)
                       TABLE 140 EUROPE: AI STUDIO SOFTWARE MARKET, BY TYPE, 2019–2023 (USD MILLION)
                       TABLE 141 EUROPE: AI STUDIO SOFTWARE MARKET, BY TYPE, 2024–2029 (USD MILLION)
                       TABLE 142 EUROPE: AI STUDIO SOFTWARE MARKET, BY USER INTERFACE, 2019–2023 (USD MILLION)
                       TABLE 143 EUROPE: AI STUDIO SOFTWARE MARKET, BY USER INTERFACE, 2024–2029 (USD MILLION)
                       TABLE 144 EUROPE: AI STUDIO SOFTWARE MARKET, BY DEPLOYMENT MODE, 2019–2023 (USD MILLION)
                       TABLE 145 EUROPE: AI STUDIO SOFTWARE MARKET, BY DEPLOYMENT MODE, 2024–2029 (USD MILLION)
                       TABLE 146 EUROPE: AI STUDIO MARKET, BY SERVICE, 2019–2023 (USD MILLION)
                       TABLE 147 EUROPE: AI STUDIO MARKET, BY SERVICE, 2024–2029 (USD MILLION)
                       TABLE 148 EUROPE: AI STUDIO MARKET, BY PROFESSIONAL SERVICE, 2019–2023 (USD MILLION)
                       TABLE 149 EUROPE: AI STUDIO MARKET, BY PROFESSIONAL SERVICE, 2024–2029 (USD MILLION)
                       TABLE 150 EUROPE: AI STUDIO MARKET, BY DATA MODALITY, 2019–2023 (USD MILLION)
                       TABLE 151 EUROPE: AI STUDIO MARKET, BY DATA MODALITY, 2024–2029 (USD MILLION)
                       TABLE 152 EUROPE: AI STUDIO MARKET, BY APPLICATION, 2019–2023 (USD MILLION)
                       TABLE 153 EUROPE: AI STUDIO MARKET, BY APPLICATION, 2024–2029 (USD MILLION)
                       TABLE 154 EUROPE: AI STUDIO MARKET, BY VERTICAL, 2019–2023 (USD MILLION)
                       TABLE 155 EUROPE: AI STUDIO MARKET, BY VERTICAL, 2024–2029 (USD MILLION)
                       TABLE 156 EUROPE: AI STUDIO MARKET, BY COUNTRY, 2019–2023 (USD MILLION)
                       TABLE 157 EUROPE: AI STUDIO MARKET, BY COUNTRY, 2024–2029 (USD MILLION)
             10.3.3 UK
                       10.3.3.1 Government regulations in favor of AI deployment coupled with large players’ expansion into UK to drive growth
             10.3.4 GERMANY
                       10.3.4.1 Initiatives such as LEAM and collaboration between tech companies and universities foster AI ecosystem growth
             10.3.5 FRANCE
                       10.3.5.1 Involvement of prominent enterprise AI software providers
             10.3.6 SPAIN
                       10.3.6.1 National strategy outlining comprehensive approach to promoting responsible AI innovation
             10.3.7 ITALY
                       10.3.7.1 Rising focus on digital health laws and regulations to encourage development of AI Studio solutions
             10.3.8 REST OF EUROPE
     10.4 ASIA PACIFIC 
             10.4.1 ASIA PACIFIC: AI STUDIO MARKET DRIVERS
             10.4.2 ASIA PACIFIC: IMPACT OF RECESSION
                       FIGURE 48 ASIA PACIFIC: MARKET SNAPSHOT
                       TABLE 158 ASIA PACIFIC: AI STUDIO MARKET, BY OFFERING, 2019–2023 (USD MILLION)
                       TABLE 159 ASIA PACIFIC: AI STUDIO MARKET, BY OFFERING, 2024–2029 (USD MILLION)
                       TABLE 160 ASIA PACIFIC: AI STUDIO SOFTWARE MARKET, BY TYPE, 2019–2023 (USD MILLION)
                       TABLE 161 ASIA PACIFIC: AI STUDIO SOFTWARE MARKET, BY TYPE, 2024–2029 (USD MILLION)
                       TABLE 162 ASIA PACIFIC: AI STUDIO SOFTWARE MARKET, BY USER INTERFACE, 2019–2023 (USD MILLION)
                       TABLE 163 ASIA PACIFIC: AI STUDIO SOFTWARE MARKET, BY USER INTERFACE, 2024–2029 (USD MILLION)
                       TABLE 164 ASIA PACIFIC: AI STUDIO SOFTWARE MARKET, BY DEPLOYMENT MODE, 2019–2023 (USD MILLION)
                       TABLE 165 ASIA PACIFIC: AI STUDIO SOFTWARE MARKET, BY DEPLOYMENT MODE, 2024–2029 (USD MILLION)
                       TABLE 166 ASIA PACIFIC: AI STUDIO MARKET, BY SERVICE, 2019–2023 (USD MILLION)
                       TABLE 167 ASIA PACIFIC: AI STUDIO MARKET, BY SERVICE, 2024–2029 (USD MILLION)
                       TABLE 168 ASIA PACIFIC: AI STUDIO MARKET, BY PROFESSIONAL SERVICE, 2019–2023 (USD MILLION)
                       TABLE 169 ASIA PACIFIC: AI STUDIO MARKET, BY PROFESSIONAL SERVICE, 2024–2029 (USD MILLION)
                       TABLE 170 ASIA PACIFIC: AI STUDIO MARKET, BY DATA MODALITY, 2019–2023 (USD MILLION)
                       TABLE 171 ASIA PACIFIC: AI STUDIO MARKET, BY DATA MODALITY, 2024–2029 (USD MILLION)
                       TABLE 172 ASIA PACIFIC: AI STUDIO MARKET, BY APPLICATION, 2019–2023 (USD MILLION)
                       TABLE 173 ASIA PACIFIC: AI STUDIO MARKET, BY APPLICATION, 2024–2029 (USD MILLION)
                       TABLE 174 ASIA PACIFIC: AI STUDIO MARKET, BY VERTICAL, 2019–2023 (USD MILLION)
                       TABLE 175 ASIA PACIFIC: AI STUDIO MARKET, BY VERTICAL, 2024–2029 (USD MILLION)
                       TABLE 176 ASIA PACIFIC: AI STUDIO MARKET, BY COUNTRY/REGION, 2019–2023 (USD MILLION)
                       TABLE 177 ASIA PACIFIC: AI STUDIO MARKET, BY COUNTRY/REGION, 2024–2029 (USD MILLION)
             10.4.3 CHINA
                       10.4.3.1 Aggressive government policies and substantial investments from leading Chinese retailers and tech companies
             10.4.4 JAPAN
                       10.4.4.1 Government strategies to integrate AI into key sectors bolstered by prominent players
             10.4.5 INDIA
                       10.4.5.1 Establishment of regulations and strategies to foster conducive AI ecosystem
             10.4.6 SOUTH KOREA
                       10.4.6.1 Prominent South Korean companies spearheading AI advancements, especially in consumer electronics and healthcare solutions
             10.4.7 AUSTRALIA & NEW ZEALAND
                       10.4.7.1 Development of sophisticated ML and AI platforms to enhance efficiency across industries to boost market
             10.4.8 ASEAN COUNTRIES
                       10.4.8.1 Governments launching strategies and policies to promote AI development, research, and adoption
             10.4.9 REST OF ASIA PACIFIC
     10.5 MIDDLE EAST & AFRICA 
             10.5.1 MIDDLE EAST & AFRICA: AI STUDIO MARKET DRIVERS
             10.5.2 MIDDLE EAST & AFRICA: IMPACT OF RECESSION
                       TABLE 178 MIDDLE EAST & AFRICA: AI STUDIO MARKET, BY OFFERING, 2019–2023 (USD MILLION)
                       TABLE 179 MIDDLE EAST & AFRICA: AI STUDIO MARKET, BY OFFERING, 2024–2029 (USD MILLION)
                       TABLE 180 MIDDLE EAST & AFRICA: AI STUDIO SOFTWARE MARKET, BY TYPE, 2019–2023 (USD MILLION)
                       TABLE 181 MIDDLE EAST & AFRICA: AI STUDIO SOFTWARE MARKET, BY TYPE, 2024–2029 (USD MILLION)
                       TABLE 182 MIDDLE EAST & AFRICA: AI STUDIO SOFTWARE MARKET, BY USER INTERFACE, 2019–2023 (USD MILLION)
                       TABLE 183 MIDDLE EAST & AFRICA: AI STUDIO SOFTWARE MARKET, BY USER INTERFACE, 2024–2029 (USD MILLION)
                       TABLE 184 MIDDLE EAST & AFRICA: AI STUDIO SOFTWARE MARKET, BY DEPLOYMENT MODE, 2019–2023 (USD MILLION)
                       TABLE 185 MIDDLE EAST & AFRICA: AI STUDIO SOFTWARE MARKET, BY DEPLOYMENT MODE, 2024–2029 (USD MILLION)
                       TABLE 186 MIDDLE EAST & AFRICA: AI STUDIO MARKET, BY SERVICE, 2019–2023 (USD MILLION)
                       TABLE 187 MIDDLE EAST & AFRICA: AI STUDIO MARKET, BY SERVICE, 2024–2029 (USD MILLION)
                       TABLE 188 MIDDLE EAST & AFRICA: AI STUDIO MARKET, BY PROFESSIONAL SERVICE, 2019–2023 (USD MILLION)
                       TABLE 189 MIDDLE EAST & AFRICA: AI STUDIO MARKET, BY PROFESSIONAL SERVICE, 2024–2029 (USD MILLION)
                       TABLE 190 MIDDLE EAST & AFRICA: AI STUDIO MARKET, BY DATA MODALITY, 2019–2023 (USD MILLION)
                       TABLE 191 MIDDLE EAST & AFRICA: AI STUDIO MARKET, BY DATA MODALITY, 2024–2029 (USD MILLION)
                       TABLE 192 MIDDLE EAST & AFRICA: AI STUDIO MARKET, BY APPLICATION, 2019–2023 (USD MILLION)
                       TABLE 193 MIDDLE EAST & AFRICA: AI STUDIO MARKET, BY APPLICATION, 2024–2029 (USD MILLION)
                       TABLE 194 MIDDLE EAST & AFRICA: AI STUDIO MARKET, BY VERTICAL, 2019–2023 (USD MILLION)
                       TABLE 195 MIDDLE EAST & AFRICA: AI STUDIO MARKET, BY VERTICAL, 2024–2029 (USD MILLION)
                       TABLE 196 MIDDLE EAST & AFRICA: AI STUDIO MARKET, BY COUNTRY, 2019–2023 (USD MILLION)
                       TABLE 197 MIDDLE EAST & AFRICA: AI STUDIO MARKET, BY COUNTRY, 2024–2029 (USD MILLION)
             10.5.3 UAE
                       10.5.3.1 Establishment of ministries and businesses’ focus on innovation to attract investments
             10.5.4 SAUDI ARABIA
                       10.5.4.1 High investment by Saudi government in AI and related technologies as part of its Vision 2030 initiative
             10.5.5 SOUTH AFRICA
                       10.5.5.1 Government frameworks and policies supported by presence of AI giants and start-ups
             10.5.6 TURKEY
                       10.5.6.1 Government initiatives such as Digital Transformation Office and Artificial Intelligence Institute to drive investment by tech leaders
             10.5.7 QATAR
                       10.5.7.1 Qatar Computing Research Institute (QCRI) at forefront of AI research, focusing on areas such as NLP, data analytics, and cybersecurity
             10.5.8 REST OF MIDDLE EAST & AFRICA
     10.6 LATIN AMERICA 
             10.6.1 LATIN AMERICA: AI STUDIO MARKET DRIVERS
             10.6.2 LATIN AMERICA: IMPACT OF RECESSION
                       TABLE 198 LATIN AMERICA: AI STUDIO MARKET, BY OFFERING, 2019–2023 (USD MILLION)
                       TABLE 199 LATIN AMERICA: AI STUDIO MARKET, BY OFFERING, 2024–2029 (USD MILLION)
                       TABLE 200 LATIN AMERICA: AI STUDIO SOFTWARE MARKET, BY TYPE, 2019–2023 (USD MILLION)
                       TABLE 201 LATIN AMERICA: AI STUDIO SOFTWARE MARKET, BY TYPE, 2024–2029 (USD MILLION)
                       TABLE 202 LATIN AMERICA: AI STUDIO SOFTWARE MARKET, BY USER INTERFACE, 2019–2023 (USD MILLION)
                       TABLE 203 LATIN AMERICA: AI STUDIO SOFTWARE MARKET, BY USER INTERFACE, 2024–2029 (USD MILLION)
                       TABLE 204 LATIN AMERICA: AI STUDIO SOFTWARE MARKET, BY DEPLOYMENT MODE, 2019–2023 (USD MILLION)
                       TABLE 205 LATIN AMERICA: AI STUDIO SOFTWARE MARKET, BY DEPLOYMENT MODE, 2024–2029 (USD MILLION)
                       TABLE 206 LATIN AMERICA: AI STUDIO MARKET, BY SERVICE, 2019–2023 (USD MILLION)
                       TABLE 207 LATIN AMERICA: AI STUDIO MARKET, BY SERVICE, 2024–2029 (USD MILLION)
                       TABLE 208 LATIN AMERICA: AI STUDIO MARKET, BY PROFESSIONAL SERVICE, 2019–2023 (USD MILLION)
                       TABLE 209 LATIN AMERICA: AI STUDIO MARKET, BY PROFESSIONAL SERVICE, 2024–2029 (USD MILLION)
                       TABLE 210 LATIN AMERICA: AI STUDIO MARKET, BY DATA MODALITY, 2019–2023 (USD MILLION)
                       TABLE 211 LATIN AMERICA: AI STUDIO MARKET, BY DATA MODALITY, 2024–2029 (USD MILLION)
                       TABLE 212 LATIN AMERICA: AI STUDIO MARKET, BY APPLICATION, 2019–2023 (USD MILLION)
                       TABLE 213 LATIN AMERICA: AI STUDIO MARKET, BY APPLICATION, 2024–2029 (USD MILLION)
                       TABLE 214 LATIN AMERICA: AI STUDIO MARKET, BY VERTICAL, 2019–2023 (USD MILLION)
                       TABLE 215 LATIN AMERICA: AI STUDIO MARKET, BY VERTICAL, 2024–2029 (USD MILLION)
                       TABLE 216 LATIN AMERICA: AI STUDIO MARKET, BY COUNTRY, 2019–2023 (USD MILLION)
                       TABLE 217 LATIN AMERICA: AI STUDIO MARKET, BY COUNTRY, 2024–2029 (USD MILLION)
             10.6.3 BRAZIL
                       10.6.3.1 Collaborative ecosystem supported by regulatory frameworks and active industry participation
             10.6.4 MEXICO
                       10.6.4.1 Growing demand for AI capabilities across industries and rapid adoption of AI and IoT to enhance country’s digital landscape
             10.6.5 ARGENTINA
                       10.6.5.1 Implementation of policies encouraging research and development in AI to spur demand for AI Studio solutions
             10.6.6 REST OF LATIN AMERICA
 
11 COMPETITIVE LANDSCAPE (Page No. - 234)
     11.1 OVERVIEW 
     11.2 KEY PLAYERS’ STRATEGIES/RIGHT TO WIN 
               TABLE 218 OVERVIEW OF STRATEGIES ADOPTED BY KEY AI STUDIO VENDORS
     11.3 REVENUE ANALYSIS 
               FIGURE 49 TOP FIVE PLAYERS DOMINATING AI STUDIO MARKET, 2019–2023 (USD MILLION)
     11.4 MARKET SHARE ANALYSIS 
               FIGURE 50 SHARE OF LEADING COMPANIES IN AI STUDIO MARKET, 2023
             11.4.1 MARKET RANKING ANALYSIS
                       TABLE 219 AI STUDIO MARKET: DEGREE OF COMPETITION
     11.5 BRANDS’ COMPARATIVE ANALYSIS 
               FIGURE 51 BRANDS’ COMPARATIVE ANALYSIS
     11.6 COMPANY VALUATION AND FINANCIAL METRICS OF KEY VENDORS 
               FIGURE 52 COMPANY VALUATION AND FINANCIAL METRICS OF KEY VENDORS
               FIGURE 53 YEAR-TO-DATE (YTD) PRICE TOTAL RETURN AND 5-YEAR STOCK BETA OF KEY VENDORS
     11.7 COMPANY EVALUATION MATRIX: KEY PLAYERS, 2023 
             11.7.1 STARS
             11.7.2 EMERGING LEADERS
             11.7.3 PERVASIVE PLAYERS
             11.7.4 PARTICIPANTS
                       FIGURE 54 AI STUDIO MARKET: COMPANY EVALUATION MATRIX (KEY PLAYERS), 2023
             11.7.5 COMPANY FOOTPRINT: KEY PLAYERS
                       11.7.5.1 Company footprint
                                   FIGURE 55 AI STUDIO MARKET: COMPANY FOOTPRINT (23 COMPANIES)
                       11.7.5.2 Regional footprint
                                   TABLE 220 AI STUDIO MARKET: REGIONAL FOOTPRINT (23 COMPANIES)
                       11.7.5.3 Application footprint
                                   TABLE 221 AI STUDIO MARKET: APPLICATION FOOTPRINT (23 COMPANIES)
                       11.7.5.4 Vertical footprint
                                   TABLE 222 AI STUDIO MARKET: VERTICAL FOOTPRINT (23 COMPANIES)
                       11.7.5.5 Product footprint
                                   TABLE 223 AI STUDIO MARKET: PRODUCT FOOTPRINT (23 COMPANIES)
     11.8 COMPANY EVALUATION MATRIX: START-UPS/SMES, 2023 
             11.8.1 PROGRESSIVE COMPANIES
             11.8.2 RESPONSIVE COMPANIES
             11.8.3 DYNAMIC COMPANIES
             11.8.4 STARTING BLOCKS
                       FIGURE 56 AI STUDIO MARKET: COMPANY EVALUATION MATRIX (START-UPS/SMES), 2023
             11.8.5 COMPETITIVE BENCHMARKING: START-UPS/SMES
                       11.8.5.1 Detailed list of key start-ups/SMEs
                                   TABLE 224 AI STUDIO MARKET: DETAILED LIST OF KEY START-UPS/SMES
                       11.8.5.2 Competitive benchmarking of key start-ups/SMEs
                                   TABLE 225 AI STUDIO MARKET: COMPETITIVE BENCHMARKING OF START-UPS/SMES
     11.9 COMPETITIVE SCENARIO & TRENDS 
             11.9.1 PRODUCT LAUNCHES & ENHANCEMENTS
                       TABLE 226 AI STUDIO MARKET: PRODUCT LAUNCHES & ENHANCEMENTS, JANUARY 2021–APRIL 2024
             11.9.2 DEALS
                       TABLE 227 AI STUDIO MARKET: DEALS, JANUARY 2021–MARCH 2024
 
12 COMPANY PROFILES (Page No. - 258)
     12.1 INTRODUCTION 
     12.2 KEY PLAYERS 
(Business Overview, Products/Solutions/Services offered, Recent Developments, MnM View)*
             12.2.1 MICROSOFT
                       TABLE 228 MICROSOFT: BUSINESS OVERVIEW
                       FIGURE 57 MICROSOFT: COMPANY SNAPSHOT
                       TABLE 229 MICROSOFT: PRODUCTS/SOLUTIONS/SERVICES OFFERED
                       TABLE 230 MICROSOFT: PRODUCT LAUNCHES & ENHANCEMENTS
                       TABLE 231 MICROSOFT: DEALS
             12.2.2 IBM
                       TABLE 232 IBM: BUSINESS OVERVIEW
                       FIGURE 58 IBM: COMPANY SNAPSHOT
                       TABLE 233 IBM: PRODUCTS/SOLUTIONS/SERVICES OFFERED
                       TABLE 234 IBM: PRODUCT LAUNCHES & ENHANCEMENTS
                       TABLE 235 IBM: DEALS
             12.2.3 GOOGLE
                       TABLE 236 GOOGLE: BUSINESS OVERVIEW
                       FIGURE 59 GOOGLE: COMPANY SNAPSHOT
                       TABLE 237 GOOGLE: PRODUCTS/SOLUTIONS/SERVICES OFFERED
                       TABLE 238 GOOGLE: PRODUCT LAUNCHES & ENHANCEMENTS
             12.2.4 AWS
                       TABLE 239 AWS: BUSINESS OVERVIEW
                       FIGURE 60 AWS: COMPANY SNAPSHOT
                       TABLE 240 AWS: PRODUCTS/SOLUTIONS/SERVICES OFFERED
                       TABLE 241 AWS: PRODUCT LAUNCHES & ENHANCEMENTS
                       TABLE 242 AWS: DEALS
             12.2.5 VONAGE
                       TABLE 243 VONAGE: BUSINESS OVERVIEW
                       TABLE 244 VONAGE: PRODUCTS/SOLUTIONS/SERVICES OFFERED
                       TABLE 245 VONAGE: DEALS
             12.2.6 SPRINKLR
                       TABLE 246 SPRINKLR: BUSINESS OVERVIEW
                       FIGURE 61 SPRINKLR: COMPANY SNAPSHOT
                       TABLE 247 SPRINKLR: PRODUCTS/SOLUTIONS/SERVICES OFFERED
                       TABLE 248 SPRINKLR: PRODUCT LAUNCHES & ENHANCEMENTS
                       TABLE 249 SPRINKLR: DEALS
             12.2.7 BLAIZE
                       TABLE 250 BLAIZE: BUSINESS OVERVIEW
                       TABLE 251 BLAIZE: PRODUCTS/SOLUTIONS/SERVICES OFFERED
                       TABLE 252 BLAIZE: PRODUCT LAUNCHES & ENHANCEMENTS
                       TABLE 253 BLAIZE: DEALS
             12.2.8 DATAROBOT
                       TABLE 254 DATAROBOT: BUSINESS OVERVIEW
                       TABLE 255 DATAROBOT: PRODUCTS/SOLUTIONS/SERVICES OFFERED
                       TABLE 256 DATAROBOT: PRODUCT LAUNCHES & ENHANCEMENTS
                       TABLE 257 DATAROBOT: DEALS
             12.2.9 ALTAIR
                       TABLE 258 ALTAIR: BUSINESS OVERVIEW
                       FIGURE 62 ALTAIR: COMPANY SNAPSHOT
                       TABLE 259 ALTAIR: PRODUCTS/SOLUTIONS/SERVICES OFFERED
                       TABLE 260 ALTAIR: PRODUCT LAUNCHES & ENHANCEMENTS
                       TABLE 261 ALTAIR: DEALS
             12.2.10 C3 AI
                                   TABLE 262 C3 AI: BUSINESS OVERVIEW
                                   FIGURE 63 C3 AI: COMPANY SNAPSHOT
                                   TABLE 263 C3 AI: PRODUCTS/SOLUTIONS/SERVICES OFFERED
                                   TABLE 264 C3 AI: PRODUCT LAUNCHES & ENHANCEMENTS
                                   TABLE 265 C3 AI: DEALS
     12.3 OTHER PLAYERS 
             12.3.1 HP
             12.3.2 SPARKCOGNITION
             12.3.3 ICERTIS
             12.3.4 INTEL
             12.3.5 DEEPBRAIN AI
             12.3.6 AGILEENGINE
             12.3.7 EXPERT.AI
             12.3.8 USHUR
             12.3.9 AVENUE CODE
             12.3.10 QUBIKA
             12.3.11 ANTHROPIC
             12.3.12 EVOLVE IP
             12.3.13 DATABRICKS
             12.3.14 BRILLIO
     12.4 START-UPS/SMES 
             12.4.1 APPY PIE
             12.4.2 CONJU
             12.4.3 BRICABRAC AI
             12.4.4 DONAKOSY
             12.4.5 BAPPFY AI
             12.4.6 DEEPOPINION
             12.4.7 ORKES
             12.4.8 BRANCHBOB AI
*Details on Business Overview, Products/Solutions/Services offered, Recent Developments, MnM View might not be captured in case of unlisted companies.
 
13 ADJACENT AND RELATED MARKETS (Page No. - 317)
     13.1 INTRODUCTION 
     13.2 GENERATIVE AI MARKET 
             13.2.1 MARKET DEFINITION
             13.2.2 MARKET OVERVIEW
                       13.2.2.1 Generative AI market, by offering
                                   TABLE 266 GENERATIVE AI MARKET, BY OFFERING, 2019–2023 (USD MILLION)
                                   TABLE 267 GENERATIVE AI MARKET, BY OFFERING, 2024–2030 (USD MILLION)
                       13.2.2.2 Generative AI market, by data modality
                                   TABLE 268 GENERATIVE AI MARKET, BY DATA MODALITY, 2019–2023 (USD MILLION)
                                   TABLE 269 GENERATIVE AI MARKET, BY DATA MODALITY, 2024–2030 (USD MILLION)
                       13.2.2.3 Generative AI market, by application
                                   TABLE 270 GENERATIVE AI MARKET, BY APPLICATION, 2019–2023 (USD MILLION)
                                   TABLE 271 GENERATIVE AI MARKET, BY APPLICATION, 2024–2030 (USD MILLION)
                       13.2.2.4 Generative AI market, by vertical
                                   TABLE 272 GENERATIVE AI MARKET, BY VERTICAL, 2019–2023 (USD MILLION)
                                   TABLE 273 GENERATIVE AI MARKET, BY VERTICAL, 2024–2030 (USD MILLION)
                       13.2.2.5 Generative AI market, by region
                                   TABLE 274 GENERATIVE AI MARKET, BY REGION, 2019–2023 (USD MILLION)
                                   TABLE 275 GENERATIVE AI MARKET, BY REGION, 2024–2030 (USD MILLION)
     13.3 CONVERSATIONAL AI MARKET 
             13.3.1 MARKET DEFINITION
             13.3.2 MARKET OVERVIEW
                       13.3.2.1 Conversational AI market, by offering
                                   TABLE 276 CONVERSATIONAL AI MARKET, BY OFFERING, 2019–2023 (USD MILLION)
                                   TABLE 277 CONVERSATIONAL AI MARKET, BY OFFERING, 2024–2030 (USD MILLION)
                       13.3.2.2 Conversational AI market, by business function
                                   TABLE 278 CONVERSATIONAL AI MARKET, BY BUSINESS FUNCTION, 2019–2023 (USD MILLION)
                                   TABLE 279 CONVERSATIONAL AI MARKET, BY BUSINESS FUNCTION, 2024–2030 (USD MILLION)
                       13.3.2.3 Conversational AI market, by conversational agent type
                                   TABLE 280 CONVERSATIONAL AI MARKET, BY CONVERSATIONAL AGENT TYPE, 2019–2023 (USD MILLION)
                                   TABLE 281 CONVERSATIONAL AI MARKET, BY CONVERSATIONAL AGENT TYPE, 2024–2030 (USD MILLION)
                       13.3.2.4 Conversational AI market, by vertical
                                   TABLE 282 CONVERSATIONAL AI MARKET, BY VERTICAL, 2019–2023 (USD MILLION)
                                   TABLE 283 CONVERSATIONAL AI MARKET, BY VERTICAL, 2024–2030 (USD MILLION)
                       13.3.2.5 Conversational AI market, by region
                                   TABLE 284 CONVERSATIONAL AI MARKET, BY REGION, 2019–2023 (USD MILLION)
                                   TABLE 285 CONVERSATIONAL AI MARKET, BY REGION, 2024–2030 (USD MILLION)
 
14 APPENDIX (Page No. - 327)
     14.1 DISCUSSION GUIDE 
     14.2 KNOWLEDGESTORE: MARKETSANDMARKETS’ SUBSCRIPTION PORTAL 
     14.3 CUSTOMIZATION OPTIONS 
     14.4 RELATED REPORTS 
     14.5 AUTHOR DETAILS 

The AI Studio market research study involved extensive secondary sources, directories, journals, and paid databases. Primary sources were mainly industry experts from the core and related industries, preferred AI Studio providers, third-party service providers, consulting service providers, end users, and other commercial enterprises. In-depth interviews were conducted with various primary respondents, including key industry participants and subject matter experts, to obtain and verify critical qualitative and quantitative information, and assess the market’s prospects.

Secondary Research

In the secondary research process, various sources were referred to, for identifying and collecting information for this study. Secondary sources included annual reports, press releases, and investor presentations of companies; white papers, journals, and certified publications; and articles from recognized authors, directories, and databases. The data was also collected from other secondary sources, such as journals, government websites, blogs, and vendors' websites. Additionally, AI Studio spending of various countries was extracted from the respective sources. Secondary research was mainly used to obtain key information related to the industry’s value chain and supply chain to identify key players based on software, services, market classification, and segmentation according to offerings of major players, industry trends related to software, deployment mode, user interface, services, data modality,  application, vertical, and regions, and key developments from both market- and technology-oriented perspectives.

Primary Research

In the primary research process, various primary sources from both the supply and demand sides were interviewed to obtain qualitative and quantitative information on the market. The primary sources from the supply side included various industry experts, including Chief Experience Officers (CXOs); Vice Presidents (VPs); directors from business development, marketing, and AI Studio expertise; related key executives from AI Studio solution vendors, SIs, professional service providers, and industry associations; and key opinion leaders.

Primary interviews were conducted to gather insights, such as market statistics, revenue data collected from software and services, market breakups, market size estimations, market forecasts, and data triangulation. Primary research also helped understand various trends related to technologies, applications, deployments, and regions. Stakeholders from the demand side, such as Chief Information Officers (CIOs), Chief Technology Officers (CTOs), Chief Strategy Officers (CSOs), and end users using AI Studio solutions, were interviewed to understand the buyer’s perspective on suppliers, products, service providers, and their current usage of AI Studio software and services, which would impact the overall AI Studio market.

The Breakup of Primary Research:

AI Studio Market Size, and Share

To know about the assumptions considered for the study, download the pdf brochure

Market Size Estimation

In the bottom-up approach, the adoption rate of AI Studio solutions and services among different end users in key countries concerning their regions contributing the most to the market share was identified. For cross-validation, the adoption of AI Studio solutions and services among industries and different use cases concerning their regions was identified and extrapolated. Weightage was given to use cases identified in different regions for the market size calculation.

Based on the market numbers, the regional split was determined by primary and secondary sources. The procedure included the analysis of the AI Studio market’s regional penetration. Based on secondary research, the regional spending on Information and Communications Technology (ICT), socio-economic analysis of each country, strategic vendor analysis of major AI Studio providers, and organic and inorganic business development activities of regional and global players were estimated. With the data triangulation procedure and data validation through primaries, the exact values of the overall AI Studio market size and segments’ size were determined and confirmed using the study.

Global AI Studio Market Size: Bottom-Up and Top-Down Approach

AI Studio Market Bottom Up and Top Down Approach

Data Triangulation

Based on the market numbers, the regional split was determined by primary and secondary sources. The procedure included the analysis of the AI Studio market’s regional penetration. Based on secondary research, the regional spending on Information and Communications Technology (ICT), socio-economic analysis of each country, strategic vendor analysis of major AI Studio providers, and organic and inorganic business development activities of regional and global players were estimated. With the data triangulation procedure and data validation through primaries, the exact values of the overall AI Studio market size and segments’ size were determined and confirmed using the study.

Market Definition

AI Studio is an innovative artificial intelligence tool designed to enable users to create and operate complex intelligent systems without writing a single line of code. With AI Studio, creating intelligent systems becomes accessible and efficient for everyone, without requiring deep technical knowledge. AI Studio software encompasses a range of tools and platforms that utilize AI algorithms to automate tasks, enhance efficiency, and improve outcomes in various domains, such as video editing, software development, and enterprise operations. AI Studio software increasingly integrates with cloud platforms such as AWS, Azure, and Google Cloud to leverage scalable computing resources and facilitate easy deployment and management of AI models. The AI Studio software is characterized by trends such as the integration of machine learning, natural language processing (NLP), and generative AI technologies to enable advanced functionalities like automated editing workflows, personalized content creation, and enhanced productivity for developers.
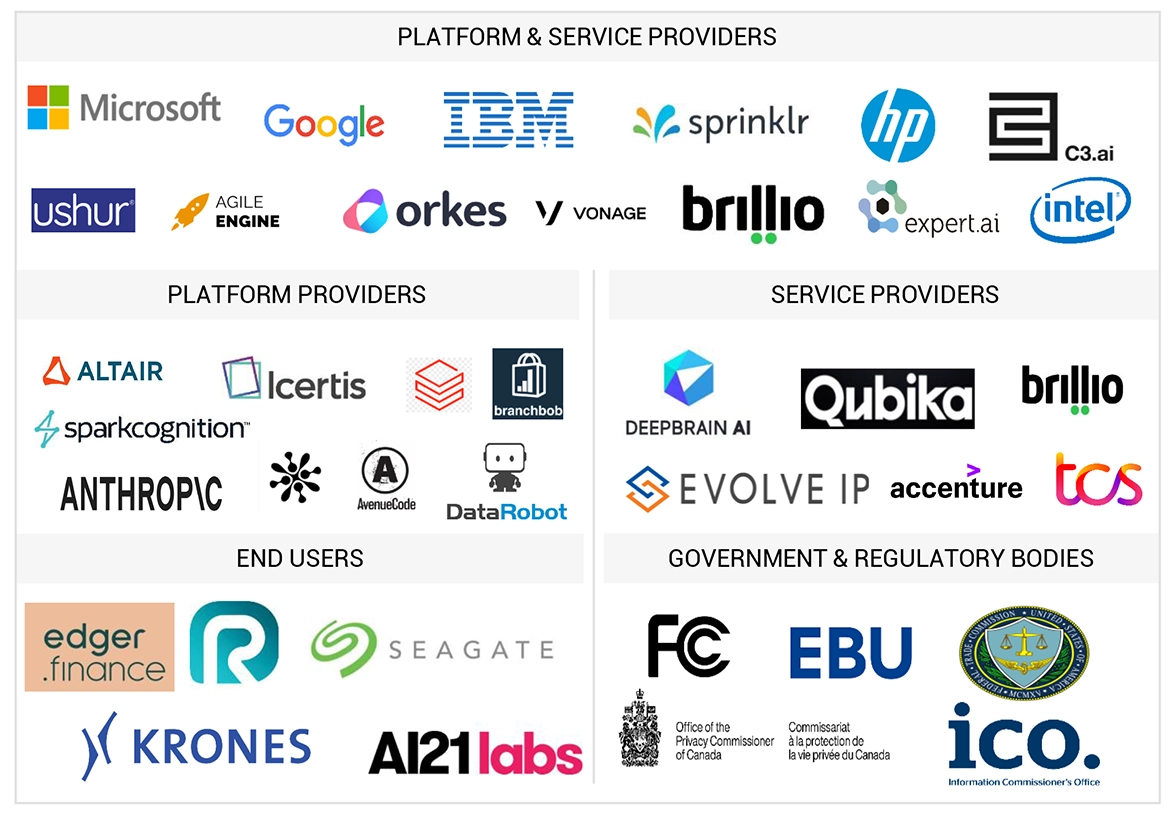
Stakeholders

  • Application design and software developers
  • AI Studio vendors
  • Business analysts
  • Cloud service providers
  • Consulting service providers
  • Business owners
  • Distributors and Value-added Resellers (VARs)
  • Government agencies
  • Independent Software Vendors (ISV)
  • Managed service providers
  • Market research and consulting firms
  • Support & maintenance service providers
  • System Integrators (SIs)/migration service providers
  • OEMs
  • Technology providers

Report Objectives

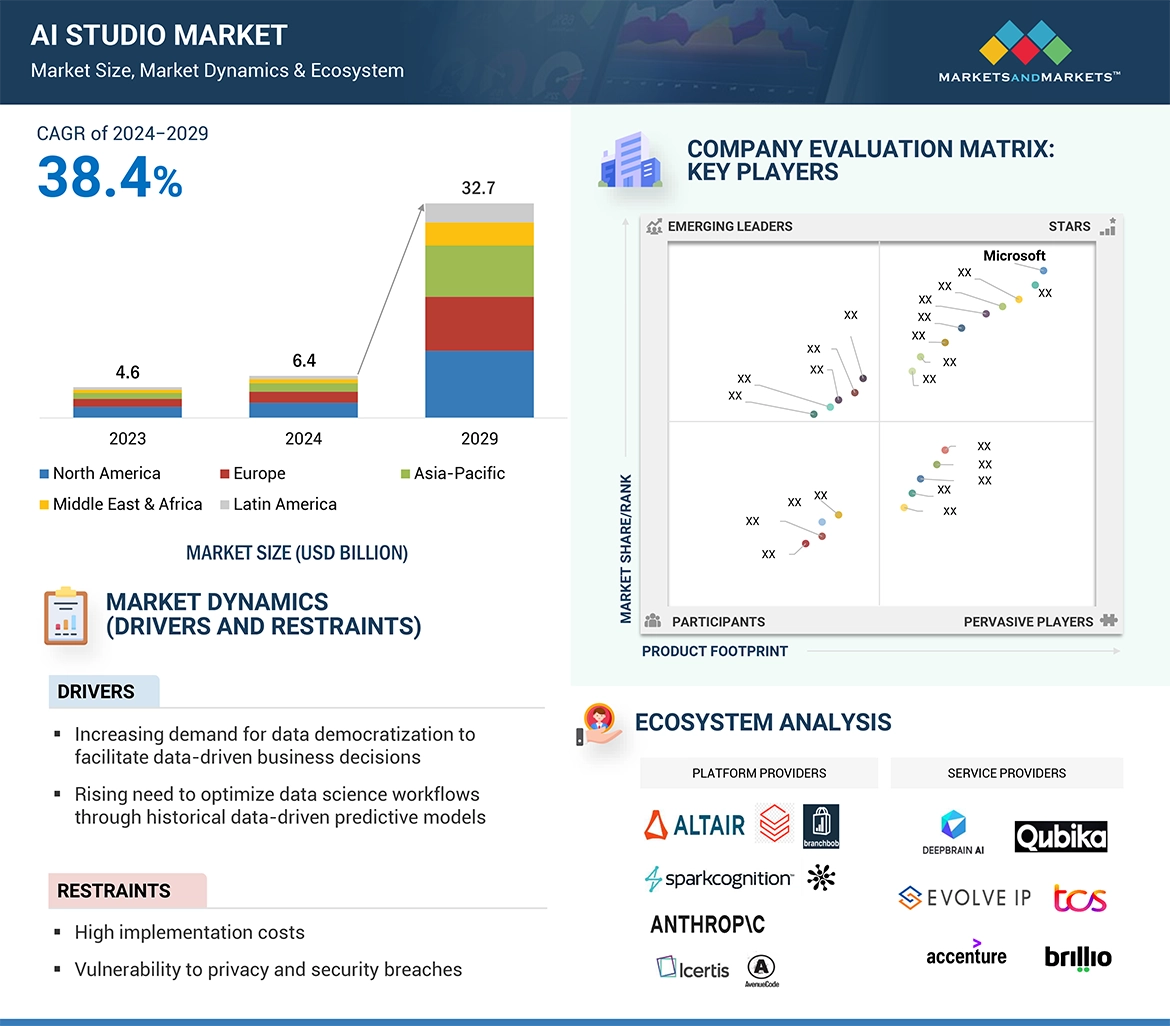
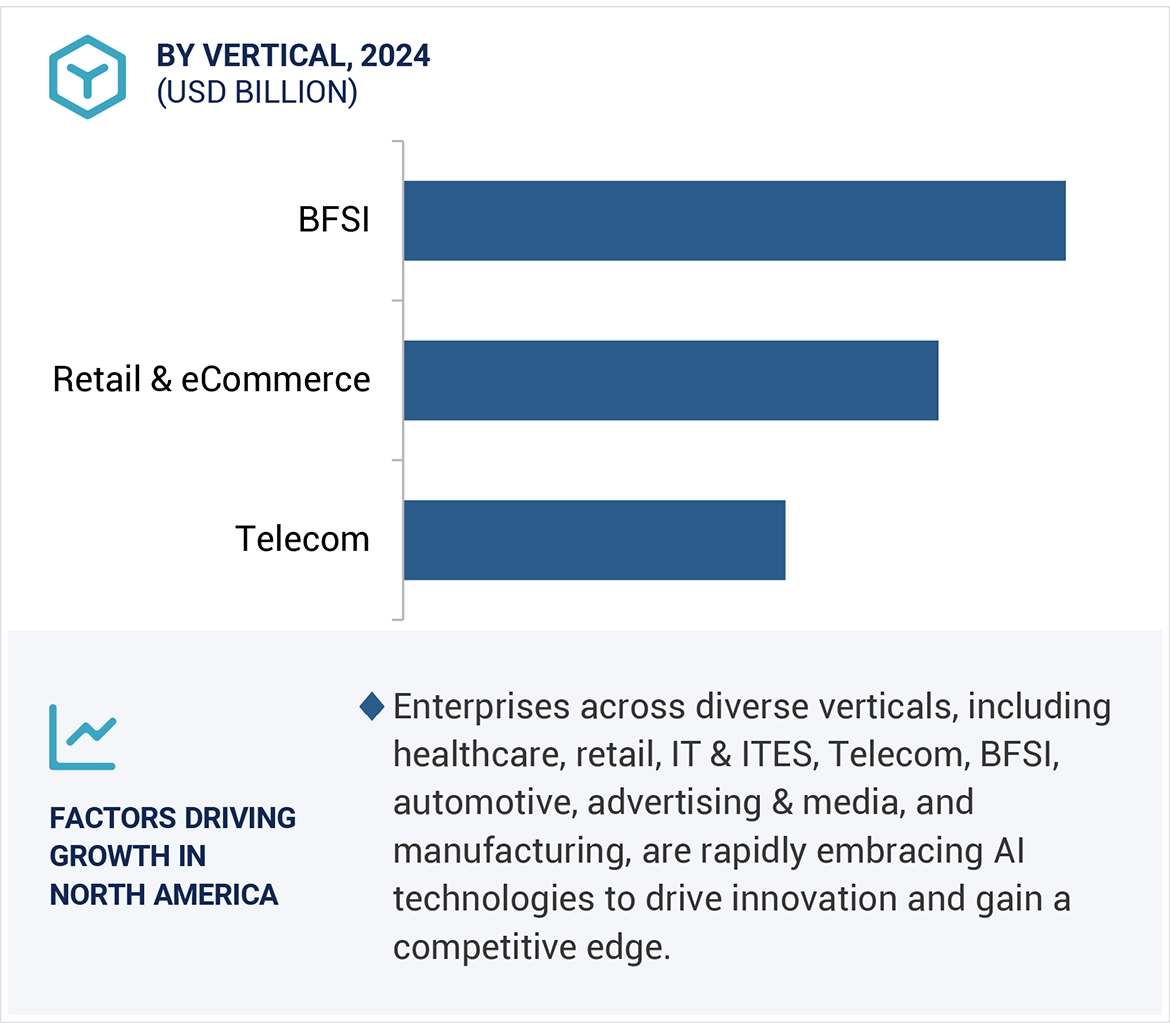
  • To define, describe, and predict the AI Studio market by offering (software [by type, deployment mode, and user interface] and services), data modality, application, vertical, and region
  • To provide detailed information related to major factors (drivers, restraints, opportunities, and industry-specific challenges) influencing the market growth
  • To analyze the micro markets with respect to individual growth trends, prospects, and their contributions to the total market
  • To analyze the opportunities in the market for stakeholders by identifying the high-growth segments of the AI Studio market
  • To analyze opportunities in the market and provide details of the competitive landscape for stakeholders and market leaders
  • To forecast the market size of five main regions: North America, Europe, Asia Pacific, the Middle East & Africa, and Latin America
  • To profile key players and comprehensively analyze their market rankings and core competencies
  • To analyze competitive developments, such as partnerships, new product launches, and mergers & acquisitions, in the AI Studio market
  • To analyze the impact of the recession across all regions in the AI Studio market

Available Customizations

With the given market data, MarketsandMarkets offers customizations as per your company’s specific needs. The following customization options are available for the report:

Product Analysis

  • Product quadrant, which gives a detailed comparison of the product portfolio of each company.

Geographic Analysis

  • Further breakup of the North American AI Studio market
  • Further breakup of the European AI Studio market
  • Further breakup of the Asia Pacific AI Studio market
  • Further breakup of the Middle Eastern & African AI Studio market
  • Further breakup of the Latin America AI Studio market

Company Information

  • Detailed analysis and profiling of additional market players (up to five)
Custom Market Research Services

We will customize the research for you, in case the report listed above does not meet with your exact requirements. Our custom research will comprehensively cover the business information you require to help you arrive at strategic and profitable business decisions.

Request Customization
Report Code
TC 9034
Published ON
May, 2024
Choose License Type
BUY NOW
  • SHARE
X
Request Customization
Speak to Analyst
Speak to Analyst
OR FACE-TO-FACE MEETING
PERSONALIZE THIS RESEARCH
  • Triangulate with your Own Data
  • Get Data as per your Format and Definition
  • Gain a Deeper Dive on a Specific Application, Geography, Customer or Competitor
  • Any level of Personalization
REQUEST A FREE CUSTOMIZATION
LET US HELP YOU!
  • What are the Known and Unknown Adjacencies Impacting the AI Studio Market
  • What will your New Revenue Sources be?
  • Who will be your Top Customer; what will make them switch?
  • Defend your Market Share or Win Competitors
  • Get a Scorecard for Target Partners
CUSTOMIZED WORKSHOP REQUEST
  • Call Us
  • +1-888-600-6441 (Corporate office hours)
  • +1-888-600-6441 (US/Can toll free)
  • +44-800-368-9399 (UK office hours)
CONNECT WITH US
ABOUT TRUST ONLINE
©2024 MarketsandMarkets Research Private Ltd. All rights reserved
DMCA.com Protection Status Website Feedback