To ascertain the present market size of air circuit breakers, a comprehensive methodology was employed. The process involved extensive secondary research to collect data on the market and its associated sectors. These insights were subsequently corroborated through primary research, which entailed consultations with industry experts spanning the entire value chain. The assessment utilized a combination of top-down and bottom-up approaches to determine the overall market size. Furthermore, for specific segments and subsegments, market segmentation and data triangulation methods were applied to calculate their respective market sizes.
Secondary Research
In this research study, an extensive array of secondary sources was harnessed, encompassing directories, databases, and esteemed references like Hoover's, Bloomberg BusinessWeek, Factiva, World Bank, US Department of Energy (DOE), and International Energy Agency (IEA). These sources played a pivotal role in amassing invaluable data for a thorough examination of the worldwide circuit breaker market, spanning technical, market-oriented, and commercial dimensions. Further secondary sources encompassed annual reports, press releases, investor presentations, white papers, accredited publications, articles by reputable authors, industry associations, trade directories, and database resources.
Primary Research
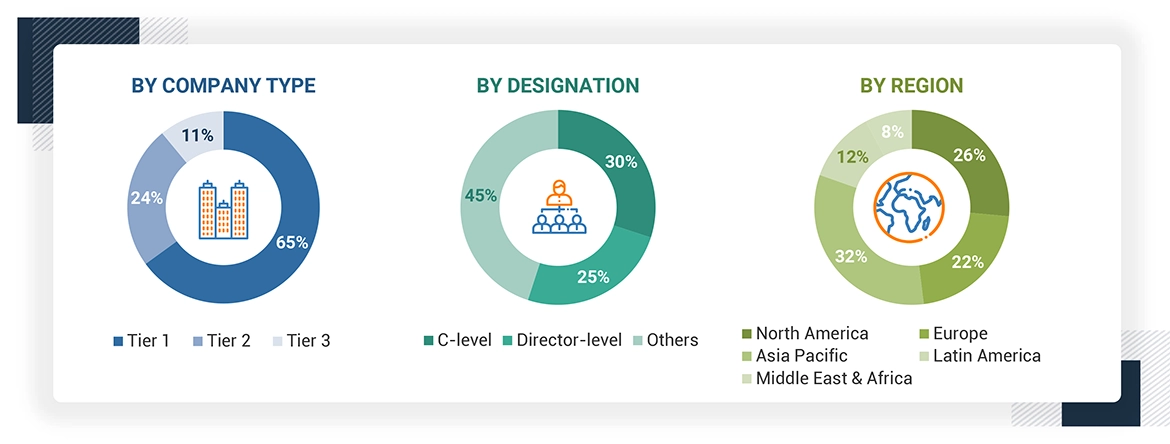
The air circuit breakers market comprises a diverse array of stakeholders, encompassing public and private electric utilities, distribution companies, manufacturers of air circuit breakers, dealers, suppliers, component manufacturers for air circuit breakers, consulting firms specializing in the energy and power sector, and various others. To gain comprehensive insights into the market dynamics, primary research involved interviews with stakeholders representing both the supply and demand sides. These primary sources offered qualitative and quantitative perspectives on the market. The primary respondents were categorized as follows
About the assumptions considered for the study, To know download the pdf brochure
Market Size Estimation
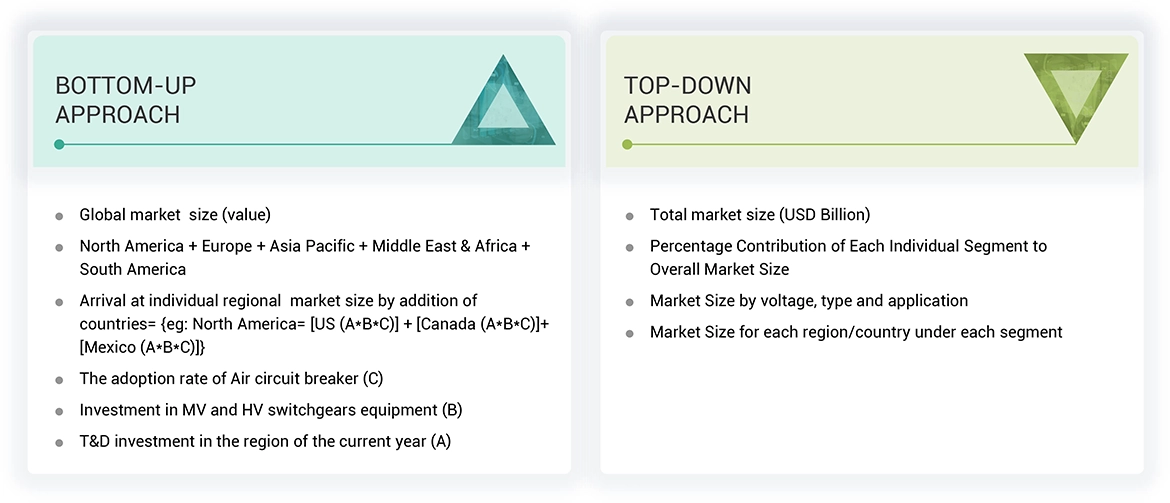
The research approach used to assess the dimensions of the worldwide air circuit breaker market and its related submarkets combines top-down and bottom-up methodologies. These methods were thoroughly utilized to determine the dimensions of various subsegments within the market. The research process encompasses the following fundamental stages
Data Triangulation
Following the determination of the overall market size, as outlined in the earlier explained market size estimation methods, the market was further subdivided into segments and subsegments. To complete the comprehensive market analysis and obtain precise statistics for each market segment and subsegment, the research employed data triangulation and market breakdown techniques whenever relevant. Data triangulation involves a thorough examination of various factors and trends from both the demand and supply perspectives to ensure the accuracy and reliability of the data and findings.
Market Definition
An air circuit breaker (ACB) is an electrical switching device designed to provide protection and control in electrical power distribution systems. It is primarily used to interrupt or disconnect electrical circuits when a fault, such as overcurrent or short circuit, occurs. Air circuit breakers operate by using compressed air as the arc quenching medium to extinguish electrical arcs generated during a fault. These devices are commonly employed in low-voltage and medium-voltage electrical systems to ensure the safety of electrical equipment, prevent damage, and maintain the reliability of power distribution. Air circuit breakers come in various sizes and configurations to meet the specific protection and control needs of different applications in industries, commercial buildings, and residential settings.
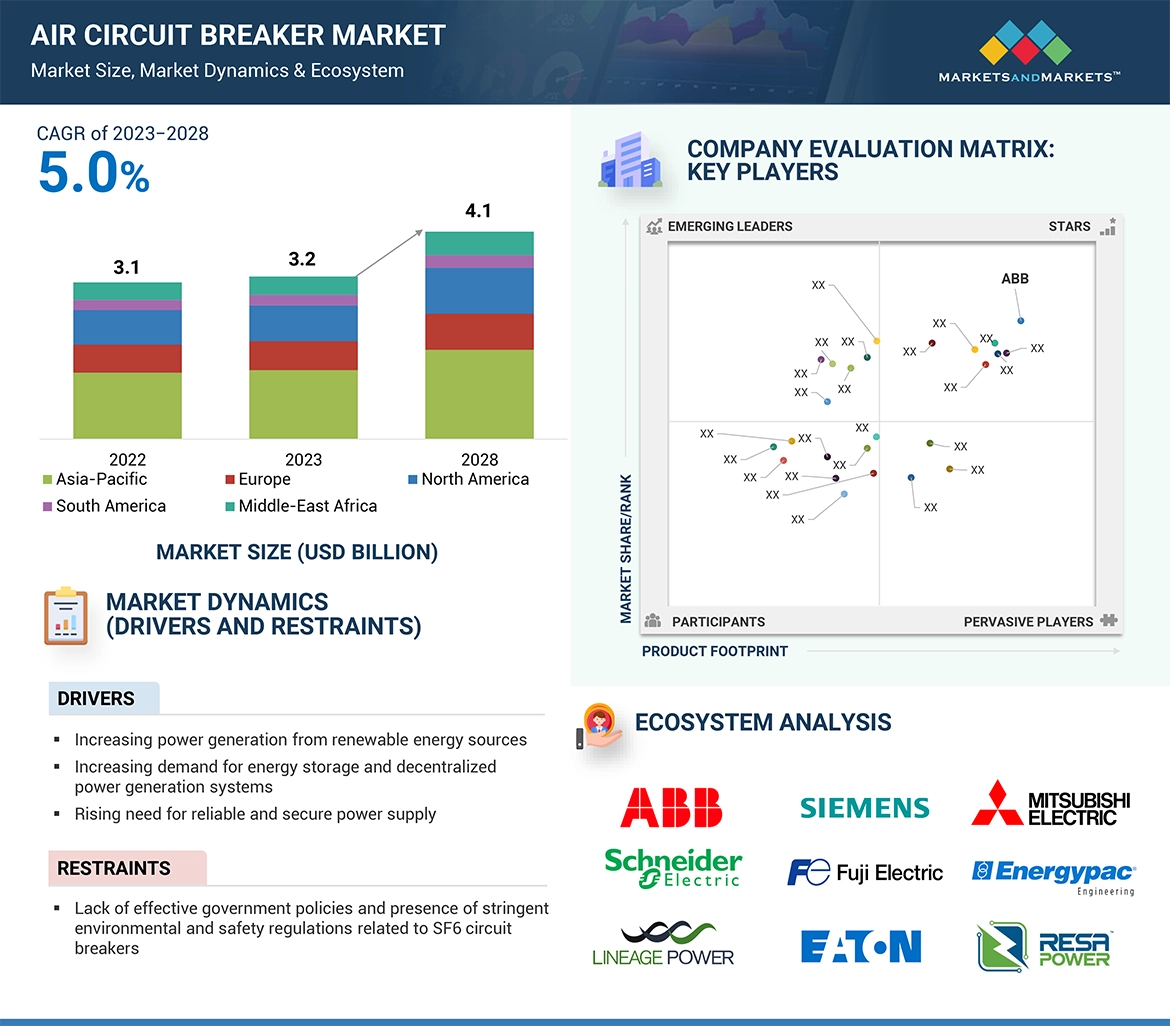
The Asia Pacific region is poised to experience the swiftest expansion in the air circuit breakers market during the forecast period. This surge is attributed to the rapid pace of industrialization and urban development in the region. Furthermore, increased investments in renewable energy ventures are expected to fuel the demand for air circuit breakers in Asia Pacific. Globally, the air circuit breakers market is anticipated to maintain stable growth in the coming years. Rising demand from various sectors, such as power generation, transmission, distribution, and industrial applications, is projected to be a driving force behind market expansion. Additionally, the increasing adoption of smart air circuit breakers is expected to usher in fresh opportunities for market participants.
Key Stakeholders
-
Government Utility Providers
-
Independent Power Producers
-
Circuit Breaker manufacturers
-
Power equipment and garden tool manufacturers
-
Consulting companies in the energy & power sector
-
Distribution utilities
-
Government and research organizations
-
Organizations, forums, and associations
-
Raw material suppliers
-
State and national regulatory authorities
-
Switchgear manufacturers, distributors, and suppliers
-
Switchgear and circuit breaker original equipment manufacturers (OEMs)
Report Objectives
-
To define, describe, and analyze the global market for air circuit breakers based on type, voltage, and application.
-
To provide thorough information on the key factors (drivers, restraints, opportunities, and challenges) affecting the growth of the circuit breakers market.
-
To strategically examine the air circuit breakers market with regard to distinct growth trends, prospects, and market contributions made by each segment.
-
To assess the effects of the recession on the market in order to calculate the market's size.
-
To evaluate market opportunities for stakeholders and specifics of a competitive environment for market leaders
-
To forecast the market growth for circuit breakers in relation to the major geographical areas (Asia Pacific, Europe, North America, South America, the Middle East, and Africa)
-
To comprehensively analyze each player's market share and core competencies and strategically profile the major players.
-
To monitor and assess market competition developments, such as new product launches, contracts and agreements, investments and expansions, and mergers and acquisitions
Available Customizations
With the given market data, MarketsandMarkets offers customizations as per the client’s specific needs. The following customization options are available for this report:
Geographic Analysis
Further breakdown of region or country-specific analysis
Company Information
Detailed analyses and profiling of additional market players (up to 5)


 HIGHEST CAGR MARKET IN 2022
 CHINA FASTEST GROWING MARKET IN THE REGION
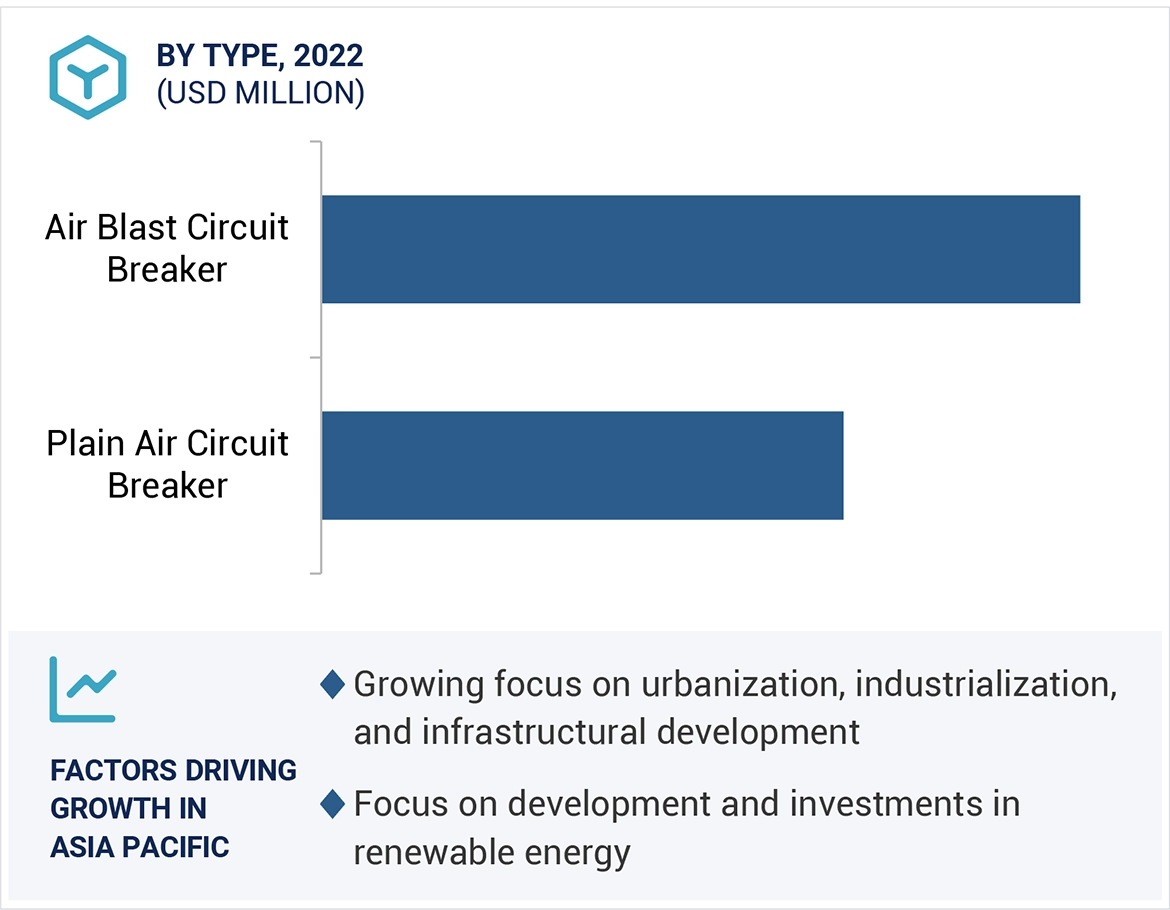


Growth opportunities and latent adjacency in Air Circuit Breaker Market