The study involved major activities in estimating the current size of the Air Quality Control Systems market. Exhaustive secondary research was done to collect information on the peer and parent markets. The next step was to validate these findings, assumptions, and sizing with industry experts across the value chain through primary research. Both top-down and bottom-up approaches were employed to estimate the complete market size. Thereafter, market breakdown and data triangulation were used to estimate the market size of the segments and subsegments.
Secondary Research
This research study on the Air Quality Contro AIR QUALITY CONTROL SYSTEM MARKET l System market involved the use of extensive secondary sources, directories, and databases, such as US Department of Energy, US Environmental Protection Agency (EPA), Environment and Climate Change Canada (ECCC), Secretariat of Environment and Natural Resources (SEMARNAT), Federal Environment Agency (Umweltbundesamt - UBA), Ministry of Ecological Transition (MTE) & French Associations for Air Monitoring (AASQA), National Air Quality Cooperation Programme (NSL), Ministry of Ecology & Environment Ministry of Environment, Forest and Climate Change, Central Pollution Control Board (CPCB), National Environment Protection Council (NEPC), Ministério do Meio Ambiente (MMA) - Ministry of Environment, Brazilian Institute of Environment and Renewable Natural Resources, South African National Accreditation System (SANAS), to identify and collect information useful for a technical, market-oriented, and commercial study of the global Air Quality Control Systems market. The other secondary sources included annual reports, press releases & investor presentations of companies, white papers, certified publications, articles by recognized authors, manufacturer associations, trade directories, and databases.
Primary Research
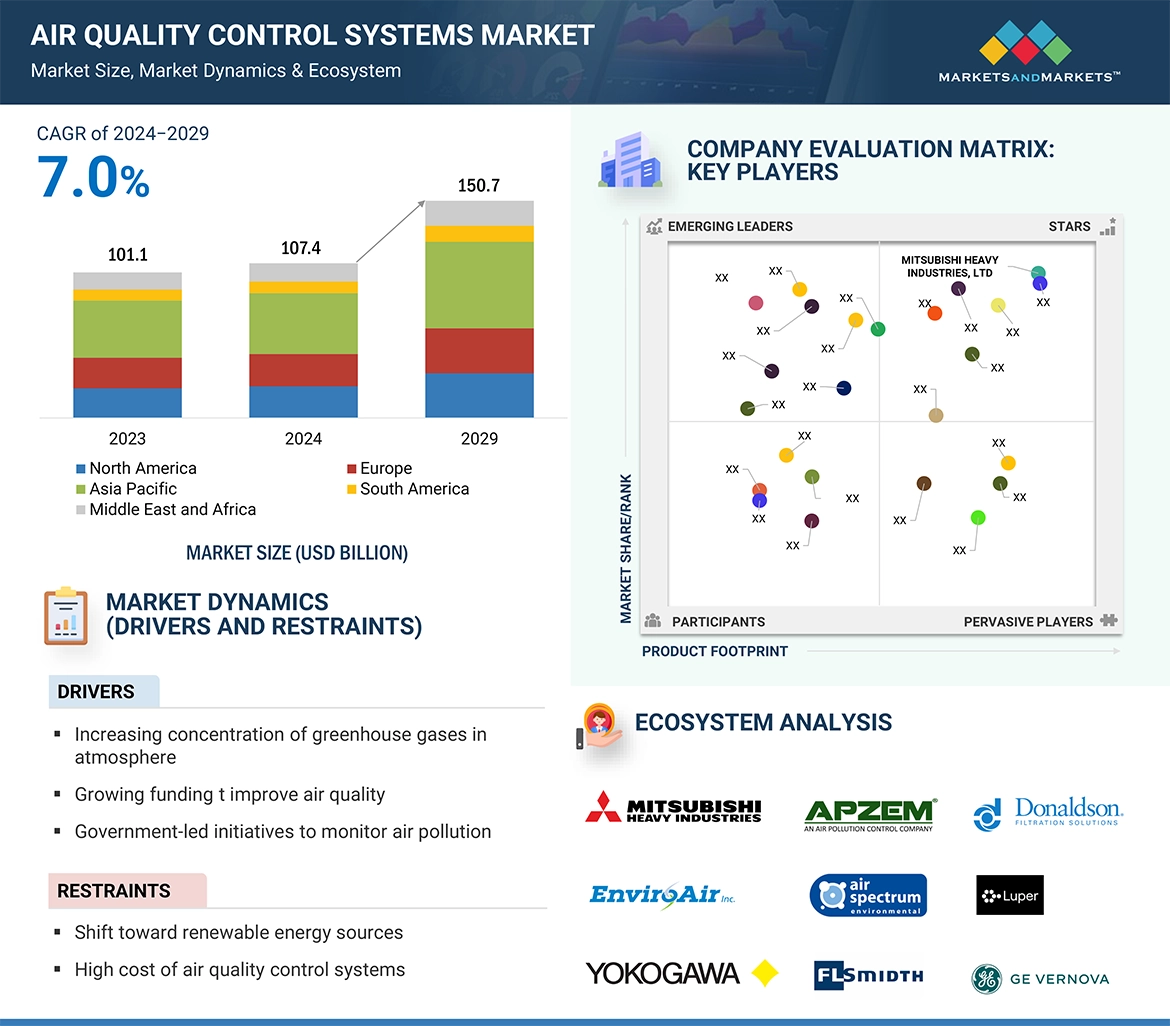
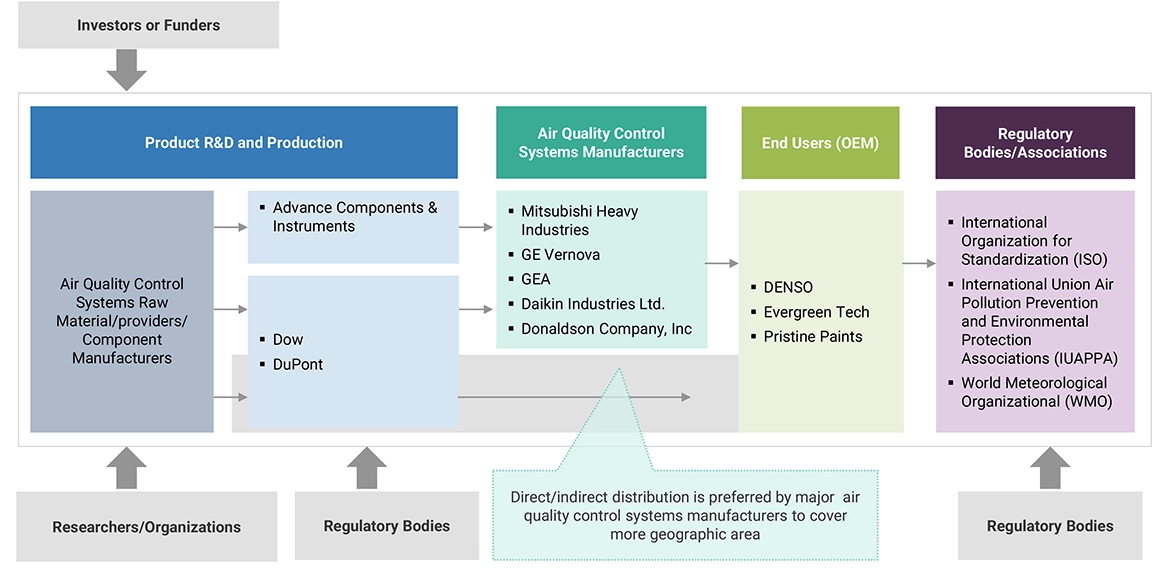
The Air Quality Control Systems market comprises several stakeholders such as AQCS manufacturers, manufacturers of subcomponents of AQCS, manufacturing technology providers, and technology support providers in the supply chain. An air quality control system (AQCS) is a set of technologies used to minimize the release of pollutants into the atmosphere. These systems are typically used in industrial facilities, such as power plants, factories, and refineries, to reduce emissions that can harm human health and the environment. It addresses the escalating global concerns regarding air pollution, the associated health risks of poor air quality, and the need to comply with stringent environmental regulations.

To know about the assumptions considered for the study, download the pdf brochure
Market Size Estimation
Both top-down and bottom-up approaches were used to estimate and validate the total size of the Air Quality Control System market. These methods were also used extensively to estimate the size of various subsegments in the market. The research methodology used to estimate the market size includes the following:
-
The key players in the industry and market have been identified through extensive secondary research, and their market share in the respective regions have been determined through both primary and secondary research.
-
The industry’s value chain and market size, in terms of value, have been determined through primary and secondary research processes.
-
All percentage shares, splits, and breakdowns have been determined using secondary sources and verified through primary sources.
Global Air Quality Control Systems Market Size: Top-down Approach

To know about the assumptions considered for the study, Request for Free Sample Report
Global Air Quality Control Systems Market Size: Bottom-Up Approach

Data Triangulation
After arriving at the overall market size from the estimation process explained above, the total market has been split into several segments and subsegments. To complete the overall market engineering process and arrive at the exact statistics for all the segments and subsegments, the data triangulation and market breakdown processes have been employed, wherever applicable. The data has been triangulated by studying various factors and trends from both the demand- and supply sides. Along with this, the market has been validated using both the top-down and bottom-up approaches.
Market Definition
The air quality control systems market refers to the sector encompassing the production, distribution, and utilization of technologies and solutions aimed at controlling, improving and maintaining the quality of air in various environments. This market includes a wide range of products and services such as air pollution control devices, emission control systems, air purifiers, ventilation systems, and pollution control equipment utilized in industrial, commercial, and residential industry. It caters to the increasing global concern regarding air pollution, health hazards associated with poor air quality, and regulatory standards aimed at mitigating air pollutants. The market is driven by factors such as urbanization, industrialization, stringent environmental regulations, growing awareness about health impacts of air pollution, and technological advancements in air quality control solutions.
Key Stakeholders
-
Air quality control system equipment manufacturers
-
Air quality control system unit manufacturers
-
Air quality control system unit distributors and suppliers
-
Research institutes and companies.
-
Hotels, hospitals, care homes, office buildings, retail stores, and other utilities
-
Industry, energy, and environmental associations
-
Government and research organizations
Objectives of the Study
-
To define, describe, segment, and forecast the Air Quality Control System market, by pollutant type, technology, product type, and end user, in terms of value.
-
To forecast the market size for five key regions: North America, South America, Europe, Asia Pacific, and Middle East & Africa, along with their key countries
-
To provide detailed information about the key drivers, restraints, opportunities, and challenges influencing the growth of the market
-
To strategically analyze the subsegments with respect to individual growth trends, prospects, and contributions of each segment to the overall market size
-
To analyze market opportunities for stakeholders and the competitive landscape of the market
-
To strategically profile the key players and comprehensively analyze their market shares and core competencies
-
To analyze competitive developments, such as deals and agreements in the market
Available Customizations:
With the given market data, MarketsandMarkets offers customizations as per the client’s specific needs. The following customization options are available for this report:
Geographic Analysis
-
Further breakdown of region or country-specific analysis
Company Information
-
Detailed analyses and profiling of additional market players (up to 5)


Growth opportunities and latent adjacency in Air Quality Control Systems Market