Airport Automation Market

Airport Automation Market by Automation Level (Level 1.0, Level 2.0, Level 3.0, Level 4.0), Application (BHS, Ground Transportation and Parking, Facility Management, Air Traffic Management, Others), System, Airport Side, Airport Size, End Market, and Region - Global Forecast to 2028

Report Code: AS 8882 Dec, 2023, by marketsandmarkets.com

[288 Pages Report] The Airport Automation Industry size is projected to grow from USD 5.8 Billion in 2023 to USD 7.7 Billion by 2028, at a Compound Annual Growth Rate (CAGR) of 5.8% from 2023 to 2028. Air travel has been steadily increasing, leading to a surge in the number of passengers passing through airports. To manage this growing demand, airports are turning to automation to optimize processes and reduce congestion.

Airport Automation Market

Airport Automation Market

Airport Automation Market Forecast to 2028

To know about the assumptions considered for the study, Request for Free Sample Report

Airport Automation Market Dynamics

Driver: Growing Emphasis on Customer-centric Strategies

Airports and airlines are recognizing the paramount importance of prioritizing passenger experience and satisfaction. By adopting automated technologies, such as self-service check-in kiosks, streamlined security procedures, and personalized travel notifications through mobile apps, airports can enhance the overall passenger journey.

Customer-centric automation not only reduces waiting times and improves efficiency but also empowers travelers to have greater control over their travel experience. This emphasis on providing a seamless, hassle-free journey can lead to increased customer loyalty, positive word-of-mouth, and a competitive advantage for airports in attracting more airlines and passengers. As the aviation industry becomes increasingly customer-oriented, the adoption of airport automation solutions becomes a strategic imperative for meeting evolving traveler expectations and demands.

The increasing utilization of self-service technologies, such as self-check-in kiosks, automated baggage drop-off, and biometric-enabled boarding, is propelling the expansion of the airport automation market. Passengers' growing preference for seamless and efficient travel experiences has prompted airports to implement these user-friendly and time-saving solutions. By offering passengers greater control over their check-in and boarding processes, self-service technologies enhance overall airport efficiency and passenger satisfaction. As a result, airports and airlines are increasingly investing in automation solutions to meet the rising demand for self-service capabilities and to stay competitive in the evolving aviation industry.

Restraints: Enhancing Cybersecurity to Foster Trust in Automation

Cybersecurity stands as a critical restraint to the seamless implementation of airport automation. To foster trustworthy automation, it is imperative to prioritize and enhance cybersecurity measures. Robust security protocols and advanced technologies must be in place to safeguard automated systems from potential cyber threats and data breaches. By reinforcing cybersecurity practices, the aviation industry can instill confidence in passengers and stakeholders regarding the reliability and integrity of automated processes, facilitating the successful integration of automation in airport operations.

As airports increasingly rely on automation, the risk of cyber threats and data breaches becomes a significant concern. Securing automated systems and protecting passenger data requires robust cybersecurity measures. Actions must be taken to invest in advanced cybersecurity technologies, conduct regular security audits, and implement stringent data protection protocols to build trust and confidence among passengers and stakeholders.

Opportunity: Rising Utilization of Data-backed Decision Making

The increasing adoption of data-backed decision making presents a promising avenue for enhancing airport operations and passenger experiences. By leveraging advanced data analytics and artificial intelligence, airports can collect and analyze vast amounts of data from various sources, including passenger flows, aircraft movements, weather patterns, and operational processes. This data-driven approach enables airports to make informed decisions, optimize resource allocation, and proactively identify potential bottlenecks and issues before they escalate. With data-driven insights, airports can efficiently manage capacity, streamline security procedures, and improve overall operational efficiency. Data-driven decision making empowers airports to personalize passenger services, predict passenger needs, and offer tailored experiences, ultimately boosting customer satisfaction and loyalty. The ability to harness real-time data and historical trends also enables airports to adapt swiftly to changing circumstances, such as unexpected flight delays or changes in passenger demands.

Embracing data-driven decision making in airport automation fosters a culture of continuous improvement and innovation. By continually refining and optimizing processes based on data insights, airports can remain competitive, resilient, and well-equipped to meet the evolving demands of the aviation industry and its passengers.

Challenge: Gradual Incorporation of Cutting-edge Technologies Due to Significant Capital Expenditures

One of the challenges faced in airport automation is the slow integration of innovative technologies. This is primarily attributed to the high capital expenditure required for implementing and adopting advanced automation solutions. The cost of acquiring and deploying state-of-the-art technologies, such as advanced robotic systems, biometric authentication, and sophisticated AI-driven processes, can be substantial. As a result, airports and airlines may face financial constraints in rapidly adopting these innovations. This challenge necessitates careful planning, cost-benefit analyses, and strategic investment decisions to ensure a steady and sustainable integration of automation while maximizing the long-term benefits for all stakeholders involved in the aviation industry.

Airport Automation Market Ecosystem

Prominent companies in this market include well-established, financially stable manufacturers of airport automation. These companies have established a strong foothold in the market through diversified product portfolios, advanced technologies, and robust global sales and marketing networks. The prominent companies are Daifuku Co. Ltd. (Japan), Collins Aerospace (US), Siemens (Germany), and Amadeus IT Group (Spain). Airport Operators, Air Navigation Solution providers, Airport Solution integrators, Aviation Regulatory Bodies are some of the end users of these solutions.

Airport Automation Market by Ecosystem

Automation and Control Segment to Dominate Market Share During the Forecast Period

Based on System, the Airport Automation Market has been segmented into Data acquisition and Communication, Automation and Control, Data Storage, and System and Software. The integration of advanced technologies, including robotics and AI, into airport automation systems enhances the capabilities of HMIs and AGVs. These innovations contribute to more intelligent decision-making and responsive airport operations.

Air Traffic Management to Hold Large Market Share in 2023

Based application, air traffic management segment to hold large market share in the Airport Automation market. Automated systems provide air traffic controllers with real-time information and contribute to reducing the risk of human error. For instance, automated conflict resolution systems can detect and alert controllers to potential conflicts between aircraft, enhancing overall safety.

The Greenfield Segment is to Witness Grow the Highest During the Forecast Period

Based on end market, greenfield segment witnessing highest growth during forecast period. Greenfield projects provide a unique opportunity for airports to incorporate automation into their design and planning from the outset. This integrated approach allows for the seamless incorporation of automated systems, such as baggage handling, security, and passenger processing, into the airport infrastructure.

Asia Pacific is Projected to Witness the Largest Market Share During the Forecast Period

Asia Pacific leads the Airport Automation Market due presence of key players, automation solution manufacturers, and component manufacturers, which are a few factors expected to drive the growth of the Airport Automation Market in the region. These players invest in developing technological advanced electric boating solutions to improve efficiency and reliability. Major manufacturers and suppliers of Airport Automation in this region include Daifuku Co. Ltd. (Japan), Collins Aerospace (US), Siemens (Germany), and Amadeus IT Group (Spain)

Airport Automation Market by Region

Airport Automation Market by Region

To know about the assumptions considered for the study, download the pdf brochure

Airport Automation Industry Companies - Top
Key Market Players

The  Airport Automation Companies are dominated by globally established players such as Daifuku Co. Ltd. (Japan), Collins Aerospace (US), Siemens (Germany), and Amadeus IT Group (Spain)

Get online access to the report on the World's First Market Intelligence Cloud

  • Easy to Download Historical Data & Forecast Numbers
  • Company Analysis Dashboard for high growth potential opportunities
  • Research Analyst Access for customization & queries
  • Competitor Analysis with Interactive dashboard
  • Latest News, Updates & Trend analysis
Request Sample

Scope of the Report

Report Metric

Details

Estimated Market Size

USD 5.8 Billion in 2023

Projected Market Size

USD 7.7 Billion by 2028

Growth Rate

CAGR of 5.8%

Market Size Available for Years

2019-2028

Base Year Considered

2022

Forecast Period

2023-2028

Forecast Units

Value (USD Million/Billion)

Segments  Covered

System, Application, Airport Side, Airport Size, End Market, Automation Level

Geographies Covered

North America, Europe, Asia Pacific, Middle East Rest of the World

Companies Covered

Daifuku Co. Ltd. (Japan), Collins Aerospace (US), Siemens (Germany), and Amadeus IT Group (Spain).

Airport Automation Market Highlights

This research report categorizes the Airport Automation Market  based on System, Application, Airport Side, Airport Size, End Market, Automation Level and Region

Segment

Subsegment

System

  • Data Acquisition and Communication
  • Automation and Control
  • Data Storage
  • Software & Solutions

Application

  • Baggage Handling and Tracking
  • Ground Transportation and Parking
  • Retail and Dining
  • Facility Management
  • Passenger Services and Assistance
  • Emergency Response and Safety
  • Ground Support Equipment
  • Air Traffic Management
  • Airfield Management
  • Others

Airport Side

  • Land Side
  • Air Side

Airport Size

  • Large
  • Medium
  • Small

End Market

  • Greenfield
  • Brownfield

Automation Level

  • Level 1.0
  • Level 2.0
  • Level 3.0
  • Level 4.0

Recent Developments

  • In June 2023, Pristina International Airport is implementing Amadeus' Airport Management Suite (AMS) to effectively plan flight schedules up to one year ahead. The new operational systems will distribute and regularly update crucial flight data at strategic points throughout the airport. Additionally, they will introduce advanced optimization algorithms to enhance the management of commonly used airport facilities such as parking areas, departure gates, and check-in counters, benefiting the airlines operating from Pristina.
  • In May 2023, Siemens Logistics GmbH a subsidiary company of Siemens has secured a contract to provide advanced baggage handling solutions for Terminal 2 at Hefei Xinqiao Airport in eastern China. In addition to VarioStore early bag storage solution, the innovative BagIQ software will be implemented to optimize system control.
  • In August 2023, Vanderlande and Avinor, the airport operator, have established an innovation partnership with the aim of achieving full automation in the final phase of baggage handling. Vanderlande will provide two innovative solutions: BAGLOAD for integrated robot loading and FLEET Batch for ULD transportation. These solutions will undergo testing at Oslo Gardermoen Airport in Norway. The primary objective of this partnership is to improve the efficiency and dependability of baggage handling, which will have positive implications for the entire airport industry.

Frequently Asked Questions (FAQs) Addressed by the Report:

To speak to our analyst for a discussion on the above findings, click Speak to Analyst

TABLE OF CONTENTS
 
1 INTRODUCTION (Page No. - 29)
    1.1 STUDY OBJECTIVES 
    1.2 MARKET DEFINITION 
    1.3 STUDY SCOPE 
           1.3.1 MARKETS COVERED
           1.3.2 REGIONAL SCOPE
    1.4 YEARS CONSIDERED 
    1.5 CURRENCY CONSIDERED 
           TABLE 1 USD EXCHANGE RATES
    1.6 INCLUSIONS AND EXCLUSIONS 
           TABLE 2 AIRPORT AUTOMATION MARKET: INCLUSIONS AND EXCLUSIONS
    1.7 STAKEHOLDERS 
 
2 RESEARCH METHODOLOGY (Page No. - 34)
    2.1 RESEARCH DATA 
           FIGURE 1 RESEARCH PROCESS FLOW
           FIGURE 2 RESEARCH DESIGN
           2.1.1 SECONDARY DATA
                    2.1.1.1 Secondary sources
           2.1.2 PRIMARY DATA
                    2.1.2.1 Primary sources
                               2.1.2.1.1 Breakdown of primary interviews
                                            FIGURE 3 BREAKDOWN OF PRIMARY INTERVIEWS: BY COMPANY TYPE, DESIGNATION, AND REGION
    2.2 FACTOR ANALYSIS 
           2.2.1 INTRODUCTION
           2.2.2 DEMAND-SIDE INDICATORS
                    2.2.2.1 Increasing demand for airport infrastructure development to facilitate seamless passenger experience
           2.2.3 SUPPLY-SIDE INDICATORS
                    2.2.3.1 Development of advanced airport automation technologies by manufacturers
    2.3 MARKET SIZE ESTIMATION 
           2.3.1 BOTTOM-UP APPROACH
                    2.3.1.1 Evaluation of airport automation market
                               FIGURE 4 MARKET SIZE ESTIMATION: BOTTOM-UP APPROACH (DEMAND SIDE)
           2.3.2 TOP-DOWN APPROACH
                    FIGURE 5 MARKET SIZE ESTIMATION: TOP-DOWN APPROACH (SUPPLY SIDE)
    2.4 MARKET BREAKDOWN AND DATA TRIANGULATION 
           FIGURE 6 DATA TRIANGULATION METHODOLOGY
    2.5 RECESSION IMPACT ANALYSIS 
           FIGURE 7 AIRPORT AUTOMATION SYSTEMS: AIR PASSENGER FOOTPRINT AND REVENUE PER KILOMETER (RPK) YOY GROWTH, 2022
           2.5.1 GROWTH RATE ASSUMPTIONS
    2.6 RESEARCH ASSUMPTIONS 
           FIGURE 8 PARAMETRIC ASSUMPTIONS FOR MARKET STUDY
    2.7 RISKS ANALYSIS 
    2.8 RESEARCH LIMITATIONS 
 
3 EXECUTIVE SUMMARY (Page No. - 46)
    FIGURE 9 LANDSIDE SEGMENT TO LEAD MARKET IN 2023
    FIGURE 10 BROWNFIELD SEGMENT TO ACCOUNT FOR LARGER MARKET SHARE THAN GREENFIELD SEGMENT IN 2023
    FIGURE 11 MIDDLE EAST TO BE FASTEST-GROWING REGIONAL MARKET DURING FORECAST PERIOD
 
4 PREMIUM INSIGHTS (Page No. - 48)
    4.1 ATTRACTIVE OPPORTUNITIES FOR PLAYERS IN AIRPORT AUTOMATION MARKET 
           FIGURE 12 INCREASING GLOBAL AIR PASSENGER TRAFFIC TO DRIVE MARKET
    4.2 AIRPORT AUTOMATION MARKET, BY SYSTEM 
           FIGURE 13 AUTOMATION AND CONTROL SEGMENT TO LEAD MARKET DURING FORECAST PERIOD
    4.3 AIRPORT AUTOMATION MARKET, BY APPLICATION 
           FIGURE 14 AIR TRAFFIC MANAGEMENT SEGMENT TO LEAD MARKET DURING FORECAST PERIOD
    4.4 AIRPORT AUTOMATION MARKET, BY COUNTRY 
           FIGURE 15 GERMANY TO BE FASTEST-GROWING COUNTRY-LEVEL MARKET DURING FORECAST PERIOD
 
5 MARKET OVERVIEW (Page No. - 51)
    5.1 INTRODUCTION 
    5.2 MARKET DYNAMICS 
           FIGURE 16 AIRPORT AUTOMATION MARKET: DRIVERS, RESTRAINTS, OPPORTUNITIES, AND CHALLENGES
           5.2.1 DRIVERS
                    5.2.1.1 Escalating demand for real-time data
                    5.2.1.2 Growing emphasis on customer-centric strategies
                    5.2.1.3 Increasing adoption of automated vehicles within airport premises
                    5.2.1.4 Rising integration of advanced connectivity technologies in airport operations
                    5.2.1.5 Growing need to enhance air traffic management and optimize capacity
           5.2.2 RESTRAINTS
                    5.2.2.1 High investment in cybersecurity measures
                    5.2.2.2 Securing robustness and reliability of automation solutions
                    5.2.2.3 Absence of standardized regulations governing blockchain technology
           5.2.3 OPPORTUNITIES
                    5.2.3.1 Increasing integration of automation solutions to improve airport operations
                    5.2.3.2 Rising utilization of data-backed decision-making
           5.2.4 CHALLENGES
                    5.2.4.1 Slow integration of automation technologies due to requirement for high capital expenditures
                    5.2.4.2 Need for thorough understanding of passengers to efficiently adopt specific airport automation solutions
                    5.2.4.3 Simplifying automation system integration
    5.3 RECESSION IMPACT ANALYSIS 
           FIGURE 17 RECESSION IMPACT ANALYSIS
    5.4 VALUE CHAIN ANALYSIS 
           FIGURE 18 VALUE CHAIN ANALYSIS
           5.4.1 RAW MATERIAL
           5.4.2 R&D
           5.4.3 COMPONENT MANUFACTURING
           5.4.4 OEM
           5.4.5 END USER
           5.4.6 AFTER-SALES SERVICE
    5.5 ECOSYSTEM MAP 
           5.5.1 PROMINENT COMPANIES
           5.5.2 PRIVATE AND SMALL ENTERPRISES
           5.5.3 END USERS
                    FIGURE 19 ECOSYSTEM MAP
                    TABLE 3 ROLE OF KEY PLAYERS IN ECOSYSTEM
    5.6 TRENDS AND DISRUPTIONS IMPACTING CUSTOMER BUSINESS 
           FIGURE 20 REVENUE SHIFT FOR PLAYERS IN AIRPORT AUTOMATION MARKET
    5.7 PORTER’S FIVE FORCES ANALYSIS 
           FIGURE 21 PORTER’S FIVE FORCES ANALYSIS
           TABLE 4 IMPACT OF PORTER’S FIVE FORCES
           5.7.1 THREAT OF NEW ENTRANTS
           5.7.2 THREAT OF SUBSTITUTES
           5.7.3 BARGAINING POWER OF SUPPLIERS
           5.7.4 BARGAINING POWER OF BUYERS
           5.7.5 INTENSITY OF COMPETITIVE RIVALRY
    5.8 PRICING ANALYSIS 
           5.8.1 AVERAGE SELLING PRICE TREND OF KEY PLAYERS, BY SYSTEM
                    FIGURE 22 AVERAGE SELLING PRICE TREND OF KEY PLAYERS, BY SYSTEM
                    TABLE 5 AVERAGE SELLING PRICE RANGE: AIRPORT AUTOMATION MARKET, BY SYSTEM (USD)
           5.8.2 AVERAGE SELLING PRICE TREND, BY REGION
                    FIGURE 23 AVERAGE SELLING PRICE TREND, BY REGION, 2019–2022
                    TABLE 6 AIRPORT AUTOMATION MARKET: AVERAGE SELLING PRICE RANGE, BY REGION (USD)
    5.9 OPERATIONAL DATA 
           TABLE 7 AIRPORT AUTOMATION MARKET: NUMBER OF AIRPORTS, BY REGION (UNITS)
           FIGURE 24 GLOBAL AIRPORT INVESTMENT VS. AIRPORT AUTOMATION INVESTMENT
    5.10 TRADE DATA ANALYSIS 
           TABLE 8 COUNTRY-WISE IMPORTS, 2020–2022 (USD THOUSAND)
           TABLE 9 COUNTRY-WISE EXPORTS, 2020–2022 (USD THOUSAND)
    5.11 TARIFF AND REGULATORY LANDSCAPE 
           5.11.1 NORTH AMERICA
                    TABLE 10 NORTH AMERICA: REGULATORY BODIES, GOVERNMENT AGENCIES, AND OTHER ORGANIZATIONS
           5.11.2 EUROPE
                    TABLE 11 EUROPE: REGULATORY BODIES, GOVERNMENT AGENCIES, AND OTHER ORGANIZATIONS
           5.11.3 ASIA PACIFIC
                    TABLE 12 ASIA PACIFIC: REGULATORY BODIES, GOVERNMENT AGENCIES, AND OTHER ORGANIZATIONS
           5.11.4 MIDDLE EAST & AFRICA
                    TABLE 13 MIDDLE EAST & AFRICA: REGULATORY BODIES, GOVERNMENT AGENCIES, AND OTHER ORGANIZATIONS
           5.11.5 LATIN AMERICA
                    TABLE 14 LATIN AMERICA: REGULATORY BODIES, GOVERNMENT AGENCIES, AND OTHER ORGANIZATIONS
    5.12 KEY CONFERENCES AND EVENTS, 2023–2024 
           TABLE 15 AIRPORT AUTOMATION MARKET: KEY CONFERENCES AND EVENTS, 2023–2024
    5.13 USE CASE ANALYSIS 
           TABLE 16 AUTOMATED BAGGAGE HANDLING SYSTEMS
           TABLE 17 SELF-SERVICE CHECK-IN KIOSKS
           TABLE 18 AUTOMATED SECURITY SCREENING
           TABLE 19 FACIAL RECOGNITION BOARDING
    5.14 KEY STAKEHOLDERS AND BUYING CRITERIA 
           5.14.1 KEY STAKEHOLDERS IN BUYING PROCESS
                    FIGURE 25 INFLUENCE OF STAKEHOLDERS ON BUYING PROCESS FOR AIRPORT AUTOMATION SOLUTIONS, BY END USER
                    TABLE 20 INFLUENCE OF STAKEHOLDERS ON BUYING PROCESS FOR AIRPORT AUTOMATION SOLUTIONS, BY END USER (%)
           5.14.2 BUYING CRITERIA
                    FIGURE 26 KEY BUYING CRITERIA FOR AIRPORT AUTOMATION SOLUTIONS, BY END USER
                    TABLE 21 KEY BUYING CRITERIA FOR AIRPORT AUTOMATION SOLUTIONS, BY END USER
 
6 INDUSTRY TRENDS (Page No. - 75)
    6.1 INTRODUCTION 
    6.2 TECHNOLOGY TRENDS 
           FIGURE 27 TECHNOLOGY TRENDS IN AIRPORT AUTOMATION MARKET
           6.2.1 ROBOTICS AND AUTOMATION
           6.2.2 USE OF AI TOOLS IN AIRPORT AUTOMATION
           6.2.3 AUTONOMOUS SYSTEMS FOR ENHANCED AIRPORT OPERATIONS
           6.2.4 DECISION-MAKING IN AIRPORTS WITH ADVANCED DATA ANALYTICS AND LOCATION INTELLIGENCE
           6.2.5 AUGMENTED REALITY AND VIRTUAL REALITY
           6.2.6 CLOUD TECHNOLOGY
           6.2.7 5G TECHNOLOGY
           6.2.8 INTERNET OF THINGS
    6.3 IMPACT OF MEGATRENDS 
           6.3.1 ENHANCED FACILITY EFFICIENCY
           6.3.2 BLOCKCHAIN APPLICATIONS IN AIRPORT OPERATIONS
           6.3.3 CAPACITY EXPANSION
    6.4 PATENT ANALYSIS 
           FIGURE 28 PATENT ANALYSIS
           TABLE 22 PATENT REGISTRATIONS
    6.5 ROADMAP FOR AIRPORT AUTOMATION COMMERCIALIZATION 
           FIGURE 29 DEVELOPMENT POTENTIAL OF AIRPORT AUTOMATION MARKET FROM 2000 TO 2030
 
7 AIRPORT AUTOMATION MARKET, BY SYSTEM (Page No. - 84)
    7.1 INTRODUCTION 
           FIGURE 30 AIRPORT AUTOMATION MARKET, BY SYSTEM, 2023 VS. 2028
           TABLE 23 AIRPORT AUTOMATION MARKET, BY SYSTEM, 2019–2022 (USD MILLION)
           TABLE 24 AIRPORT AUTOMATION MARKET, BY SYSTEM, 2023–2028 (USD MILLION)
    7.2 DATA ACQUISITION AND COMMUNICATIONS 
           TABLE 25 AIRPORT AUTOMATION MARKET, BY DATA ACQUISITION AND COMMUNICATIONS, 2019–2022 (USD MILLION)
           TABLE 26 AIRPORT AUTOMATION MARKET, BY DATA ACQUISITION AND COMMUNICATIONS, 2023–2028 (USD MILLION)
           7.2.1 SENSOR NETWORKS
                    7.2.1.1 Growing need for real-time data analysis in airports to drive market
           7.2.2 COMMUNICATION INFRASTRUCTURE
                    7.2.2.1 Increasing demand for seamless and smooth data exchange to drive market
    7.3 AUTOMATION AND CONTROL 
           TABLE 27 AIRPORT AUTOMATION MARKET, BY AUTOMATION AND CONTROL, 2019–2022 (USD MILLION)
           TABLE 28 AIRPORT AUTOMATION MARKET, BY AUTOMATION AND CONTROL, 2023–2028 (USD MILLION)
           7.3.1 INDUSTRIAL AUTOMATION DEVICES
                    7.3.1.1 Increasing demand for automated operations to drive market
           7.3.2 END-POINT DEVICES
                    7.3.2.1 Growing need for self-service technology to enhance passenger experience to drive market
    7.4 DATA STORAGE 
           TABLE 29 AIRPORT AUTOMATION MARKET, BY DATA STORAGE, 2019–2022 (USD MILLION)
           TABLE 30 AIRPORT AUTOMATION MARKET, BY DATA STORAGE, 2023–2028 (USD MILLION)
           7.4.1 CLOUD STORAGE
                    7.4.1.1 Rising demand for storage capacity with less CAPEX to drive market
           7.4.2 ON-PREMISES STORAGE
                    7.4.2.1 Increasing need for cybersecurity and immediate accessibility to drive market
    7.5 SOFTWARE AND SOLUTIONS 
           TABLE 31 AIRPORT AUTOMATION MARKET, BY SOFTWARE AND SOLUTIONS, 2019–2022 (USD MILLION)
           TABLE 32 AIRPORT AUTOMATION MARKET, BY SOFTWARE AND SOLUTIONS, 2023–2028 (USD MILLION)
           7.5.1 AIRPORT OPERATIONAL CONTROL SYSTEMS
                    7.5.1.1 Growing use of centralized platforms for efficient airport operation to drive market
           7.5.2 PASSENGER AND BAGGAGE PROCESSING SYSTEMS
                    7.5.2.1 Growing need to optimize passenger journeys to drive market
           7.5.3 SECURITY MANAGEMENT SYSTEMS
                    7.5.3.1 Increasing adoption of cognitive security systems to drive market
 
8 AIRPORT AUTOMATION MARKET, BY APPLICATION (Page No. - 92)
    8.1 INTRODUCTION 
           FIGURE 31 AIRPORT AUTOMATION MARKET, BY APPLICATION, 2023 VS. 2028
           TABLE 33 AIRPORT AUTOMATION MARKET, BY APPLICATION, 2019–2022 (USD MILLION)
           TABLE 34 AIRPORT AUTOMATION MARKET, BY APPLICATION, 2023–2028 (USD MILLION)
    8.2 BAGGAGE HANDLING AND TRACKING 
           8.2.1 IMPLEMENTATION OF RESOLUTION 753 TO DRIVE MARKET
    8.3 GROUND TRANSPORTATION AND PARKING 
           8.3.1 NEED FOR REDUCED WAIT TIMES IN AIRPORT PARKING SYSTEMS TO DRIVE MARKET
    8.4 RETAIL AND DINING 
           8.4.1 GROWING DEMAND FOR IMPROVED SHOPPING AND CUSTOMER DINING EXPERIENCE AT AIRPORTS TO DRIVE MARKET
    8.5 FACILITY MANAGEMENT 
           8.5.1 INCREASING REQUIREMENT FOR OVERALL OPERATIONAL EFFICIENCY WITHIN AIRPORT FACILITIES TO DRIVE MARKET
    8.6 PASSENGER SERVICES AND ASSISTANCE 
           8.6.1 NEED FOR EFFICIENT CAPACITY HANDLING WHILE MAINTAINING IMPROVED PASSENGER EXPERIENCE TO DRIVE MARKET
    8.7 EMERGENCY RESPONSE AND SAFETY 
           8.7.1 RISING DEMAND FOR INFRASTRUCTURE SECURITY AND EMERGENCY RESPONSE TO DRIVE MARKET
    8.8 GROUND SUPPORT EQUIPMENT (GSE) 
           8.8.1 GROWING NEED TO DECREASE WORKFORCE AND REDUCE ERRORS TO DRIVE MARKET
    8.9 AIR TRAFFIC MANAGEMENT 
           8.9.1 INCREASING NEED TO AUTOMATE MANUAL TASKS IN AIR TRAFFIC MANAGEMENT SYSTEMS TO DRIVE MARKET
    8.10 AIRFIELD MANAGEMENT 
           8.10.1 INCREASING REQUIREMENT FOR OPERATIONAL SAFETY AND EFFICIENCY AT AIRFIELDS AND RUNWAYS TO DRIVE MARKET
    8.11 OTHERS 
 
9 AIRPORT AUTOMATION MARKET, BY AIRPORT SIDE (Page No. - 100)
    9.1 INTRODUCTION 
           FIGURE 32 AIRPORT AUTOMATION MARKET, BY AIRPORT SIDE, 2023 VS. 2028
           TABLE 35 AIRPORT AUTOMATION MARKET, BY AIRPORT SIDE, 2019–2022 (USD MILLION)
           TABLE 36 AIRPORT AUTOMATION MARKET, BY AIRPORT SIDE, 2023–2028 (USD MILLION)
    9.2 LANDSIDE 
           TABLE 37 AIRPORT AUTOMATION MARKET, BY LANDSIDE, 2019–2022 (USD MILLION)
           TABLE 38 AIRPORT AUTOMATION MARKET, BY LANDSIDE, 2023–2028 (USD MILLION)
           9.2.1 CURBSIDE
                    9.2.1.1 Growing demand for automated passenger service solutions in airports to drive market
           9.2.2 TERMINAL SIDE
                    9.2.2.1 Rising demand for operations optimization in airports to drive market
    9.3 AIRSIDE 
           TABLE 39 AIRPORT AUTOMATION MARKET, BY AIRSIDE, 2019–2022 (USD MILLION)
           TABLE 40 AIRPORT AUTOMATION MARKET, BY AIRSIDE, 2023–2028 (USD MILLION)
           9.3.1 APRON SIDE
                    9.3.1.1 Growing use of ground transportation and refueling equipment to drive market
           9.3.2 RUNWAY SIDE
                    9.3.2.1 Growing use of advanced sensors and communication infrastructure to ensure safe and efficient aircraft turnaround to drive market
 
10 AIRPORT AUTOMATION MARKET, BY AIRPORT SIZE (Page No. - 105)
     10.1 INTRODUCTION 
             FIGURE 33 AIRPORT AUTOMATION MARKET, BY AIRPORT SIZE, 2023 VS. 2028
             TABLE 41 AIRPORT AUTOMATION MARKET, BY AIRPORT SIZE, 2019–2022 (USD MILLION)
             TABLE 42 AIRPORT AUTOMATION MARKET, BY AIRPORT SIZE, 2023–2028 (USD MILLION)
     10.2 LARGE 
             10.2.1 INCREASING REQUIREMENT FOR AUTOMATED OPERATION EQUIPMENT TO PROCESS HIGH PASSENGER TRAFFIC AND REDUCE AIRCRAFT TURNAROUND TO DRIVE MARKET
     10.3 MEDIUM 
             10.3.1 INCREASING INVESTMENT IN MEDIUM AIRPORTS TO EXPAND CAPABILITIES TO DRIVE MARKET
     10.4 SMALL 
             10.4.1 INCREASING REGIONAL/DOMESTIC AIR PASSENGER TRAFFIC TO DRIVE MARKET
 
11 AIRPORT AUTOMATION MARKET, BY END MARKET (Page No. - 108)
     11.1 INTRODUCTION 
             FIGURE 34 AIRPORT AUTOMATION MARKET, BY END MARKET, 2023 VS. 2028
             TABLE 43 AIRPORT AUTOMATION MARKET, BY END MARKET, 2019–2022 (USD MILLION)
             TABLE 44 AIRPORT AUTOMATION MARKET, BY END MARKET, 2023–2028 (USD MILLION)
     11.2 GREENFIELD 
             11.2.1 INCREASING CONSTRUCTION OF NEW AIRPORTS TO MEET RISING PASSENGER TRAFFIC TO DRIVE MARKET
     11.3 BROWNFIELD 
             11.3.1 MODERNIZATION AND TECHNOLOGY UPGRADES OF AIRPORTS TO MEET GROWING AIR TRAFFIC DEMAND TO DRIVE MARKET
 
12 AIRPORT AUTOMATION MARKET, BY AUTOMATION LEVEL (Page No. - 111)
     12.1 INTRODUCTION 
             FIGURE 35 AIRPORT AUTOMATION MARKET, BY AUTOMATION LEVEL, 2023 VS. 2028
             TABLE 45 AIRPORT AUTOMATION MARKET, BY AUTOMATION LEVEL, 2019–2022 (USD MILLION)
             TABLE 46 AIRPORT AUTOMATION MARKET, BY AUTOMATION LEVEL, 2023–2028 (USD MILLION)
     12.2 LEVEL 1.0 
             12.2.1 REDUCED INVESTMENT COST AND DEPENDENCY ON LEGACY SYSTEMS TO DRIVE MARKET
     12.3 LEVEL 2.0 
             12.3.1 INCREASING ADOPTION OF SELF-SERVICE TECHNOLOGY AND BASIC PASSENGER AND BAGGAGE PROCESSING TECHNOLOGY TO DRIVE MARKET
     12.4 LEVEL 3.0 
             12.4.1 ADOPTION OF MORE ADVANCED SENSOR NETWORKS AND PROCESSING INFRASTRUCTURE TO DRIVE MARKET
     12.5 LEVEL 4.0 
             12.5.1 INCREASING INTEGRATION OF COGNITIVE TECHNOLOGY AND AUTONOMOUS EQUIPMENT TO ENHANCE AIRPORT EFFICIENCY TO DRIVE MARKET
 
13 AIRPORT AUTOMATION MARKET, BY REGION (Page No. - 115)
     13.1 INTRODUCTION 
             FIGURE 36 AIRPORT AUTOMATION MARKET, BY REGION, 2023–2028
             TABLE 47 AIRPORT AUTOMATION MARKET, BY REGION, 2019–2022 (USD MILLION)
             TABLE 48 AIRPORT AUTOMATION MARKET, BY REGION, 2023–2028 (USD MILLION)
     13.2 NORTH AMERICA 
             13.2.1 RECESSION IMPACT ANALYSIS
             13.2.2 PESTLE ANALYSIS
                        FIGURE 37 NORTH AMERICA: AIRPORT AUTOMATION MARKET SNAPSHOT
                        TABLE 49 NORTH AMERICA: AIRPORT AUTOMATION MARKET, BY COUNTRY, 2019–2022 (USD MILLION)
                        TABLE 50 NORTH AMERICA: AIRPORT AUTOMATION MARKET, BY COUNTRY, 2023–2028 (USD MILLION)
                        TABLE 51 NORTH AMERICA: AIRPORT AUTOMATION MARKET, BY SYSTEM, 2019–2022 (USD MILLION)
                        TABLE 52 NORTH AMERICA: AIRPORT AUTOMATION MARKET, BY SYSTEM, 2023–2028 (USD MILLION)
                        TABLE 53 NORTH AMERICA: AIRPORT AUTOMATION MARKET, BY AIRPORT SIDE, 2019–2022 (USD MILLION)
                        TABLE 54 NORTH AMERICA: AIRPORT AUTOMATION MARKET, BY AIRPORT SIDE, 2023–2028 (USD MILLION)
                        TABLE 55 NORTH AMERICA: AIRPORT AUTOMATION MARKET, BY AIRPORT SIZE, 2019–2022 (USD MILLION)
                        TABLE 56 NORTH AMERICA: AIRPORT AUTOMATION MARKET, BY AIRPORT SIZE, 2023–2028 (USD MILLION)
                        TABLE 57 NORTH AMERICA: AIRPORT AUTOMATION MARKET, BY END MARKET, 2019–2022 (USD MILLION)
                        TABLE 58 NORTH AMERICA: AIRPORT AUTOMATION MARKET, BY END MARKET, 2023–2028 (USD MILLION)
             13.2.3 US
                        13.2.3.1 Continuous focus on improving operational efficiency of airports to drive market
                                     TABLE 59 US: AIRPORT AUTOMATION MARKET, BY SYSTEM, 2019–2022 (USD MILLION)
                                     TABLE 60 US: AIRPORT AUTOMATION MARKET, BY SYSTEM, 2023–2028 (USD MILLION)
                                     TABLE 61 US: AIRPORT AUTOMATION MARKET, BY AIRPORT SIDE, 2019–2022 (USD MILLION)
                                     TABLE 62 US: AIRPORT AUTOMATION MARKET, BY AIRPORT SIDE, 2023–2028 (USD MILLION)
                                     TABLE 63 US: AIRPORT AUTOMATION MARKET, BY AIRPORT SIZE, 2019–2022 (USD MILLION)
                                     TABLE 64 US: AIRPORT AUTOMATION MARKET, BY AIRPORT SIZE, 2023–2028 (USD MILLION)
             13.2.4 CANADA
                        13.2.4.1 Increasing focus on deploying advanced automation technologies in airports to drive market
                                     TABLE 65 CANADA: AIRPORT AUTOMATION MARKET, BY SYSTEM, 2019–2022 (USD MILLION)
                                     TABLE 66 CANADA: AIRPORT AUTOMATION MARKET, BY SYSTEM, 2023–2028 (USD MILLION)
                                     TABLE 67 CANADA: AIRPORT AUTOMATION MARKET, BY AIRPORT SIDE, 2019–2022 (USD MILLION)
                                     TABLE 68 CANADA: AIRPORT AUTOMATION MARKET, BY AIRPORT SIDE, 2023–2028 (USD MILLION)
                                     TABLE 69 CANADA: AIRPORT AUTOMATION MARKET, BY AIRPORT SIZE, 2019–2022 (USD MILLION)
                                     TABLE 70 CANADA: AIRPORT AUTOMATION MARKET, BY AIRPORT SIZE, 2023–2028 (USD MILLION)
     13.3 EUROPE 
             13.3.1 RECESSION IMPACT ANALYSIS
             13.3.2 PESTLE ANALYSIS
                        FIGURE 38 EUROPE: AIRPORT AUTOMATION MARKET SNAPSHOT
                        TABLE 71 EUROPE: AIRPORT AUTOMATION MARKET, BY COUNTRY, 2019–2022 (USD MILLION)
                        TABLE 72 EUROPE: AIRPORT AUTOMATION MARKET, BY COUNTRY, 2023–2028 (USD MILLION)
                        TABLE 73 EUROPE: AIRPORT AUTOMATION MARKET, BY SYSTEM, 2019–2022 (USD MILLION)
                        TABLE 74 EUROPE: AIRPORT AUTOMATION MARKET, BY SYSTEM, 2023–2028 (USD MILLION)
                        TABLE 75 EUROPE: AIRPORT AUTOMATION MARKET, BY AIRPORT SIDE, 2019–2022 (USD MILLION)
                        TABLE 76 EUROPE: AIRPORT AUTOMATION MARKET, BY AIRPORT SIDE, 2023–2028 (USD MILLION)
                        TABLE 77 EUROPE: AIRPORT AUTOMATION MARKET, BY AIRPORT SIZE, 2019–2022 (USD MILLION)
                        TABLE 78 EUROPE: AIRPORT AUTOMATION MARKET, BY AIRPORT SIZE, 2023–2028 (USD MILLION)
                        TABLE 79 EUROPE: AIRPORT AUTOMATION MARKET, BY END MARKET, 2019–2022 (USD MILLION)
                        TABLE 80 EUROPE: AIRPORT AUTOMATION MARKET, BY END MARKET, 2023–2028 (USD MILLION)
             13.3.3 UK
                        13.3.3.1 Growing initiatives toward enhancing passenger experience with advanced automation solutions to drive market
                                     TABLE 81 UK: AIRPORT AUTOMATION MARKET, BY SYSTEM, 2019–2022 (USD MILLION)
                                     TABLE 82 UK: AIRPORT AUTOMATION MARKET, BY SYSTEM, 2023–2028 (USD MILLION)
                                     TABLE 83 UK: AIRPORT AUTOMATION MARKET, BY AIRPORT SIDE, 2019–2022 (USD MILLION)
                                     TABLE 84 UK: AIRPORT AUTOMATION MARKET, BY AIRPORT SIDE, 2023–2028 (USD MILLION)
                                     TABLE 85 UK: AIRPORT AUTOMATION MARKET, BY AIRPORT SIZE, 2019–2022 (USD MILLION)
                                     TABLE 86 UK: AIRPORT AUTOMATION MARKET, BY AIRPORT SIZE, 2023–2028 (USD MILLION)
             13.3.4 FRANCE
                        13.3.4.1 Increasing focus on upgrading automated systems to enhance passenger experience to drive market
                                     TABLE 87 FRANCE: AIRPORT AUTOMATION MARKET, BY SYSTEM, 2019–2022 (USD MILLION)
                                     TABLE 88 FRANCE: AIRPORT AUTOMATION MARKET, BY SYSTEM, 2023–2028 (USD MILLION)
                                     TABLE 89 FRANCE: AIRPORT AUTOMATION MARKET, BY AIRPORT SIDE, 2019–2022 (USD MILLION)
                                     TABLE 90 FRANCE: AIRPORT AUTOMATION MARKET, BY AIRPORT SIDE, 2023–2028 (USD MILLION)
                                     TABLE 91 FRANCE: AIRPORT AUTOMATION MARKET, BY AIRPORT SIZE, 2019–2022 (USD MILLION)
                                     TABLE 92 FRANCE: AIRPORT AUTOMATION MARKET, BY AIRPORT SIZE, 2023–2028 (USD MILLION)
             13.3.5 GERMANY
                        13.3.5.1 Technological advancements and growing need for efficiency in airport operations to drive market
                                     TABLE 93 GERMANY: AIRPORT AUTOMATION MARKET, BY SYSTEM, 2019–2022 (USD MILLION)
                                     TABLE 94 GERMANY: AIRPORT AUTOMATION MARKET, BY SYSTEM, 2023–2028 (USD MILLION)
                                     TABLE 95 GERMANY: AIRPORT AUTOMATION MARKET, BY AIRPORT SIDE, 2019–2022 (USD MILLION)
                                     TABLE 96 GERMANY: AIRPORT AUTOMATION MARKET, BY AIRPORT SIDE, 2023–2028 (USD MILLION)
                                     TABLE 97 GERMANY: AIRPORT AUTOMATION MARKET, BY AIRPORT SIZE, 2019–2022 (USD MILLION)
                                     TABLE 98 GERMANY: AIRPORT AUTOMATION MARKET, BY AIRPORT SIZE, 2023–2028 (USD MILLION)
             13.3.6 NETHERLANDS
                        13.3.6.1 Growing adoption of innovative automation technology to enhance operational efficiency of airports to drive market
                                     TABLE 99 NETHERLANDS: AIRPORT AUTOMATION MARKET, BY SYSTEM, 2019–2022 (USD MILLION)
                                     TABLE 100 NETHERLANDS: AIRPORT AUTOMATION MARKET, BY SYSTEM, 2023–2028 (USD MILLION)
                                     TABLE 101 NETHERLANDS: AIRPORT AUTOMATION MARKET, BY AIRPORT SIDE, 2019–2022 (USD MILLION)
                                     TABLE 102 NETHERLANDS: AIRPORT AUTOMATION MARKET, BY AIRPORT SIDE, 2023–2028 (USD MILLION)
                                     TABLE 103 NETHERLANDS: AIRPORT AUTOMATION MARKET, BY AIRPORT SIZE, 2019–2022 (USD MILLION)
                                     TABLE 104 NETHERLANDS: AIRPORT AUTOMATION MARKET, BY AIRPORT SIZE, 2023–2028 (USD MILLION)
             13.3.7 REST OF EUROPE
                        TABLE 105 REST OF EUROPE: AIRPORT AUTOMATION MARKET, BY SYSTEM, 2019–2022 (USD MILLION)
                        TABLE 106 REST OF EUROPE: AIRPORT AUTOMATION MARKET, BY SYSTEM, 2023–2028 (USD MILLION)
                        TABLE 107 REST OF EUROPE: AIRPORT AUTOMATION MARKET, BY AIRPORT SIDE, 2019–2022 (USD MILLION)
                        TABLE 108 REST OF EUROPE: AIRPORT AUTOMATION MARKET, BY AIRPORT SIDE, 2023–2028 (USD MILLION)
                        TABLE 109 REST OF EUROPE: AIRPORT AUTOMATION MARKET, BY AIRPORT SIZE, 2019–2022 (USD MILLION)
                        TABLE 110 REST OF EUROPE: AIRPORT AUTOMATION MARKET, BY AIRPORT SIZE, 2023–2028 (USD MILLION)
     13.4 ASIA PACIFIC 
             13.4.1 RECESSION IMPACT ANALYSIS
             13.4.2 PESTLE ANALYSIS
                        FIGURE 39 ASIA PACIFIC: AIRPORT AUTOMATION MARKET SNAPSHOT
                        TABLE 111 ASIA PACIFIC: AIRPORT AUTOMATION MARKET, BY COUNTRY, 2019–2022 (USD MILLION)
                        TABLE 112 ASIA PACIFIC: AIRPORT AUTOMATION MARKET, BY COUNTRY, 2023–2028 (USD MILLION)
                        TABLE 113 ASIA PACIFIC: AIRPORT AUTOMATION MARKET, BY SYSTEM, 2019–2022 (USD MILLION)
                        TABLE 114 ASIA PACIFIC: AIRPORT AUTOMATION MARKET, BY SYSTEM, 2023–2028 (USD MILLION)
                        TABLE 115 ASIA PACIFIC: AIRPORT AUTOMATION MARKET, BY AIRPORT SIDE, 2019–2022 (USD MILLION)
                        TABLE 116 ASIA PACIFIC: AIRPORT AUTOMATION MARKET, BY AIRPORT SIDE, 2023–2028 (USD MILLION)
                        TABLE 117 ASIA PACIFIC: AIRPORT AUTOMATION MARKET, BY AIRPORT SIZE, 2019–2022 (USD MILLION)
                        TABLE 118 ASIA PACIFIC: AIRPORT AUTOMATION MARKET, BY AIRPORT SIZE, 2023–2028 (USD MILLION)
                        TABLE 119 ASIA PACIFIC: AIRPORT AUTOMATION MARKET, BY END MARKET, 2019–2022 (USD MILLION)
                        TABLE 120 ASIA PACIFIC: AIRPORT AUTOMATION MARKET, BY END MARKET, 2023–2028 (USD MILLION)
             13.4.3 CHINA
                        13.4.3.1 Growing focus on adopting advanced automated air cargo facilities to drive market
                                     TABLE 121 CHINA: AIRPORT AUTOMATION MARKET, BY SYSTEM, 2019–2022 (USD MILLION)
                                     TABLE 122 CHINA: AIRPORT AUTOMATION MARKET, BY SYSTEM, 2023–2028 (USD MILLION)
                                     TABLE 123 CHINA: AIRPORT AUTOMATION MARKET, BY AIRPORT SIDE, 2019–2022 (USD MILLION)
                                     TABLE 124 CHINA: AIRPORT AUTOMATION MARKET, BY AIRPORT SIDE, 2023–2028 (USD MILLION)
                                     TABLE 125 CHINA: AIRPORT AUTOMATION MARKET, BY AIRPORT SIZE, 2019–2022 (USD MILLION)
                                     TABLE 126 CHINA: AIRPORT AUTOMATION MARKET, BY AIRPORT SIZE, 2023–2028 (USD MILLION)
             13.4.4 INDIA
                        13.4.4.1 Increasing investment in indigenous automation solutions to drive market
                                     TABLE 127 INDIA: AIRPORT AUTOMATION MARKET, BY SYSTEM, 2019–2022 (USD MILLION)
                                     TABLE 128 INDIA: AIRPORT AUTOMATION MARKET, BY SYSTEM, 2023–2028 (USD MILLION)
                                     TABLE 129 INDIA: AIRPORT AUTOMATION MARKET, BY AIRPORT SIDE, 2019–2022 (USD MILLION)
                                     TABLE 130 INDIA: AIRPORT AUTOMATION MARKET, BY AIRPORT SIDE, 2023–2028 (USD MILLION)
                                     TABLE 131 INDIA: AIRPORT AUTOMATION MARKET, BY AIRPORT SIZE, 2019–2022 (USD MILLION)
                                     TABLE 132 INDIA: AIRPORT AUTOMATION MARKET, BY AIRPORT SIZE, 2023–2028 (USD MILLION)
             13.4.5 JAPAN
                        13.4.5.1 Increasing investment in advanced passenger service technologies to drive market
                                     TABLE 133 JAPAN: AIRPORT AUTOMATION MARKET, BY SYSTEM, 2019–2022 (USD MILLION)
                                     TABLE 134 JAPAN: AIRPORT AUTOMATION MARKET, BY SYSTEM, 2023–2028 (USD MILLION)
                                     TABLE 135 JAPAN: AIRPORT AUTOMATION MARKET, BY AIRPORT SIDE, 2019–2022 (USD MILLION)
                                     TABLE 136 JAPAN: AIRPORT AUTOMATION MARKET, BY AIRPORT SIDE, 2023–2028 (USD MILLION)
                                     TABLE 137 JAPAN: AIRPORT AUTOMATION MARKET, BY AIRPORT SIZE, 2019–2022 (USD MILLION)
                                     TABLE 138 JAPAN: AIRPORT AUTOMATION MARKET, BY AIRPORT SIZE, 2023–2028 (USD MILLION)
             13.4.6 SINGAPORE
                        13.4.6.1 Integration of diverse automation systems at Changi Airport to drive market
                                     TABLE 139 SINGAPORE: AIRPORT AUTOMATION MARKET, BY SYSTEM, 2019–2022 (USD MILLION)
                                     TABLE 140 SINGAPORE: AIRPORT AUTOMATION MARKET, BY SYSTEM, 2023–2028 (USD MILLION)
                                     TABLE 141 SINGAPORE: AIRPORT AUTOMATION MARKET, BY AIRPORT SIDE, 2019–2022 (USD MILLION)
                                     TABLE 142 SINGAPORE: AIRPORT AUTOMATION MARKET, BY AIRPORT SIDE, 2023–2028 (USD MILLION)
                                     TABLE 143 SINGAPORE: AIRPORT AUTOMATION MARKET, BY AIRPORT SIZE, 2019–2022 (USD MILLION)
                                     TABLE 144 SINGAPORE: AIRPORT AUTOMATION MARKET, BY AIRPORT SIZE, 2023–2028 (USD MILLION)
             13.4.7 SOUTH KOREA
                        13.4.7.1 Increasing adoption of cognitive technology and presence of automation solution players to drive market
                                     TABLE 145 SOUTH KOREA: AIRPORT AUTOMATION MARKET, BY SYSTEM, 2019–2022 (USD MILLION)
                                     TABLE 146 SOUTH KOREA: AIRPORT AUTOMATION MARKET, BY SYSTEM, 2023–2028 (USD MILLION)
                                     TABLE 147 SOUTH KOREA: AIRPORT AUTOMATION MARKET, BY AIRPORT SIDE, 2019–2022 (USD MILLION)
                                     TABLE 148 SOUTH KOREA: AIRPORT AUTOMATION MARKET, BY AIRPORT SIDE, 2023–2028 (USD MILLION)
                                     TABLE 149 SOUTH KOREA: AIRPORT AUTOMATION MARKET, BY AIRPORT SIZE, 2019–2022 (USD MILLION)
                                     TABLE 150 SOUTH KOREA: AIRPORT AUTOMATION MARKET, BY AIRPORT SIZE, 2023–2028 (USD MILLION)
             13.4.8 REST OF ASIA PACIFIC
                        TABLE 151 REST OF ASIA PACIFIC: AIRPORT AUTOMATION MARKET, BY SYSTEM, 2019–2022 (USD MILLION)
                        TABLE 152 REST OF ASIA PACIFIC: AIRPORT AUTOMATION MARKET, BY SYSTEM, 2023–2028 (USD MILLION)
                        TABLE 153 REST OF ASIA PACIFIC: AIRPORT AUTOMATION MARKET, BY AIRPORT SIDE, 2019–2022 (USD MILLION)
                        TABLE 154 REST OF ASIA PACIFIC: AIRPORT AUTOMATION MARKET, BY AIRPORT SIDE, 2023–2028 (USD MILLION)
                        TABLE 155 REST OF ASIA PACIFIC: AIRPORT AUTOMATION MARKET, BY AIRPORT SIZE, 2019–2022 (USD MILLION)
                        TABLE 156 REST OF ASIA PACIFIC: AIRPORT AUTOMATION MARKET, BY AIRPORT SIZE, 2023–2028 (USD MILLION)
     13.5 MIDDLE EAST 
             13.5.1 RECESSION IMPACT ANALYSIS
             13.5.2 PESTLE ANALYSIS
                        FIGURE 40 MIDDLE EAST: AIRPORT AUTOMATION MARKET SNAPSHOT
                        TABLE 157 MIDDLE EAST: AIRPORT AUTOMATION MARKET, BY COUNTRY, 2019–2022 (USD MILLION)
                        TABLE 158 MIDDLE EAST: AIRPORT AUTOMATION MARKET, BY COUNTRY, 2023–2028 (USD MILLION)
                        TABLE 159 MIDDLE EAST: AIRPORT AUTOMATION MARKET, BY SYSTEM, 2019–2022 (USD MILLION)
                        TABLE 160 MIDDLE EAST: AIRPORT AUTOMATION MARKET, BY SYSTEM, 2023–2028 (USD MILLION)
                        TABLE 161 MIDDLE EAST: AIRPORT AUTOMATION MARKET, BY AIRPORT SIDE, 2019–2022 (USD MILLION)
                        TABLE 162 MIDDLE EAST: AIRPORT AUTOMATION MARKET, BY AIRPORT SIDE, 2023–2028 (USD MILLION)
                        TABLE 163 MIDDLE EAST: AIRPORT AUTOMATION MARKET, BY AIRPORT SIZE, 2019–2022 (USD MILLION)
                        TABLE 164 MIDDLE EAST: AIRPORT AUTOMATION MARKET, BY AIRPORT SIZE, 2023–2028 (USD MILLION)
                        TABLE 165 MIDDLE EAST: AIRPORT AUTOMATION MARKET, BY END MARKET, 2019–2022 (USD MILLION)
                        TABLE 166 MIDDLE EAST: AIRPORT AUTOMATION MARKET, BY END MARKET, 2023–2028 (USD MILLION)
             13.5.3 SAUDI ARABIA
                        13.5.3.1 Growing focus on increasing operational efficiency in airports to drive market
                                     TABLE 167 SAUDI ARABIA: AIRPORT AUTOMATION MARKET, BY SYSTEM, 2019–2022 (USD MILLION)
                                     TABLE 168 SAUDI ARABIA: AIRPORT AUTOMATION MARKET, BY SYSTEM, 2023–2028 (USD MILLION)
                                     TABLE 169 SAUDI ARABIA: AIRPORT AUTOMATION MARKET, BY AIRPORT SIDE, 2019–2022 (USD MILLION)
                                     TABLE 170 SAUDI ARABIA: AIRPORT AUTOMATION MARKET, BY AIRPORT SIDE, 2023–2028 (USD MILLION)
                                     TABLE 171 SAUDI ARABIA: AIRPORT AUTOMATION MARKET, BY AIRPORT SIZE, 2019–2022 (USD MILLION)
                                     TABLE 172 SAUDI ARABIA: AIRPORT AUTOMATION MARKET, BY AIRPORT SIZE, 2023–2028 (USD MILLION)
             13.5.4 UAE
                        13.5.4.1 Growing focus on deploying advanced automation technologies in airports to drive market
                                     TABLE 173 UAE: AIRPORT AUTOMATION MARKET, BY SYSTEM, 2019–2022 (USD MILLION)
                                     TABLE 174 UAE: AIRPORT AUTOMATION MARKET, BY SYSTEM, 2023–2028 (USD MILLION)
                                     TABLE 175 UAE: AIRPORT AUTOMATION MARKET, BY AIRPORT SIDE, 2019–2022 (USD MILLION)
                                     TABLE 176 UAE: AIRPORT AUTOMATION MARKET, BY AIRPORT SIDE, 2023–2028 (USD MILLION)
                                     TABLE 177 UAE: AIRPORT AUTOMATION MARKET, BY AIRPORT SIZE, 2019–2022 (USD MILLION)
                                     TABLE 178 UAE: AIRPORT AUTOMATION MARKET, BY AIRPORT SIZE, 2023–2028 (USD MILLION)
             13.5.5 REST OF MIDDLE EAST
                        TABLE 179 REST OF MIDDLE EAST: AIRPORT AUTOMATION MARKET, BY SYSTEM, 2019–2022 (USD MILLION)
                        TABLE 180 REST OF MIDDLE EAST: AIRPORT AUTOMATION MARKET, BY SYSTEM, 2023–2028 (USD MILLION)
                        TABLE 181 REST OF MIDDLE EAST: AIRPORT AUTOMATION MARKET, BY AIRPORT SIDE, 2019–2022 (USD MILLION)
                        TABLE 182 REST OF MIDDLE EAST: AIRPORT AUTOMATION MARKET, BY AIRPORT SIDE, 2023–2028 (USD MILLION)
                        TABLE 183 REST OF MIDDLE EAST: AIRPORT AUTOMATION MARKET, BY AIRPORT SIZE, 2019–2022 (USD MILLION)
                        TABLE 184 REST OF MIDDLE EAST: AIRPORT AUTOMATION MARKET, BY AIRPORT SIZE, 2023–2028 (USD MILLION)
     13.6 REST OF THE WORLD 
             13.6.1 RECESSION IMPACT ANALYSIS
             13.6.2 PESTLE ANALYSIS
                        FIGURE 41 REST OF THE WORLD: AIRPORT AUTOMATION MARKET SNAPSHOT
                        TABLE 185 REST OF THE WORLD: AIRPORT AUTOMATION MARKET, BY COUNTRY, 2019–2022 (USD MILLION)
                        TABLE 186 REST OF THE WORLD: AIRPORT AUTOMATION MARKET, BY COUNTRY, 2023–2028 (USD MILLION)
                        TABLE 187 REST OF THE WORLD: AIRPORT AUTOMATION MARKET, BY SYSTEM, 2019–2022 (USD MILLION)
                        TABLE 188 REST OF THE WORLD: AIRPORT AUTOMATION MARKET, BY SYSTEM, 2023–2028 (USD MILLION)
                        TABLE 189 REST OF THE WORLD: AIRPORT AUTOMATION MARKET, BY AIRPORT SIDE, 2019–2022 (USD MILLION)
                        TABLE 190 REST OF THE WORLD: AIRPORT AUTOMATION MARKET, BY AIRPORT SIDE, 2023–2028 (USD MILLION)
                        TABLE 191 REST OF THE WORLD: AIRPORT AUTOMATION MARKET, BY AIRPORT SIZE, 2019–2022 (USD MILLION)
                        TABLE 192 REST OF THE WORLD: AIRPORT AUTOMATION MARKET, BY AIRPORT SIZE, 2023–2028 (USD MILLION)
                        TABLE 193 REST OF THE WORLD: AIRPORT AUTOMATION MARKET, BY END MARKET, 2019–2022 (USD MILLION)
                        TABLE 194 REST OF THE WORLD: AIRPORT AUTOMATION MARKET, BY END MARKET, 2023–2028 (USD MILLION)
             13.6.3 BRAZIL
                        13.6.3.1 Increasing investment in automation of various operations at airports to drive market
                                     TABLE 195 BRAZIL: AIRPORT AUTOMATION MARKET, BY SYSTEM, 2019–2022 (USD MILLION)
                                     TABLE 196 BRAZIL: AIRPORT AUTOMATION MARKET, BY SYSTEM, 2023–2028 (USD MILLION)
                                     TABLE 197 BRAZIL: AIRPORT AUTOMATION MARKET, BY AIRPORT SIDE, 2019–2022 (USD MILLION)
                                     TABLE 198 BRAZIL: AIRPORT AUTOMATION MARKET, BY AIRPORT SIDE, 2023–2028 (USD MILLION)
                                     TABLE 199 BRAZIL: AIRPORT AUTOMATION MARKET, BY AIRPORT SIZE, 2019–2022 (USD MILLION)
                                     TABLE 200 BRAZIL: AIRPORT AUTOMATION MARKET, BY AIRPORT SIZE, 2023–2028 (USD MILLION)
             13.6.4 MEXICO
                        13.6.4.1 Rising focus on deploying advanced automation technologies in airports to drive market
                                     TABLE 201 MEXICO: AIRPORT AUTOMATION MARKET, BY SYSTEM, 2019–2022 (USD MILLION)
                                     TABLE 202 MEXICO: AIRPORT AUTOMATION MARKET, BY SYSTEM, 2023–2028 (USD MILLION)
                                     TABLE 203 MEXICO: AIRPORT AUTOMATION MARKET, BY AIRPORT SIDE, 2019–2022 (USD MILLION)
                                     TABLE 204 MEXICO: AIRPORT AUTOMATION MARKET, BY AIRPORT SIDE, 2023–2028 (USD MILLION)
                                     TABLE 205 MEXICO: AIRPORT AUTOMATION MARKET, BY AIRPORT SIZE, 2019–2022 (USD MILLION)
                                     TABLE 206 MEXICO: AIRPORT AUTOMATION MARKET, BY AIRPORT SIZE, 2023–2028 (USD MILLION)
             13.6.5 SOUTH AFRICA
                        13.6.5.1 Increasing investment in data-driven decision-making and analytics solutions to support airport operational strategies to drive market
                                     TABLE 207 SOUTH AFRICA: AIRPORT AUTOMATION MARKET, BY SYSTEM, 2019–2022 (USD MILLION)
                                     TABLE 208 SOUTH AFRICA: AIRPORT AUTOMATION MARKET, BY SYSTEM, 2023–2028 (USD MILLION)
                                     TABLE 209 SOUTH AFRICA: AIRPORT AUTOMATION MARKET, BY AIRPORT SIDE, 2019–2022 (USD MILLION)
                                     TABLE 210 SOUTH AFRICA: AIRPORT AUTOMATION MARKET, BY AIRPORT SIDE, 2023–2028 (USD MILLION)
                                     TABLE 211 SOUTH AFRICA: AIRPORT AUTOMATION MARKET, BY AIRPORT SIZE, 2019–2022 (USD MILLION)
                                     TABLE 212 SOUTH AFRICA: AIRPORT AUTOMATION MARKET, BY AIRPORT SIZE, 2023–2028 (USD MILLION)
             13.6.6 OTHERS
                        TABLE 213 OTHERS: AIRPORT AUTOMATION MARKET, BY SYSTEM, 2019–2022 (USD MILLION)
                        TABLE 214 OTHERS: AIRPORT AUTOMATION MARKET, BY SYSTEM, 2023–2028 (USD MILLION)
                        TABLE 215 OTHERS: AIRPORT AUTOMATION MARKET, BY AIRPORT SIDE, 2019–2022 (USD MILLION)
                        TABLE 216 OTHERS: AIRPORT AUTOMATION MARKET, BY AIRPORT SIDE, 2023–2028 (USD MILLION)
                        TABLE 217 OTHERS: AIRPORT AUTOMATION MARKET, BY AIRPORT SIZE, 2019–2022 (USD MILLION)
                        TABLE 218 OTHERS: AIRPORT AUTOMATION MARKET, BY AIRPORT SIZE, 2023–2028 (USD MILLION)
 
14 COMPETITIVE LANDSCAPE (Page No. - 183)
     14.1 INTRODUCTION 
     14.2 MARKET SHARE ANALYSIS, 2022 
             TABLE 219 AIRPORT AUTOMATION MARKET: DEGREE OF COMPETITION
             FIGURE 42 MARKET SHARE ANALYSIS OF TOP 5 PLAYERS, 2022
             TABLE 220 KEY DEVELOPMENTS BY LEADING PLAYERS IN AIRPORT AUTOMATION MARKET, 2022
     14.3 MARKET RANKING ANALYSIS, 2022 
             FIGURE 43 MARKET RANKING OF TOP 5 PLAYERS IN AIRPORT AUTOMATION MARKET, 2022
     14.4 REVENUE ANALYSIS OF TOP 5 MARKET PLAYERS, 2018–2022 
             FIGURE 44 REVENUE ANALYSIS OF TOP 5 MARKET PLAYERS, 2018–2022
     14.5 COMPANY EVALUATION MATRIX 
             14.5.1 STARS
             14.5.2 EMERGING LEADERS
             14.5.3 PERVASIVE PLAYERS
             14.5.4 PARTICIPANTS
                        FIGURE 45 COMPANY EVALUATION MATRIX, 2022
             14.5.5 COMPANY FOOTPRINT
                        TABLE 221 PRODUCT FOOTPRINT
                        TABLE 222 COMPANY FOOTPRINT
                        TABLE 223 COMPANY REGION FOOTPRINT
     14.6 START-UP/SME EVALUATION MATRIX 
             14.6.1 PROGRESSIVE COMPANIES
             14.6.2 RESPONSIVE COMPANIES
             14.6.3 DYNAMIC COMPANIES
             14.6.4 STARTING BLOCKS
                        FIGURE 46 START-UP/SME EVALUATION MATRIX, 2022
             14.6.5 COMPETITIVE BENCHMARKING
                        TABLE 224 AIRPORT AUTOMATION MARKET: LIST OF KEY START-UPS/SMES
     14.7 COMPETITIVE SCENARIO 
             14.7.1 MARKET EVALUATION FRAMEWORK
             14.7.2 DEALS
                        TABLE 225 AIRPORT AUTOMATION MARKET: DEALS, JANUARY 2020–AUGUST 2023
             14.7.3 EXPANSIONS
                        TABLE 226 AIRPORT AUTOMATION MARKET: EXPANSIONS, JULY 2023
 
15 COMPANY PROFILES (Page No. - 210)
     15.1 KEY PLAYERS 
(Business Overview, Products/Solutions/Services offered, Recent Developments, MnM View)*  
             15.1.1 DAIFUKU CO., LTD.
                        TABLE 227 DAIFUKU CO., LTD.: COMPANY OVERVIEW
                        FIGURE 47 DAIFUKU CO., LTD.: COMPANY SNAPSHOT
                        TABLE 228 DAIFUKU CO., LTD.: PRODUCTS/SOLUTIONS/SERVICES OFFERED
                        TABLE 229 DAIFUKU CO., LTD.: PRODUCT LAUNCHES
                        TABLE 230 DAIFUKU CO., LTD.: DEALS
             15.1.2 AMADEUS IT GROUP SA
                        TABLE 231 AMADEUS IT GROUP SA: COMPANY OVERVIEW
                        FIGURE 48 AMADEUS IT GROUP SA: COMPANY SNAPSHOT
                        TABLE 232 AMADEUS IT GROUP SA: PRODUCTS/SOLUTIONS/SERVICES OFFERED?
                        TABLE 233 AMADEUS IT GROUP SA: DEALS
             15.1.3 LEONARDO S.P.A.
                        TABLE 234 LEONARDO S.P.A.: COMPANY OVERVIEW
                        FIGURE 49 LEONARDO S.P.A.: COMPANY SNAPSHOT
                        TABLE 235 LEONARDO S.P.A.: PRODUCTS/SOLUTIONS/SERVICES OFFERED?
                        TABLE 236 LEONARDO S.P.A.: DEALS
             15.1.4 SIEMENS
                        TABLE 237 SIEMENS: COMPANY OVERVIEW
                        FIGURE 50 SIEMENS: COMPANY SNAPSHOT
                        TABLE 238 SIEMENS: PRODUCTS/SOLUTIONS/SERVICES OFFERED?
                        TABLE 239 SIEMENS: DEALS
             15.1.5 COLLINS AEROSPACE
                        TABLE 240 COLLINS AEROSPACE: COMPANY OVERVIEW
                        FIGURE 51 COLLINS AEROSPACE: COMPANY SNAPSHOT
                        TABLE 241 COLLINS AEROSPACE: PRODUCTS/SOLUTIONS/SERVICES OFFERED?
                        TABLE 242 COLLINS AEROSPACE: OTHERS
             15.1.6 THALES
                        TABLE 243 THALES: COMPANY OVERVIEW
                        FIGURE 52 THALES: COMPANY SNAPSHOT
                        TABLE 244 THALES: PRODUCTS/SOLUTIONS/SERVICES OFFERED?
                        TABLE 245 THALES: DEALS
             15.1.7 VANDERLANDE INDUSTRIES B.V.
                        TABLE 246 VANDERLANDE INDUSTRIES B.V.: COMPANY OVERVIEW
                        FIGURE 53 VANDERLANDE INDUSTRIES B.V.: COMPANY SNAPSHOT
                        TABLE 247 VANDERLANDE INDUSTRIES B.V.: PRODUCTS/SOLUTIONS/SERVICES OFFERED?
                        TABLE 248 VANDERLANDE INDUSTRIES B.V.: DEALS
             15.1.8 SMITHS DETECTION GROUP LTD.
                        TABLE 249 SMITHS DETECTION GROUP LTD.: COMPANY OVERVIEW
                        FIGURE 54 SMITHS DETECTION GROUP LTD.: COMPANY SNAPSHOT
                        TABLE 250 SMITHS DETECTION GROUP LTD.: PRODUCTS/SOLUTIONS/SERVICES OFFERED?
             15.1.9 LEIDOS
                        TABLE 251 LEIDOS: COMPANY OVERVIEW
                        FIGURE 55 LEIDOS: COMPANY SNAPSHOT
                        TABLE 252 LEIDOS: PRODUCTS/SOLUTIONS/SERVICES OFFERED?
                        TABLE 253 LEIDOS: DEALS
             15.1.10 NEC CORPORATION
                        TABLE 254 NEC CORPORATION: COMPANY OVERVIEW
                        FIGURE 56 NEC CORPORATION: COMPANY SNAPSHOT
                        TABLE 255 NEC CORPORATION: PRODUCTS/SOLUTIONS/SERVICES OFFERED?
                        TABLE 256 NEC CORPORATION: DEALS
             15.1.11 INDRA SISTEMAS S.A.
                        TABLE 257 INDRA SISTEMAS S.A.: COMPANY OVERVIEW
                        FIGURE 57 INDRA SISTEMAS S.A.: COMPANY SNAPSHOT
                        TABLE 258 INDRA SISTEMAS S.A.: PRODUCTS/SOLUTIONS/SERVICES OFFERED?
                        TABLE 259 INDRA SISTEMAS S.A.: DEALS
             15.1.12 MATERNA IPS GMBH
                        TABLE 260 MATERNA IPS GMBH: COMPANY OVERVIEW
                        TABLE 261 MATERNA IPS GMBH: PRODUCTS/SOLUTIONS/SERVICES OFFERED?
                        TABLE 262 MATERNA IPS GMBH: DEALS
             15.1.13 ADB SAFEGATE
                        TABLE 263 ADB SAFEGATE: COMPANY OVERVIEW
                        TABLE 264 ADB SAFEGATE: PRODUCTS/SOLUTIONS/SERVICES OFFERED?
                        TABLE 265 ADB SAFEGATE: DEALS
             15.1.14 HUAWEI TECHNOLOGIES CO., LTD.
                        TABLE 266 HUAWEI TECHNOLOGIES CO., LTD.: COMPANY OVERVIEW
                        TABLE 267 HUAWEI TECHNOLOGIES CO., LTD.: PRODUCTS/SOLUTIONS/SERVICES OFFERED?
                        TABLE 268 HUAWEI TECHNOLOGIES CO., LTD.: DEALS
             15.1.15 GUNNEBO ENTRANCE CONTROL LTD.
                        TABLE 269 GUNNEBO ENTRANCE CONTROL LTD.: COMPANY OVERVIEW
                        TABLE 270 GUNNEBO ENTRANCE CONTROL LTD.: PRODUCTS/SOLUTIONS/SERVICES OFFERED?
*Details on Business Overview, Products/Solutions/Services offered, Recent Developments, MnM View might not be captured in case of unlisted companies.  
     15.2 OTHER PLAYERS 
             15.2.1 VISION-BOX
             15.2.2 BEUMER GROUP
             15.2.3 ALSTEF GROUP
             15.2.4 LENZE
             15.2.5 GORILLA TECHNOLOGY
             15.2.6 INK INNOVATION
             15.2.7 ATG AIRPORTS LIMITED
             15.2.8 NUCTECH COMPANY LIMITED
             15.2.9 SCARABEE AVIATION GROUP B.V.
             15.2.10 XOVIS AG
 
16 APPENDIX (Page No. - 282)
     16.1 DISCUSSION GUIDE 
     16.2 KNOWLEDGESTORE: MARKETSANDMARKETS’ SUBSCRIPTION PORTAL 
     16.3 CUSTOMIZATION OPTIONS 
     16.4 RELATED REPORTS 
     16.5 AUTHOR DETAILS 
 

The study involved four major activities in estimating the current market size for the Airport Automation Market. Exhaustive secondary research was conducted to collect information on the market, the peer markets, and the parent market. The next step was to validate these findings, assumptions, and sizing with industry experts across the value chain through primary research. Both top-down and bottom-up approaches were employed to estimate the complete market size. Thereafter, market breakdown and data triangulation procedures were used to estimate the market size of segments and subsegments.

Secondary Research

In the secondary research process, various secondary sources, such as D&B Hoovers, Bloomberg, BusinessWeek, and different magazines, were referred to identify and collect information for this study. Secondary sources also included annual reports, press releases & investor presentations of companies, certified publications, articles by recognized authors, and simulator databases.

Primary Research

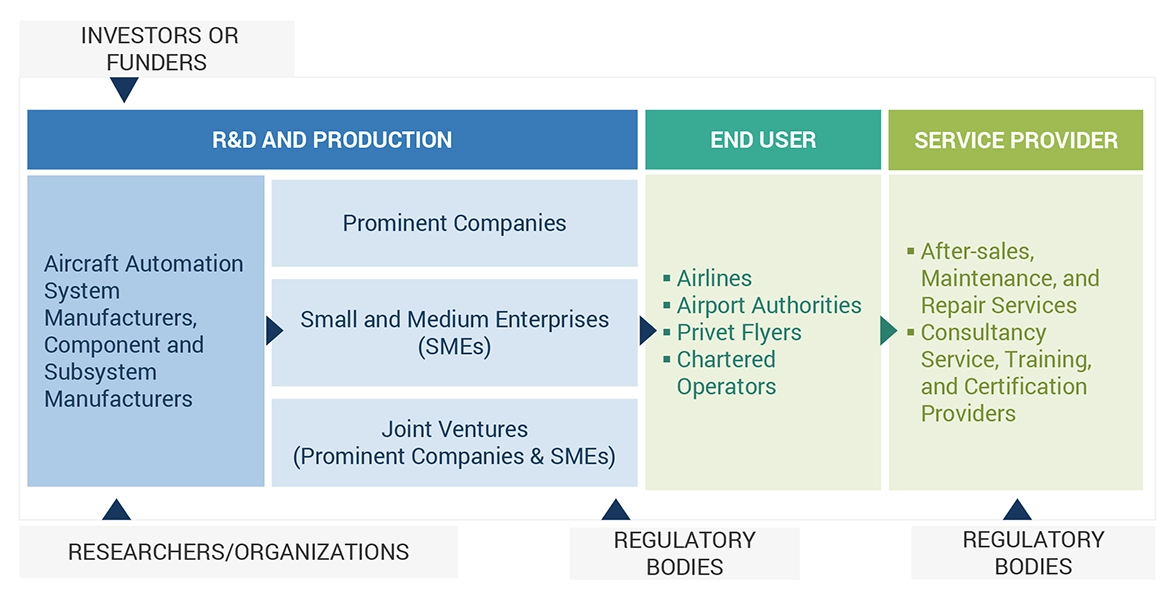
The Airport Automation Market  comprises several stakeholders, such as raw material providers, Airport Automation equipment manufacturers and automation solution providers, and regulatory organizations in the supply chain. While the demand side of this market is characterized by various end users, the supply side is characterized by technological advancements in airport solutions. Various primary sources from both the supply and demand sides of the market were interviewed to obtain qualitative and quantitative information. Following is the breakdown of primary respondents:

Airport Automation Market Size, and Share

To know about the assumptions considered for the study, download the pdf brochure

Market Size Estimation

Both top-down and bottom-up approaches were used to estimate and validate the total size of the Airport Automation Market . These methods were also used extensively to estimate the size of various subsegments of the market. The research methodology used to estimate the market size includes the following:

  • Key players in the industry and markets were identified through extensive secondary research.
  • The industry’s supply chain and market size, in terms of value, were determined through primary and secondary research processes.
  • All percentage shares, splits, and breakdowns were determined using secondary sources and verified through primary sources.

Market size estimation methodology: Bottom-up Approach

The market sizing was undertaken from the demand side. The market was sized based on the year-on-year growth of newly built boats and retrofitted electric boats.

Airport Automation Market Size, and Bottom-up Approach

Market size estimation methodology: Top-down Approach

In the top-down approach, the overall market size was used to estimate the size of individual markets (mentioned in the market segmentation) acquired through percentage splits from secondary and primary research. For the calculation of specific market segments, the size of the most appropriate, immediate parent market was used to implement the top-down approach. The bottom-up approach was also implemented to validate the revenue obtained for various market segments.

  • Companies supplying airport automation solution, as well as components, were included in the report.
  • The total revenue of these companies was identified through their annual reports and other authentic sources. In cases where annual reports were not available, company earnings were estimated based on the number of employees, press releases, and any publicly available data.
  • Company revenue was calculated based on the various operating segments.
  • All publicly available company contracts related to Airport Automation were mapped and summed up.
  • Based on these parameters (contracts, agreements, partnerships, joint ventures, product matrix, secondary research), the share of electric ships in each segment was estimated.

Airport Automation Market Size, and Top-down Approach

Data Triangulation

After arriving at the overall market size-using the market size estimation process explained above-the market was split into several segments and subsegments. Data triangulation and market breakdown procedures were employed, wherever applicable, to complete the overall market engineering process and arrive at the exact statistics of each market segment and subsegment. The data was triangulated by studying various factors and trends from both the demand and supply sides of the Airport Automation Market .

Report Objectives

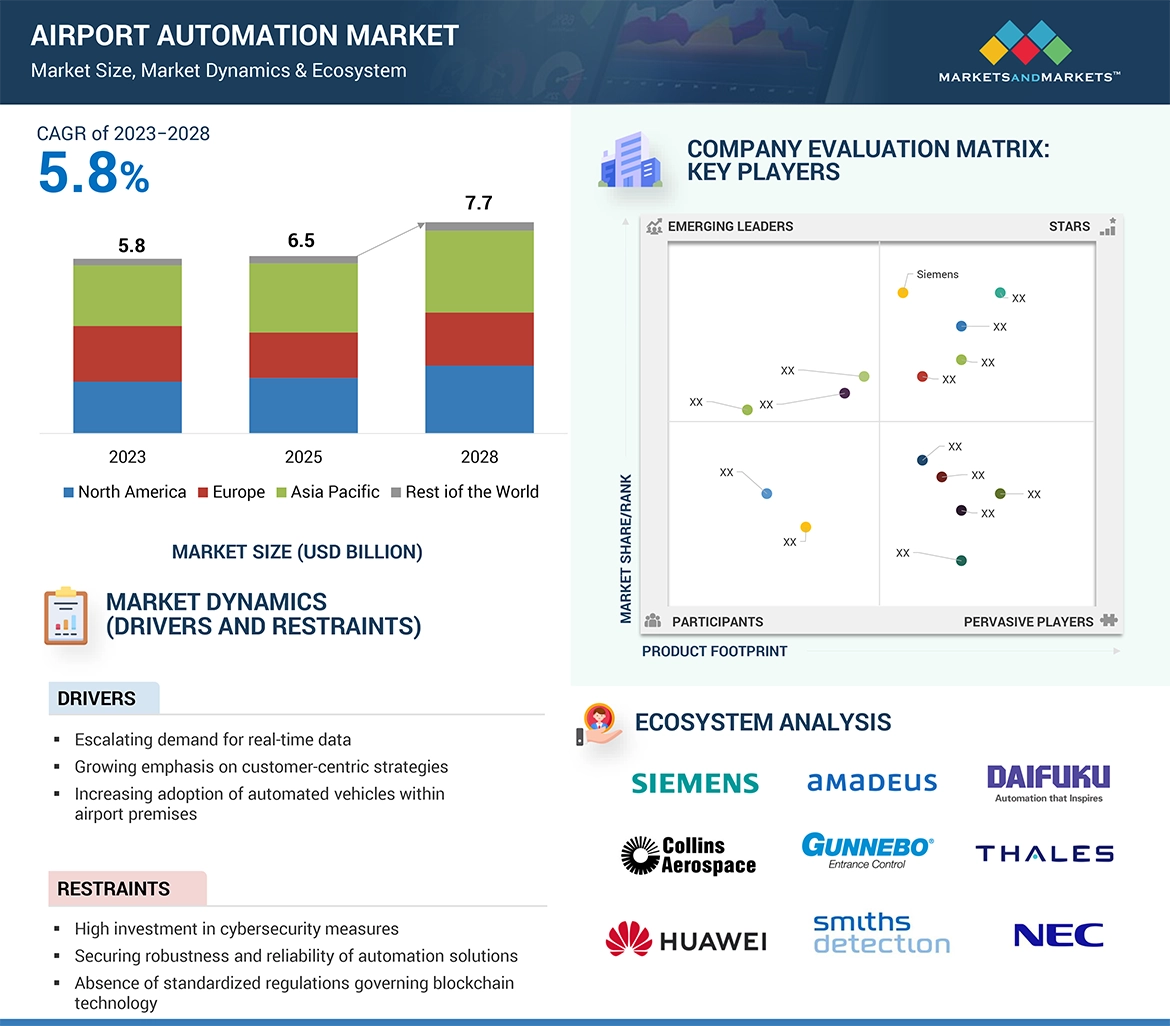
  • To identify and analyze key drivers, restraints, challenges, and opportunities influencing the growth of the Airport Automation Market
  • To analyze the impact of macro and micro indicators on the market
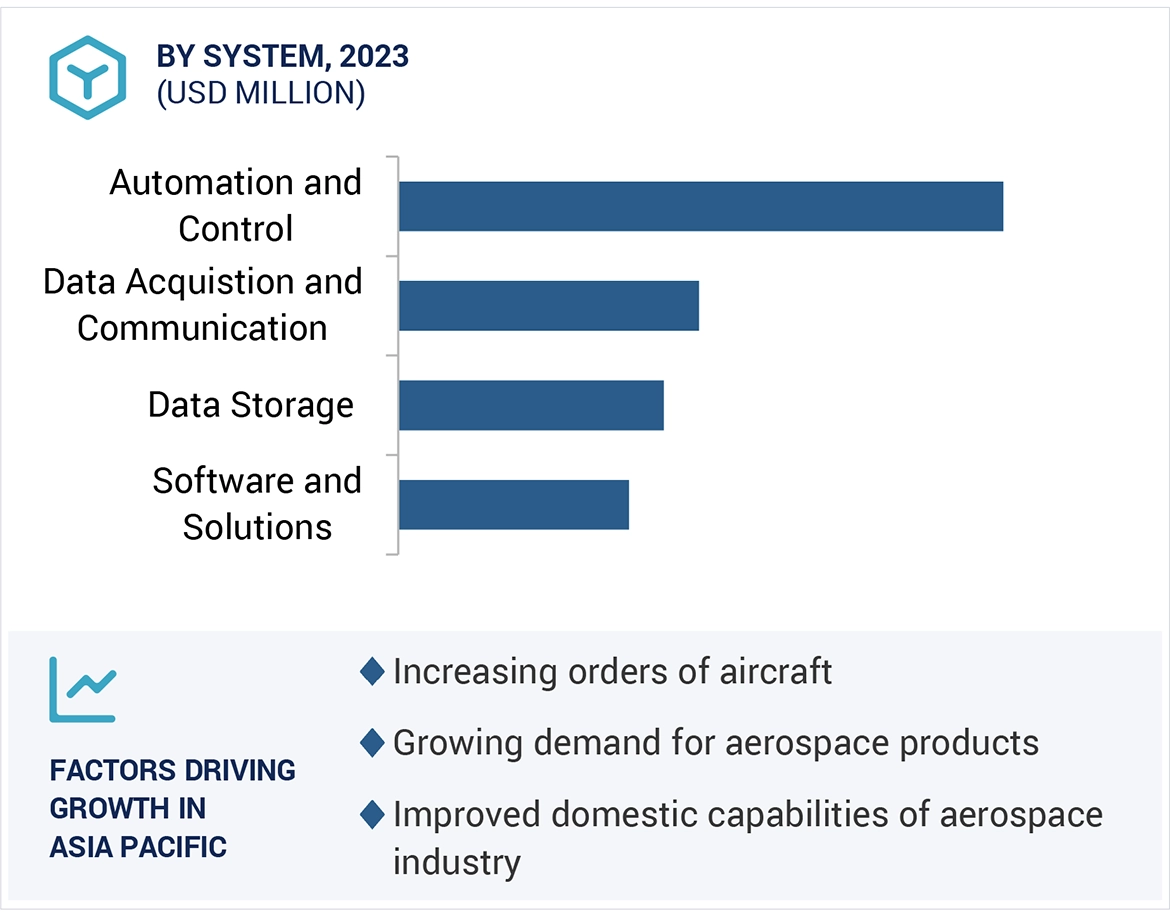
  • To forecast the market size of segments for four regions, namely, North America, Europe, Asia Pacific, Middle East and the Rest of the World, along with major countries in each of these regions
  • To strategically analyze micro markets with respect to individual technological trends, prospects, and their contribution to the overall market
  • To strategically profile key market players and comprehensively analyze their market ranking and core competencies
  • To provide a detailed competitive landscape of the market, along with an analysis of business and corporate strategies, such as contracts, agreements, partnerships, and expansions.
  • To identify detailed financial positions, key products, unique selling points, and key developments of leading companies in the market

Market Definition

A battery contains one or more cells that convert chemical energy directly into electrical energy. The primary electrical system in a vessel or boat incorporates one or more batteries. These batteries are used to power up the electrical system and to start the auxiliary power unit and the engines. A boat with a length under 70 feet and a lower range can be considered a vessel. An electric boat refers to a boat entirely driven by battery power.

Market Stakeholders

  • Smart Component/Solution/Service Providers
  • Airport System and Component Integrators/Manufacturers
  • Airlines
  • Airports
  • Research Bodies
  • Government Bodies, Agencies, and Regulators
  • Investors and Financial Community Professionals
  • System Integrators

Available Customizations

Along with the market data, MarketsandMarkets offers customizations as per the specific needs of companies. The following customization options are available for the report:

Product Analysis

  • Product matrix, which gives a detailed comparison of the product portfolio of each company

Regional Analysis

  • Further breakdown of the market segments at country-level

Company Information

  • Detailed analysis and profiling of additional market players (up to 6)
Custom Market Research Services

We will customize the research for you, in case the report listed above does not meet with your exact requirements. Our custom research will comprehensively cover the business information you require to help you arrive at strategic and profitable business decisions.

Request Customization
Report Code
AS 8882
Published ON
Dec, 2023
Choose License Type
BUY NOW
  • SHARE
X
Request Customization
Speak to Analyst
Speak to Analyst
OR FACE-TO-FACE MEETING
PERSONALIZE THIS RESEARCH
  • Triangulate with your Own Data
  • Get Data as per your Format and Definition
  • Gain a Deeper Dive on a Specific Application, Geography, Customer or Competitor
  • Any level of Personalization
REQUEST A FREE CUSTOMIZATION
LET US HELP YOU!
  • What are the Known and Unknown Adjacencies Impacting the Airport Automation Market
  • What will your New Revenue Sources be?
  • Who will be your Top Customer; what will make them switch?
  • Defend your Market Share or Win Competitors
  • Get a Scorecard for Target Partners
CUSTOMIZED WORKSHOP REQUEST
+1-888-600-6441
  • Call Us
  • +1-888-600-6441 (Corporate office hours)
  • +1-888-600-6441 (US/Can toll free)
  • +44-800-368-9399 (UK office hours)
CONNECT WITH US
ABOUT TRUST ONLINE
©2024 MarketsandMarkets Research Private Ltd. All rights reserved
DMCA.com Protection Status Website Feedback