Arc-based Plasma Lighting Market

Arc-based Plasma Lighting Market by Light Source (Xenon Arc Lamps, Metal Halide Lamps, Deuterium Lamps, Krypton Arc Lamps, Mercury Vapor Lamps), Wattage Type (Below 500 W, 501 to 1500 W, Above 1500 W), Application and Region – Global Forecast to 2029

Report Code: SE 8987 Apr, 2024, by marketsandmarkets.com

[293 Pages Report] The global arc-based plasma lighting market is projected to grow from USD 616 million in 2024 to USD 676 million by 2029, registering a CAGR of 1.9% during the forecast period. The arc-based plasma lighting market is primarily driven by factors such as its superior light quality, extended lifespan, and robustness, making it an attractive option for various applications ranging from entertainment & projection to UV applications. Additionally, its ability to operate efficiently in harsh environments and provide consistent performance regardless of temperature fluctuations contributes significantly to its growing adoption across industries.

Arc-based Plasma Lighting Market

Arc-based Plasma Lighting Market

Arc-based Plasma Lighting Market Forecast to 2029

To know about the assumptions considered for the study, Request for Free Sample Report

Market Dynamics:

Driver: High color rendering index (CRI) driving adoption of arc-based plasma lighting

Arc-based plasma lighting's high color rendering index (CRI) stands out as a compelling driver for its adoption across various sectors. CRI refers to a light source's ability to accurately reproduce the colors of objects compared to natural light. With plasma lighting boasting CRI values upwards of 80, significantly higher than conventional lighting sources, it finds favor in applications where color fidelity is paramount, such as retail, museums, and healthcare facilities. Metal halide lamps have a color rendering index (CRI) of 65 to 95, which means they can reproduce colors accurately. A CRI of 85 to 90 is considered good at color rendering, while a CRI of 90 or higher is excellent. Government and industry studies consistently underline the significance of CRI in lighting choices. For instance, data from the Lighting Research Center at Rensselaer Polytechnic Institute suggests that high-CRI lighting can positively impact mood and productivity in workplaces, leading to tangible improvements in employee satisfaction and performance. Similarly, according to Straits Lighting, a workplace illuminated with high CRI lighting produces a far more pleasurable environment for workers and employees. Higher CRI ratings reduce stress, headaches, tension, depression, eye strain and improve overall mood, all of which boosts productivity.

Government initiatives and regulations further underscore the importance of CRI in lighting technology. Several countries have introduced energy efficiency standards that incorporate CRI requirements for lighting products. For instance, the European Union (EU) has established a regulation stipulating a minimum Color Rendering Index (CRI) of 80 for workplace environments. In areas occupied by people, the EU mandates a CRI of no less than 70 for outdoor spaces and a minimum of 80 for residential and office settings.

Restraint: Growing dominance of LED lighting due to superior characteristics

The availability of substitute lighting technologies, particularly LED (Light Emitting Diode) lighting, poses a significant restraint to the arc-based plasma lighting market. LED lighting has rapidly emerged as a dominant player in the lighting industry due to its energy efficiency, longevity, and versatility, offering a compelling alternative to traditional lighting sources like arc-based plasma lighting. The two technologies, HID (high intensity discharge) bulbs which includes arc-based plasma lighting, and LEDs, represent distinct methods of light production. HID bulbs utilize inert gases such as xenon and krypton within their glass casing, while LEDs operate as solid-state technology. HID lights emit substantial heat, with a significant portion of their emissions falling within both the IR and UV spectra. In contrast, LEDs emit light across a narrow band of the visible light spectrum, minimizing energy wastage through the production of excess heat or non-visible electromagnetic radiation.

Although HID lights demonstrate high efficiency when measured at the source (lumens/watt), this measurement fails to account for the actual light reaching the target area (system efficiency). System efficiency for HID lights is adversely affected by various factors such as trapped light, protective covers or lenses, non-standard operating temperatures, and power conversion losses, resulting in a system efficiency typically around 25% of the source efficiency. In comparison, LED lights exhibit a system efficiency closer to 50% of the source efficiency. Consequently, LEDs offer a significantly more effective lighting solution. Furthermore, compared to all other lighting technologies, including HID bulbs, LEDs boast an exceptionally long lifespan. New LEDs can endure for 100,000 hours or more, while the typical lifespan of an HID bulb pales in comparison, lasting at best only 10-25% as long, ranging from 10,000 to 25,000 hours. Moreover, LED lamps represent a safer environmental choice as they do not contain mercury.

Opportunity: Growing demand for shock and vibration resistant lighting

Arc-based plasma lighting's resilience to vibration and shock stands out as a significant driver for its adoption across various industries. This technology's inherent ability to withstand mechanical stress ensures reliability and longevity in environments where conventional lighting sources may falter. For example, in the transportation sector, plasma lighting fixtures endure constant vibrations in vehicles such as trains, buses, and aircraft. This durability minimizes maintenance requirements and reduces the risk of premature failures, ultimately leading to cost savings for transportation operators. One such example includes the 20 W xenon flash lamp modules by Hamamatsu Photonics K.K. it provides shock resistance of 500 m/s2.

Arc-based plasma lighting finds extensive use in military, civil, and maritime applications due to its resilience to vibration and shock. In military settings, plasma lighting is employed in various capacities, including searchlights and spotlights, where reliability under extreme conditions is paramount. These lighting solutions withstand the vibrations and shocks associated with combat operations, ensuring consistent illumination during missions such as reconnaissance, surveillance, and target acquisition. For instance, in marine vessels navigating turbulent waters or offshore platforms enduring extreme weather conditions, plasma lighting fixtures remain operational despite continuous exposure to shocks and vibrations.

Challenge: Adverse environmental impact caused by metal halide and mercury vapor lamps

Arc-based plasma lighting, while providing significant benefits in terms of brightness and efficiency, also poses environmental challenges that can hinder its market growth. One primary concern is the environmental impact associated with the manufacturing and disposal of lamps. The production process for arc-based plasma lamps typically involves the use of materials such as mercury, which can have adverse effects on ecosystems and human health if not managed properly. The presence of mercury, a hazardous substance found in arc lamps, presents a notable environmental hazard. High intensity discharge lights such as metal halide and mercury vapor lamps contain trace amounts of mercury, cadmium, and antimony. It is estimated that between 450 and 500 million of these lamps are discarded annually in the US, resulting in the disposal of over 30,000 metric tons of mercury-contaminated waste in the nation's landfills. Improper disposal methods can lead to the migration of mercury into the soil and subsequently into various water sources. Lakes have been identified as sites polluted with mercury, posing risks to the safety of fish consumption [Source: Pollution Prevention Services InfoHouse]. According to a study conducted by the Minnesota Pollution Control Agency, mercury concentrations in fish in one Minnesota lake have been increasing by 5 percent annually since 1970. As mercury moves up the food chain, its concentration escalates, becoming increasingly toxic. In its concentrated form, mercury poses a threat to the human nervous system. These figures highlight the environmental risks associated with the disposal of fluorescent lamps and HID lights, emphasizing the urgent need for proper disposal and recycling practices to mitigate mercury contamination.

Taking proactive measures to promote responsible lamp disposal, invest in mercury-free alternatives, and advocate for stronger environmental regulations can help companies mitigate the environmental impact associated with HID lights containing mercury. For instance, transitioning away from mercury arc lamps allows lithography facilities to play an active role in promoting environmental sustainability. By eradicating the potential for mercury contamination, professionals in lithography can fulfill their environmental obligations and contribute to the safeguarding of ecosystems and biodiversity.

Arc-based plasma lighting Market Ecosystem

Key companies in this market include well-established, financially stable providers of arc-based plasma lighting products. These companies have been operating in the market for several years and possess a diversified portfolio of certifications which cater to a wide range of applications. Prominent companies in this market include ams-OSRAM AG (Germany), Signify Holding (Netherlands), Ushio Inc. (Japan), Excelitas Technologies Corp. (US), Hamamatsu Photonics K.K. (Japan), LEDVANCE GmbH (Germany), and Newport Corporation (US).

Arc-based Plasma Lighting Market by Ecosystem

By Wattage Type, 501 to 1500 W segment likely to exhibit the highest CAGR during the forecast period.

Based on wattage type, the 501 to 1500 W segment in arc-based plasma lighting is expected to exhibit the highest CAGR during the forecast period for several reasons. This segment caters to a diverse array of applications, ranging from large-scale outdoor lighting like stadium illumination and street lighting to industrial and commercial settings requiring intense illumination. Its versatility across various industries drives its adoption. Furthermore, ongoing advancements in plasma lighting technology are continually enhancing efficiency and performance within this wattage range, making it increasingly appealing to users seeking superior lighting solutions. Moreover, as industries prioritize energy efficiency and sustainability, the 501 to 1500 W segment offers an optimal balance between brightness, energy consumption, and cost-effectiveness, further propelling its growth potential in the coming years.

By Light Source, xenon arc lamps are expected to account for largest share between 2024 and 2029.

The Xenon arc lamps segment in arc-based plasma lighting is expected to maintain the highest market share due to its unmatched combination of key attributes and established applications across diverse industries. Xenon arc lamps excel in providing a broad spectrum of light with high color rendering capabilities, closely mimicking natural sunlight. This makes them indispensable for critical applications such as automotive headlights, cinema projection, and solar simulators where accurate color reproduction and spectral fidelity are crucial. Furthermore, xenon arc lamps feature exceptional brightness and intensity, making them well-suited for demanding outdoor lighting scenarios like stadium illumination and street lighting. Their proven reliability, long lifespan, and consistent performance further solidify their position as the preferred choice across various industrial and commercial sectors. Additionally, continuous innovations in xenon arc lamp technology continue to enhance their efficiency and performance, ensuring their dominance in the arc-based plasma lighting market throughout the forecast period.

By Application, UV applications segment to exhibit highest CAGR from 2024 to 2029.

The UV applications segment in arc-based plasma lighting is poised to exhibit the highest CAGR during the forecast period, driven by several significant factors. There is a growing demand for UV light sources across diverse industries, including water and air purification, sterilization, and medical treatments, due to increasing concerns about health and hygiene. Additionally, continuous advancements in UV technology have led to the development of more efficient and cost-effective plasma-based UV lighting systems, expanding their applicability across various sectors. Furthermore, heightened awareness of UV's effectiveness in disinfection, particularly in healthcare facilities and public spaces, is driving the adoption of UV-based solutions.

Asia Pacific region is projected to experience the highest growth in the overall arc-based plasma lighting market during the forecast period.

Arc-based Plasma Lighting Market by Region

Arc-based Plasma Lighting Market by Region

To know about the assumptions 11565470 for the study, download the pdf brochure

The Asia-Pacific (APAC) region is witnessing the highest CAGR in the arc-based plasma lighting market, largely driven by several key factors. Rapid urbanization and industrialization in Asia Pacific countries are generating significant demand for advanced lighting solutions to support infrastructure development, including street lighting, architectural illumination, and industrial facilities. Moreover, increasing awareness of the effectiveness of arc-based plasma lighting in disinfection applications, particularly in healthcare facilities and public spaces, is propelling its adoption across the region. Additionally, the presence of leading industry players such as Ushio Inc. and Hamamatsu Photonics K.K. and ongoing technological advancements further contribute to the expansion of the arc-based plasma lighting market in Asia Pacific.

Key Market Players

ams-OSRAM AG (Germany), Signify Holding (Netherlands), Ushio Inc. (Japan), Excelitas Technologies Corp. (US), Hamamatsu Photonics K.K. (Japan), LEDVANCE GmbH (Germany), and Newport Corporation (US) are some of the key players in the arc-based plasma lighting companies.

Get online access to the report on the World's First Market Intelligence Cloud

  • Easy to Download Historical Data & Forecast Numbers
  • Company Analysis Dashboard for high growth potential opportunities
  • Research Analyst Access for customization & queries
  • Competitor Analysis with Interactive dashboard
  • Latest News, Updates & Trend analysis
Request Sample

Scope of the Report

Report Metric

Details

Market Size Availability for Years

2020–2029

Base Year

2023

Forecast Period

2024–2029

Forecast Units

Value (USD Million)

Segments Covered

By light source, wattage  type, application, and region

Geographies Covered

North America, Europe, Asia Pacific, and Rest of the World

Companies Covered

ams-OSRAM AG (Germany), Signify Holding (Netherlands), Ushio Inc. (Japan), Excelitas Technologies Corp. (US), Hamamatsu Photonics K.K. (Japan), LEDVANCE GmbH (Germany), Newport Corporation (US), Superior Quartz Products, Inc. (US), Amglo Kemlite Laboratories (US)

25 companies profiled

Arc-based Plasma Lighting Market Highlights

This research report categorizes the arc-based plasma lighting market based on light source, wattage type, application, and region.

Segment

Subsegment

By Light Source:

  • Xenon Arc Lamps
  • Metal Halide Lamps
  • Krypton Arc Lamps
  • Mercury Vapor Lamps
  • Deuterium Lamps

By Wattage Type

  • Below 500 W
  •  501 W to 1500 W
  • Above 1500 W

By Application:

  • Entertainment & Projection
    • Cinema Projectors
    • Large Venue Projectors
    • Photography
    • Scenery Lighting
    • Large Venue Lighting
  • Searchlight & Spotlight
    • Civil, Military and Land
    • Air and Runways
    • Maritime and Ports
  • Solar Simulation and Environmental Testing
    • Automotive
    • Photovoltaic Industry
    • Aeronautic & Aerospace
    • Equivalent Sun Hours
    • UV-Compatibility
    • Others
  • Spectroscopy
    • Broadband Light Source
    • Absorptivity Measurements
    • UV Spectroscopy
    • Spectrophotometry
    • High -Performance Liquid Chromatography (HPLC) and Ultra-High Liquid Chromatography (UHPLC)
    • Fast Protein Liquid Chromatography (FPLC)
  • Medical Lighting
    • Endoscopic Lights
    • Dental and Surgical Lights
    • Identify and Analyze Samples that responds to UV
  • Microscopic Lights
  • UV Applications
    • Ozone Production
    • UV Curing in Printing
    • Adhesive Bonding
    • Disinfection and Sterilization of Surfaces
    • Water Treatment & Sterilization and Air Purification
  • Others
    • Laser Pumping
    • Additive Manufacturing
    • Photoionization
    • Analytical Instrumentation
    • Capillary Electrophoresis
    • Lithography
    • Quality Control
    • Chemical Synthesis
    • Photochemical Processes
    • DLP, 3LCD, and LCoS Projectors

By Region:

  • North America
  • Europe
  • Asia Pacific
  • Rest of the World

Recent Developments

  • In January 2024, Excelitas Technologies Corp. acquired the Noblelight business from Heraeus Group (Germany) including its operations and key application centers and sales offices worldwide. Noblelight specializes in manufacturing specialty lighting components and system solutions spanning from ultraviolet to infrared, catering to various industries such as analytical instrumentation, industrial curing, water treatment, electronics manufacturing, medical and cosmetic therapy, battery production, and more.
  • In December 2023, Ushio Inc. and Dutch research and technology organization TNO elevated their collaborative efforts with a new five-year maintenance and collaboration agreement. Building on the success of the past five years, during which Ushio served as TNO's strategic supplier and partner for the high-intensity EUV light source in TNO’s EBL2 facility, this extended partnership emphasized a commitment to continued innovation.
  • In August 2023, Hamamatsu Photonics K.K. announced the completion of a new factory building. The company constructed a new factory Building No. 11 at its Toyooka factory site (Shimokanzo, Iwata City, Japan) to accommodate the growing sales of microfocus X-ray sources (MFX) and other electron tube products.
  • In January 2022, Excelitas Technologies Corp. unveiled the new µPAX-3 Pulsed Xenon Light Source, featuring an innovative lamp design and cutting-edge circuitry and components within a packaged light source. This device delivers microsecond-duration pulses of broadband light with remarkable arc stability. Housed in a small cubic format, the µPAX-3 module integrates a flash lamp, trigger circuit, capacitor charging power supply, and precision arc alignment.

Frequently Asked Questions(FAQs):

To speak to our analyst for a discussion on the above findings, click Speak to Analyst

TABLE OF CONTENTS
 
1 INTRODUCTION (Page No. - 30)
    1.1 STUDY OBJECTIVES 
    1.2 MARKET DEFINITION 
    1.3 STUDY SCOPE 
           1.3.1 MARKETS COVERED
                    FIGURE 1 ARC-BASED PLASMA LIGHTING MARKET SEGMENTATION
           1.3.2 REGIONAL SCOPE
                    FIGURE 2 ARC-BASED PLASMA LIGHTING MARKET: REGIONAL SCOPE
           1.3.3 INCLUSIONS AND EXCLUSIONS
           1.3.3.1 Inclusions and exclusions: By company
           1.3.3.2 Inclusions and exclusions: By light source
           1.3.3.3 Inclusions and exclusions: By wattage type
           1.3.3.4 inclusions and exclusions: By application
           1.3.3.5 Inclusions and exclusions: By region
           1.3.4 YEARS CONSIDERED
    1.4 CURRENCY CONSIDERED 
    1.5 UNITS CONSIDERED 
    1.6 LIMITATIONS 
    1.7 STAKEHOLDERS 
    1.8 IMPACT OF RECESSION 
 
2 RESEARCH METHODOLOGY (Page No. - 36)
    2.1 RESEARCH DATA 
           FIGURE 3 ARC-BASED PLASMA LIGHTING MARKET: RESEARCH DESIGN
           2.1.1 SECONDARY AND PRIMARY RESEARCH
           2.1.2 SECONDARY DATA
                    2.1.2.1 Key data from secondary sources
                    2.1.2.2 List of key secondary sources
           2.1.3 PRIMARY DATA
                    2.1.3.1 Key data from primary sources
                    2.1.3.2 Key industry insights
                    2.1.3.3 Breakdown of primaries
                    2.1.3.4 List of primary interview participants
    2.2 MARKET SIZE ESTIMATION METHODOLOGY 
           2.2.1 BOTTOM-UP APPROACH
                    2.2.1.1 Approach to arrive at market size using bottom-up analysis (demand side)
                               FIGURE 4 ARC-BASED PLASMA LIGHTING MARKET: BOTTOM-UP APPROACH
           2.2.2 TOP-DOWN APPROACH
                    2.2.2.1 Approach to arrive at market size using top-down analysis (supply side)
                               FIGURE 5 ARC-BASED PLASMA LIGHTING MARKET: TOP-DOWN APPROACH
    2.3 FACTOR ANALYSIS 
           2.3.1 SUPPLY-SIDE ANALYSIS
                    FIGURE 6 ARC-BASED PLASMA LIGHTING MARKET SIZE ESTIMATION METHODOLOGY: SUPPLY-SIDE ANALYSIS (APPROACH 1)
           2.3.2 DEMAND-SIDE ANALYSIS
                    FIGURE 7 ARC-BASED PLASMA LIGHTING MARKET SIZE ESTIMATION METHODOLOGY: DEMAND-SIDE ANALYSIS (APPROACH 2)
    2.4 MARKET BREAKDOWN AND DATA TRIANGULATION 
           FIGURE 8 ARC-BASED PLASMA LIGHTING MARKET: DATA TRIANGULATION
    2.5 RISK ASSESSMENT 
           TABLE 1 ARC-BASED PLASMA LIGHTING MARKET: RISK ASSESSMENT
    2.6 RESEARCH ASSUMPTIONS 
           FIGURE 9 ARC-BASED PLASMA LIGHTING MARKET: RESEARCH ASSUMPTIONS
    2.7 RESEARCH LIMITATIONS 
           FIGURE 10 ARC-BASED PLASMA LIGHTING MARKET: RESEARCH LIMITATIONS
    2.8 PARAMETERS CONSIDERED TO ANALYZE RECESSION IMPACT ON ARC-BASED PLASMA LIGHTING MARKET 
           TABLE 2 PARAMETERS CONSIDERED TO ANALYZE RECESSION IMPACT ON ARC-BASED PLASMA LIGHTING MARKET
 
3 EXECUTIVE SUMMARY (Page No. - 49)
    FIGURE 11 ARC-BASED PLASMA LIGHTING MARKET SIZE, 2020–2029 (USD MILLION)
    FIGURE 12 XENON ARC LAMPS TO DOMINATE MARKET DURING FORECAST PERIOD
    FIGURE 13 501–1,500 W TO DEPICT HIGHEST CAGR IN ARC-BASED PLASMA LIGHTING MARKET, BY WATTAGE TYPE, FROM 2024 TO 2029
    FIGURE 14 ENTERTAINMENT & PROJECTION APPLICATION TO ACCOUNT FOR LARGEST MARKET SHARE IN 2029
    FIGURE 15 ASIA PACIFIC TO REGISTER HIGHEST CAGR BETWEEN 2024 AND 2029
 
4 PREMIUM INSIGHTS (Page No. - 53)
    4.1 ATTRACTIVE OPPORTUNITIES FOR PLAYERS IN ARC-BASED PLASMA LIGHTING MARKET 
           FIGURE 16 INCREASING RELIANCE ON LIGHTING SYSTEMS WITH HIGH COLOR RENDERING INDEX TO CONTRIBUTE TO MARKET GROWTH
    4.2 ARC-BASED PLASMA LIGHTING MARKET, BY LIGHT SOURCE 
           FIGURE 17 XENON ARC LAMPS HELD LARGEST SHARE OF ARC-BASED PLASMA LIGHTING MARKET, BY LIGHT SOURCE, IN 2023
    4.3 ARC-BASED PLASMA LIGHTING MARKET, BY WATTAGE TYPE 
           FIGURE 18 ABOVE 1,500 W TO ACCOUNT FOR LARGEST MARKET SHARE IN 2029
    4.4 ARC-BASED PLASMA LIGHTING MARKET, BY APPLICATION 
           FIGURE 19 ENTERTAINMENT & PROJECTION APPLICATION TO DOMINATE MARKET DURING FORECAST PERIOD
    4.5 ARC-BASED PLASMA LIGHTING MARKET, BY REGION 
           FIGURE 20 ASIA PACIFIC TO HOLD LARGEST SHARE OF ARC-BASED PLASMA LIGHTING MARKET IN 2029
 
5 MARKET OVERVIEW (Page No. - 56)
    5.1 INTRODUCTION 
    5.2 MARKET DYNAMICS 
           FIGURE 21 ARC-BASED PLASMA LIGHTING MARKET: DRIVERS, RESTRAINTS, OPPORTUNITIES, AND CHALLENGES
           5.2.1 DRIVERS
                    5.2.1.1 Escalating demand for high CRI lighting in healthcare facilities
                    5.2.1.2 Increasing adoption of movie projectors to offer enhanced viewing experience
                               FIGURE 22 IMPACT ANALYSIS: DRIVERS
           5.2.2 RESTRAINTS
                    5.2.2.1 Increasing deployment of LED lighting technology as substitute
                    5.2.2.2 Need for periodic replacement of HID lamps
                               FIGURE 23 IMPACT ANALYSIS: RESTRAINTS
           5.2.3 OPPORTUNITIES
                    5.2.3.1 Growing use of plasma arc lamps in diverse applications owing to ability to withstand vibration and shock
                               FIGURE 24 IMPACT ANALYSIS: OPPORTUNITIES
           5.2.4 CHALLENGES
                    5.2.4.1 Environmental impacts associated with disposal of arc-based plasma lamps
                    5.2.4.2 Ensuring compliance with diverse regulatory requirements
                               FIGURE 25 IMPACT ANALYSIS: CHALLENGES
    5.3 SUPPLY CHAIN ANALYSIS 
           FIGURE 26 ARC-BASED PLASMA LIGHTING MARKET: SUPPLY CHAIN ANALYSIS
    5.4 ECOSYSTEM ANALYSIS 
           TABLE 3 ROLE OF COMPANIES IN ARC-BASED PLASMA LIGHTING ECOSYSTEM
           FIGURE 27 ARC-BASED PLASMA LIGHTING ECOSYSTEM
    5.5 PRICING ANALYSIS 
           5.5.1 AVERAGE SELLING PRICE OF XENON ARC LAMPS OFFERED BY KEY PLAYERS, BY WATTAGE TYPE
                    FIGURE 28 AVERAGE SELLING PRICE OF XENON ARC LAMPS OFFERED BY KEY PLAYERS, BY WATTAGE TYPE
                    TABLE 4 AVERAGE SELLING PRICE OF XENON ARC LAMPS OFFERED BY KEY PLAYERS, BY WATTAGE TYPE (USD)
           5.5.2 AVERAGE SELLING PRICE OF XENON ARC LAMPS BELOW 500 W, BY REGION, 2019–2023
                    FIGURE 29 AVERAGE SELLING PRICE OF XENON ARC LAMPS BELOW 500 W, BY REGION, 2019–2023
    5.6 TRENDS/DISRUPTIONS IMPACTING CUSTOMERS’ BUSINESSES 
           FIGURE 30 ARC-BASED PLASMA LIGHTING MARKET: TRENDS/DISRUPTIONS IMPACTING CUSTOMERS’ BUSINESSES
    5.7 TECHNOLOGY ANALYSIS 
           5.7.1 KEY TECHNOLOGY
                    5.7.1.1 High-intensity discharge (HID) lamps
           5.7.2 COMPLEMENTARY TECHNOLOGY
                    5.7.2.1 Light-emitting plasma (LEP)
           5.7.3 ADJACENT TECHNOLOGY
                    5.7.3.1 Light-emitting diode (LED)
    5.8 PORTER’S FIVE FORCES ANALYSIS 
           TABLE 5 ARC-BASED PLASMA LIGHTING MARKET: PORTER’S FIVE FORCES ANALYSIS
           FIGURE 31 ARC-BASED PLASMA LIGHTING MARKET: PORTER’S FIVE FORCES ANALYSIS
           5.8.1 THREAT OF NEW ENTRANTS
           5.8.2 THREAT OF SUBSTITUTES
           5.8.3 BARGAINING POWER OF SUPPLIERS
           5.8.4 BARGAINING POWER OF BUYERS
           5.8.5 INTENSITY OF COMPETITIVE RIVALRY
    5.9 REGULATORY LANDSCAPE AND STANDARDS 
           5.9.1 REGULATORY BODIES, GOVERNMENT AGENCIES, AND OTHER ORGANIZATIONS
                    TABLE 6 NORTH AMERICA: LIST OF REGULATORY BODIES, GOVERNMENT AGENCIES, AND OTHER ORGANIZATIONS
                    TABLE 7 EUROPE: LIST OF REGULATORY BODIES, GOVERNMENT AGENCIES, AND OTHER ORGANIZATIONS
                    TABLE 8 ASIA PACIFIC: LIST OF REGULATORY BODIES, GOVERNMENT AGENCIES, AND OTHER ORGANIZATIONS
                    TABLE 9 ROW: LIST OF REGULATORY BODIES, GOVERNMENT AGENCIES, AND OTHER ORGANIZATIONS
           5.9.2 REGULATORY STANDARDS
                    5.9.2.1 North America
                               5.9.2.1.1 US
                               5.9.2.1.2 Canada
                               5.9.2.1.3 Mexico
                    5.9.2.2 Europe
                               5.9.2.2.1 Switzerland
                               5.9.2.2.2 Germany
                               5.9.2.2.3 France
                    5.9.2.3 Asia Pacific
                               5.9.2.3.1 China
                               5.9.2.3.2 India
                    5.9.2.4 RoW
                               5.9.2.4.1 UAE
                               5.9.2.4.2 Saudi Arabia
    5.10 KEY STAKEHOLDERS AND BUYING CRITERIA 
           5.10.1 KEY STAKEHOLDERS IN BUYING PROCESS
           FIGURE 32 ARC-BASED PLASMA LIGHTING MARKET: INFLUENCE OF STAKEHOLDERS ON BUYING PROCESS FOR TOP THREE APPLICATIONS
           TABLE 10 ARC-BASED PLASMA LIGHTING MARKET: INFLUENCE OF STAKEHOLDERS ON BUYING PROCESS FOR TOP THREE APPLICATIONS (%)
           5.10.2 BUYING CRITERIA
           FIGURE 33 ARC-BASED PLASMA LIGHTING MARKET: KEY BUYING CRITERIA FOR TOP THREE APPLICATIONS
           TABLE 11 ARC-BASED PLASMA LIGHTING MARKET: KEY BUYING CRITERIA FOR TOP THREE APPLICATIONS
    5.11 CASE STUDY ANALYSIS 
           5.11.1 HELSINKI EVALUATES SYLVANIA LIGHTING’S RELUMINA LAMPS FOR EFFICIENT ILLUMINATION OF RESIDENTIAL BUILDINGS
           5.11.2 LG INSTALLS PLASMA LIGHTING SYSTEMS TO ACHIEVE DESIRED ILLUMINATION TARGETS IN NEW WAREHOUSE IN SOUTH KOREA
           5.11.3 POSCO INSTALLS PLASMA LAMPS IN INTEGRATED MILLS IN SOUTH KOREA TO MEET ILLUMINATION REQUIREMENTS
    5.12 TRADE ANALYSIS 
           5.12.1 IMPORT SCENARIO
           FIGURE 34 ARC-BASED PLASMA LIGHTING MARKET: IMPORT DATA FOR HS CODE 853941-COMPLIANT ARC LAMPS, 2018–2022
           FIGURE 35 ARC-BASED PLASMA LIGHTING MARKET: IMPORT DATA FOR HS CODE 853932-COMPLIANT MERCURY OR SODIUM VAPOR LAMPS; METAL HALIDE LAMPS, 2018–2022
           5.12.2 EXPORT SCENARIO
           FIGURE 36 ARC-BASED PLASMA LIGHTING MARKET: EXPORT DATA FOR HS CODE 853941-COMPLIANT ARC LAMPS, 2018–2022
           FIGURE 37 ARC-BASED PLASMA LIGHTING MARKET: EXPORT DATA FOR HS CODE 853932-COMPLIANT MERCURY OR SODIUM VAPOR LAMPS; METAL HALIDE LAMPS, 2018–2022
    5.13 PATENT ANALYSIS 
           FIGURE 38 ARC-BASED PLASMA LIGHTING MARKET: PATENTS APPLIED AND GRANTED, 2014–2023
           TABLE 12 ARC-BASED PLASMA LIGHTING MARKET: LIST OF KEY PATENTS, 2020–2023
    5.14 KEY CONFERENCES AND EVENTS, 2024–2025 
           TABLE 13 ARC-BASED PLASMA LIGHTING MARKET: LIST OF KEY CONFERENCES AND EVENTS, 2024–2025
 
6 ARC-BASED PLASMA LIGHTING MARKET, BY LIGHT SOURCE (Page No. - 88)
    6.1 INTRODUCTION 
           FIGURE 39 METAL HALIDE LAMPS TO EXHIBIT HIGHEST CAGR IN ARC-BASED PLASMA LIGHTING MARKET, BY LIGHT SOURCE, DURING FORECAST PERIOD
           TABLE 14 ARC-BASED PLASMA LIGHTING MARKET, BY LIGHT SOURCE, 2020–2023 (USD MILLION)
           TABLE 15 ARC-BASED PLASMA LIGHTING MARKET, BY LIGHT SOURCE, 2024–2029 (USD MILLION)
    6.2 XENON ARC LAMPS 
           6.2.1 ABILITY TO EMIT LIGHT WITH HIGH INTENSITY AND COLOR RENDERING TO BOOST DEMAND FOR XENON ARC LAMPS
                    TABLE 16 XENON ARC LAMPS: ARC-BASED PLASMA LIGHTING MARKET, BY APPLICATION, 2020–2023 (USD MILLION)
                    TABLE 17 XENON ARC LAMPS: ARC-BASED PLASMA LIGHTING MARKET, BY APPLICATION, 2024–2029 (USD MILLION)
                    TABLE 18 XENON ARC LAMPS: ARC-BASED PLASMA LIGHTING MARKET FOR ENTERTAINMENT & PROJECTION, BY WATTAGE TYPE, 2020–2023 (USD MILLION)
                    TABLE 19 XENON ARC LAMPS: ARC-BASED PLASMA LIGHTING MARKET FOR ENTERTAINMENT & PROJECTION, BY WATTAGE TYPE, 2024–2029 (USD MILLION)
                    TABLE 20 XENON ARC LAMPS: ARC-BASED PLASMA LIGHTING MARKET FOR SOLAR SIMULATION & ENVIRONMENT TESTING, BY WATTAGE TYPE, 2020–2023 (USD MILLION)
                    TABLE 21 XENON ARC LAMPS: ARC-BASED PLASMA LIGHTING MARKET FOR SOLAR SIMULATION & ENVIRONMENT TESTING, BY WATTAGE TYPE, 2024–2029 (USD MILLION)
                    TABLE 22 XENON ARC LAMPS: ARC-BASED PLASMA LIGHTING MARKET FOR SEARCHLIGHT & SPOTLIGHT, BY WATTAGE TYPE, 2020–2023 (USD MILLION)
                    TABLE 23 XENON ARC LAMPS: ARC-BASED PLASMA LIGHTING MARKET FOR SEARCHLIGHT & SPOTLIGHT, BY WATTAGE TYPE, 2024–2029 (USD MILLION)
                    TABLE 24 XENON ARC LAMPS: ARC-BASED PLASMA LIGHTING MARKET FOR UV, BY WATTAGE TYPE, 2020–2023 (USD MILLION)
                    TABLE 25 XENON ARC LAMPS: ARC-BASED PLASMA LIGHTING MARKET FOR UV, BY WATTAGE TYPE, 2024–2029 (USD MILLION)
                    TABLE 26 XENON ARC LAMPS: ARC-BASED PLASMA LIGHTING MARKET FOR MEDICAL LIGHTING, BY WATTAGE TYPE, 2020–2023 (USD MILLION)
                    TABLE 27 XENON ARC LAMPS: ARC-BASED PLASMA LIGHTING MARKET FOR MEDICAL LIGHTING, BY WATTAGE TYPE, 2024–2029 (USD MILLION)
                    TABLE 28 XENON ARC LAMPS: ARC-BASED PLASMA LIGHTING MARKET FOR MICROSCOPIC LIGHTING, BY WATTAGE TYPE, 2020–2023 (USD MILLION)
                    TABLE 29 XENON ARC LAMPS: ARC-BASED PLASMA LIGHTING MARKET FOR MICROSCOPIC LIGHTING, BY WATTAGE TYPE, 2024–2029 (USD MILLION)
                    TABLE 30 XENON ARC LAMPS: ARC-BASED PLASMA LIGHTING MARKET FOR SPECTROSCOPY, BY WATTAGE TYPE, 2020–2023 (USD MILLION)
                    TABLE 31 XENON ARC LAMPS: ARC-BASED PLASMA LIGHTING MARKET FOR SPECTROSCOPY, BY WATTAGE TYPE, 2024–2029 (USD MILLION)
                    TABLE 32 XENON ARC LAMPS: ARC-BASED PLASMA LIGHTING MARKET, BY WATTAGE TYPE, 2020–2023 (USD MILLION)
                    TABLE 33 XENON ARC LAMPS: ARC-BASED PLASMA LIGHTING MARKET, BY WATTAGE TYPE, 2024–2029 (USD MILLION)
                    TABLE 34 XENON ARC LAMPS: ARC-BASED PLASMA LIGHTING MARKET FOR ENTERTAINMENT & PROJECTION, BY SUB-APPLICATION, 2020–2023 (USD MILLION)
                    TABLE 35 XENON ARC LAMPS: ARC-BASED PLASMA LIGHTING MARKET FOR ENTERTAINMENT & PROJECTION, BY SUB-APPLICATION, 2024–2029 (USD MILLION)
                    TABLE 36 XENON ARC LAMPS: ARC-BASED PLASMA LIGHTING MARKET FOR SOLAR SIMULATION & ENVIRONMENT TESTING, BY SUB-APPLICATION, 2020–2023 (USD MILLION)
                    TABLE 37 XENON ARC LAMPS: ARC-BASED PLASMA LIGHTING MARKET FOR SOLAR SIMULATION & ENVIRONMENT TESTING, BY SUB-APPLICATION, 2024–2029 (USD MILLION)
                    TABLE 38 XENON ARC LAMPS: ARC-BASED PLASMA LIGHTING MARKET FOR SEARCHLIGHT & SPOTLIGHT, BY SUB-APPLICATION, 2020–2023 (USD MILLION)
                    TABLE 39 XENON ARC LAMPS: ARC-BASED PLASMA LIGHTING MARKET FOR SEARCHLIGHT & SPOTLIGHT, BY SUB-APPLICATION, 2024–2029 (USD MILLION)
                    TABLE 40 XENON ARC LAMPS: ARC-BASED PLASMA LIGHTING MARKET FOR MEDICAL LIGHTING, BY SUB-APPLICATION, 2020–2023 (USD MILLION)
                    TABLE 41 XENON ARC LAMPS: ARC-BASED PLASMA LIGHTING MARKET FOR MEDICAL LIGHTING, BY SUB-APPLICATION, 2024–2029 (USD MILLION)
                    TABLE 42 XENON ARC LAMPS: ARC-BASED PLASMA LIGHTING MARKET FOR MICROSCOPIC LIGHTING, BY SUB-APPLICATION, 2020–2023 (USD MILLION)
                    TABLE 43 XENON ARC LAMPS: ARC-BASED PLASMA LIGHTING MARKET FOR MICROSCOPIC LIGHTING, BY SUB-APPLICATION, 2024–2029 (USD MILLION)
                    TABLE 44 XENON ARC LAMPS: ARC-BASED PLASMA LIGHTING MARKET, BY REGION, 2020–2023 (USD MILLION)
                    TABLE 45 XENON ARC LAMPS: ARC-BASED PLASMA LIGHTING MARKET, BY REGION, 2024–2029 (USD MILLION)
                    TABLE 46 XENON ARC LAMPS: ARC-BASED PLASMA LIGHTING MARKET, BY WATTAGE TYPE, 2020–2023 (THOUSAND UNITS)
                    TABLE 47 XENON ARC LAMPS: ARC-BASED PLASMA LIGHTING MARKET, BY WATTAGE TYPE, 2024–2029 (THOUSAND UNITS)
    6.3 METAL HALIDE LAMPS 
           6.3.1 USE OF METAL HALIDE LAMPS TO ENSURE OPTIMAL LIGHT OUTPUT TO FUEL SEGMENTAL GROWTH
                    TABLE 48 METAL HALIDE LAMPS: ARC-BASED PLASMA LIGHTING MARKET, BY APPLICATION, 2020–2023 (USD MILLION)
                    TABLE 49 METAL HALIDE LAMPS: ARC-BASED PLASMA LIGHTING MARKET, BY APPLICATION, 2024–2029 (USD MILLION)
                    TABLE 50 METAL HALIDE LAMPS: ARC-BASED PLASMA LIGHTING MARKET FOR ENTERTAINMENT & PROJECTION, BY WATTAGE TYPE, 2020–2023 (USD MILLION)
                    TABLE 51 METAL HALIDE LAMPS: ARC-BASED PLASMA LIGHTING MARKET FOR ENTERTAINMENT & PROJECTION, BY WATTAGE TYPE, 2024–2029 (USD MILLION)
                    TABLE 52 METAL HALIDE LAMPS: ARC-BASED PLASMA LIGHTING MARKET FOR SEARCHLIGHT & SPOTLIGHT, BY WATTAGE TYPE, 2020–2023 (USD MILLION)
                    TABLE 53 METAL HALIDE LAMPS: ARC-BASED PLASMA LIGHTING MARKET FOR SEARCHLIGHT & SPOTLIGHT, BY WATTAGE TYPE, 2024–2029 (USD MILLION)
                    TABLE 54 METAL HALIDE LAMPS: ARC-BASED PLASMA LIGHTING MARKET FOR MICROSCOPIC LIGHTING, BY WATTAGE TYPE, 2020–2023 (USD MILLION)
                    TABLE 55 METAL HALIDE LAMPS: ARC-BASED PLASMA LIGHTING MARKET FOR MICROSCOPIC LIGHTING, BY WATTAGE TYPE, 2024–2029 (USD MILLION)
                    TABLE 56 METAL HALIDE LAMPS: ARC-BASED PLASMA LIGHTING MARKET, BY WATTAGE TYPE, 2020–2023 (USD MILLION)
                    TABLE 57 METAL HALIDE LAMPS: ARC-BASED PLASMA LIGHTING MARKET, BY WATTAGE TYPE, 2024–2029 (USD MILLION)
                    TABLE 58 METAL HALIDE LAMPS: ARC-BASED PLASMA LIGHTING MARKET FOR ENTERTAINMENT & PROJECTION, BY SUB-APPLICATION, 2020–2023 (USD MILLION)
                    TABLE 59 METAL HALIDE LAMPS: ARC-BASED PLASMA LIGHTING MARKET FOR ENTERTAINMENT & PROJECTION, BY SUB-APPLICATION, 2024–2029 (USD MILLION)
                    TABLE 60 METAL HALIDE LAMPS: ARC-BASED PLASMA LIGHTING MARKET FOR SEARCHLIGHT & SPOTLIGHT, BY SUB-APPLICATION, 2020–2023 (USD MILLION)
                    TABLE 61 METAL HALIDE LAMPS: ARC-BASED PLASMA LIGHTING MARKET FOR SEARCHLIGHT & SPOTLIGHT, BY SUB-APPLICATION, 2024–2029 (USD MILLION)
                    TABLE 62 METAL HALIDE LAMPS: ARC-BASED PLASMA LIGHTING MARKET, BY REGION, 2020–2023 (USD MILLION)
                    TABLE 63 METAL HALIDE LAMPS: ARC-BASED PLASMA LIGHTING MARKET, BY REGION, 2024–2029 (USD MILLION)
    6.4 KRYPTON ARC LAMPS 
           6.4.1 STABILITY AND LONG LIFESPAN TO BOOST ADOPTION OF KRYPTON ARC LAMPS
                    TABLE 64 KRYPTON ARC LAMPS: ARC-BASED PLASMA LIGHTING MARKET, BY APPLICATION, 2020–2023 (USD MILLION)
                    TABLE 65 KRYPTON ARC LAMPS: ARC-BASED PLASMA LIGHTING MARKET, BY APPLICATION, 2024–2029 (USD MILLION)
                    TABLE 66 KRYPTON ARC LAMPS: ARC-BASED PLASMA LIGHTING MARKET FOR LASER PUMPING, BY WATTAGE TYPE, 2020–2023 (USD MILLION)
                    TABLE 67 KRYPTON ARC LAMPS: ARC-BASED PLASMA LIGHTING MARKET FOR LASER PUMPING, BY WATTAGE TYPE, 2024–2029 (USD MILLION)
                    TABLE 68 KRYPTON ARC LAMPS: ARC-BASED PLASMA LIGHTING MARKET FOR MEDICAL LIGHTING, BY WATTAGE TYPE, 2020–2023 (USD MILLION)
                    TABLE 69 KRYPTON ARC LAMPS: ARC-BASED PLASMA LIGHTING MARKET FOR MEDICAL LIGHTING, BY WATTAGE TYPE, 2024–2029 (USD MILLION)
                    TABLE 70 KRYPTON ARC LAMPS: ARC-BASED PLASMA LIGHTING MARKET FOR SPECTROSCOPY, BY WATTAGE TYPE, 2020–2023 (USD MILLION)
                    TABLE 71 KRYPTON ARC LAMPS: ARC-BASED PLASMA LIGHTING MARKET FOR SPECTROSCOPY, BY WATTAGE TYPE, 2024–2029 (USD MILLION)
                    TABLE 72 KRYPTON ARC LAMPS: ARC-BASED PLASMA LIGHTING MARKET, BY WATTAGE TYPE, 2020–2023 (USD MILLION)
                    TABLE 73 KRYPTON ARC LAMPS: ARC-BASED PLASMA LIGHTING MARKET, BY WATTAGE TYPE, 2024–2029 (USD MILLION)
                    TABLE 74 KRYPTON ARC LAMPS: ARC-BASED PLASMA LIGHTING MARKET, BY REGION, 2020–2023 (USD MILLION)
                    TABLE 75 KRYPTON ARC LAMPS: ARC-BASED PLASMA LIGHTING MARKET, BY REGION, 2024–2029 (USD MILLION)
    6.5 MERCURY VAPOR LAMPS 
           6.5.1 INSTALLATION OF MERCURY VAPOR LAMPS TO ADDRESS STRONG ILLUMINATION REQUIREMENTS TO DRIVE MARKET
                    TABLE 76 MERCURY VAPOR LAMPS: ARC-BASED PLASMA LIGHTING MARKET, BY APPLICATION, 2020–2023 (USD MILLION)
                    TABLE 77 MERCURY VAPOR LAMPS: ARC-BASED PLASMA LIGHTING MARKET, BY APPLICATION, 2024–2029 (USD MILLION)
                    TABLE 78 MERCURY VAPOR LAMPS: ARC-BASED PLASMA LIGHTING MARKET FOR OTHER APPLICATIONS, BY WATTAGE TYPE, 2020–2023 (USD MILLION)
                    TABLE 79 MERCURY VAPOR LAMPS: ARC-BASED PLASMA LIGHTING MARKET FOR OTHER APPLICATIONS, BY WATTAGE TYPE, 2024–2029 (USD MILLION)
                    TABLE 80 MERCURY VAPOR LAMPS: ARC-BASED PLASMA LIGHTING MARKET FOR OTHER APPLICATIONS, BY SUB-APPLICATION, 2020–2023 (USD MILLION)
                    TABLE 81 MERCURY VAPOR LAMPS: ARC-BASED PLASMA LIGHTING MARKET FOR OTHER APPLICATIONS, BY SUB-APPLICATION, 2024–2029 (USD MILLION)
                    TABLE 82 MERCURY VAPOR LAMPS: ARC-BASED PLASMA LIGHTING MARKET, BY REGION, 2020–2023 (USD MILLION)
                    TABLE 83 MERCURY VAPOR LAMPS: ARC-BASED PLASMA LIGHTING MARKET, BY REGION, 2024–2029 (USD MILLION)
    6.6 DEUTERIUM LAMPS 
           6.6.1 ENHANCED UV EMISSIVITY OF DEUTERIUM TO ACCELERATE SEGMENTAL GROWTH
                    TABLE 84 DEUTERIUM LAMPS: ARC-BASED PLASMA LIGHTING MARKET, BY APPLICATION, 2020–2023 (USD MILLION)
                    TABLE 85 DEUTERIUM LAMPS: ARC-BASED PLASMA LIGHTING MARKET, BY APPLICATION, 2024–2029 (USD MILLION)
                    TABLE 86 DEUTERIUM LAMPS: ARC-BASED PLASMA LIGHTING MARKET, BY REGION, 2020–2023 (USD MILLION)
                    TABLE 87 DEUTERIUM LAMPS: ARC-BASED PLASMA LIGHTING MARKET, BY REGION, 2024–2029 (USD MILLION)
 
7 ARC-BASED PLASMA LIGHTING MARKET, BY WATTAGE TYPE (Page No. - 115)
    7.1 INTRODUCTION 
           FIGURE 40 501–1,500 W TO REGISTER HIGHEST CAGR IN ARC-BASED PLASMA LIGHTING MARKET, BY WATTAGE TYPE, DURING FORECAST PERIOD
           TABLE 88 ARC-BASED PLASMA LIGHTING MARKET, BY WATTAGE TYPE, 2020–2023 (USD MILLION)
           TABLE 89 ARC-BASED PLASMA LIGHTING MARKET, BY WATTAGE TYPE, 2024–2029 (USD MILLION)
    7.2 BELOW 500 W 
           7.2.1 COMPACT SIZE AND LOW POWER CONSUMPTION OF PLASMA ARC LAMPS BELOW 500 W TO FOSTER SEGMENTAL GROWTH
                    TABLE 90 BELOW 500 W: ARC-BASED PLASMA LIGHTING MARKET, BY LIGHT SOURCE, 2020–2023 (USD MILLION)
                    TABLE 91 BELOW 500 W: ARC-BASED PLASMA LIGHTING MARKET, BY LIGHT SOURCE, 2024–2029 (USD MILLION)
    7.3 501–1,500 W 
           7.3.1 ACCURATE COLOR REPRODUCTION AND SPECTRAL MATCHING TO AUGMENT DEMAND FOR 501–1,500 W PLASMA ARC LAMPS
                    TABLE 92 501–1,500 W: ARC-BASED PLASMA LIGHTING MARKET, BY LIGHT SOURCE, 2020–2023 (USD MILLION)
                    TABLE 93 501–1,500 W: ARC-BASED PLASMA LIGHTING MARKET, BY LIGHT SOURCE, 2024–2029 (USD MILLION)
    7.4 ABOVE 1,500 W 
           7.4.1 SAFE NAVIGATION IN PORT FACILITIES THROUGH POWERFUL ILLUMINATION OF PLASMA ARC LAMPS ABOVE 1,500 W TO PROPEL MARKET
                    TABLE 94 ABOVE 1,500 W: ARC-BASED PLASMA LIGHTING MARKET, BY LIGHT SOURCE, 2020–2023 (USD MILLION)
                    TABLE 95 ABOVE 1,500 W: ARC-BASED PLASMA LIGHTING MARKET, BY LIGHT SOURCE, 2024–2029 (USD MILLION)
 
8 ARC-BASED PLASMA LIGHTING MARKET, BY APPLICATION (Page No. - 121)
    8.1 INTRODUCTION 
           FIGURE 41 ENTERTAINMENT & PROJECTION APPLICATION TO DOMINATE MARKET DURING FORECAST PERIOD
           TABLE 96 ARC-BASED PLASMA LIGHTING MARKET, BY APPLICATION, 2020–2023 (USD MILLION)
           TABLE 97 ARC-BASED PLASMA LIGHTING MARKET, BY APPLICATION, 2024–2029 (USD MILLION)
    8.2 ENTERTAINMENT & PROJECTION 
           TABLE 98 ENTERTAINMENT & PROJECTION: ARC-BASED PLASMA LIGHTING MARKET, BY SUB-APPLICATION, 2020–2023 (USD MILLION)
           TABLE 99 ENTERTAINMENT & PROJECTION: ARC-BASED PLASMA LIGHTING MARKET, BY SUB-APPLICATION, 2024–2029 (USD MILLION)
           8.2.1 CINEMA PROJECTORS
                    8.2.1.1 Use of xenon arc lamps to enhance color reproduction of cinema projectors to augment segmental growth
           8.2.2 LARGE VENUE PROJECTORS
                    8.2.2.1 Adoption of liquid-cooled lamps in large-scale searchlights and solar simulators to boost segmental growth
           8.2.3 PHOTOGRAPHY
                    8.2.3.1 Utilization of xenon arc lamps to provide instant flash in photographic applications to drive market
           8.2.4 SCENERY LIGHTING
                    8.2.4.1 Reliance on xenon arc lamps to create immersive lighting effects in theatrical productions to propel market
           8.2.5 LARGE VENUE LIGHTING
                    8.2.5.1 Installation of metal halide lamps to provide powerful, directed lighting in outdoor settings to foster segmental growth
    8.3 SEARCHLIGHT & SPOTLIGHT 
           TABLE 100 SEARCHLIGHT & SPOTLIGHT: ARC-BASED PLASMA LIGHTING MARKET, BY SUB-APPLICATION, 2020–2023 (USD MILLION)
           TABLE 101 SEARCHLIGHT & SPOTLIGHT: ARC-BASED PLASMA LIGHTING MARKET, BY SUB-APPLICATION, 2024–2029 (USD MILLION)
           8.3.1 MILITARY
                    8.3.1.1 Use of xenon arc lamps in laser-based weapon systems to accelerate segmental growth
           8.3.2 CIVIL & LAND
                    8.3.2.1 Adoption of xenon arc lamps as land-based searchlights in search and rescue operations to propel market
           8.3.3 AIR & RUNWAYS
                    8.3.3.1 Installation of xenon arc lamps to provide clear visibility for safe aircraft landings to contribute to segmental growth
           8.3.4 MARITIME & PORTS
                    8.3.4.1 Reliance on xenon arc lamps to identify navigational hazards and reduce maritime risks to boost segmental growth
    8.4 SOLAR SIMULATION & ENVIRONMENTAL TESTING 
           8.4.1 REQUIREMENT FOR ARC-BASED PLASMA LAMPS TO TEST DURABILITY OF SOLAR PANELS AND PV CELLS TO CONTRIBUTE TO SEGMENTAL GROWTH
           8.4.2 AUTOMOTIVE
           8.4.3 PHOTOVOLTAIC
           8.4.4 AERONAUTIC & AEROSPACE
           8.4.5 EQUIVALENT SUN HOURS
           8.4.6 UV COMPATIBILITY ASSESSMENT
           8.4.7 OTHER SOLAR SIMULATION & ENVIRONMENTAL TESTING APPLICATIONS
    8.5 SPECTROSCOPY 
           8.5.1 UTILIZATION OF ARC-BASED PLASMA LAMPS IN SPECTROSCOPIC ANALYSES REQUIRING WIDE SPECTRAL COVERAGE TO AUGMENT SEGMENTAL GROWTH
           8.5.2 BROADBAND LIGHT SOURCE
           8.5.3 ABSORPTIVITY MEASUREMENTS
           8.5.4 UV SPECTROSCOPY
           8.5.5 SPECTROPHOTOMETRY
           8.5.6 HIGH-PERFORMANCE & ULTRA-HIGH-PERFORMANCE LIQUID CHROMATOGRAPHY
           8.5.7 FAST PROTEIN LIQUID CHROMATOGRAPHY
    8.6 MEDICAL LIGHTING 
           8.6.1 RELIANCE ON PLASMA ARC LAMPS TO ENSURE HIGH COLOR ACCURACY IN TISSUE VISUALIZATION TO FUEL SEGMENTAL GROWTH
           8.6.2 ENDOSCOPIC LIGHTING
           8.6.3 DENTAL & SURGICAL LIGHTING
           8.6.4 SAMPLE IDENTIFICATION & ANALYSIS
    8.7 MICROSCOPIC LIGHTING 
           8.7.1 ADOPTION OF ARC-BASED PLASMA LAMPS TO OBSERVE INTRICATE SPECIMEN TO DRIVE MARKET
    8.8 UV 
           8.8.1 UTILIZATION OF XENON ARC LAMPS IN UV CURING AND STERILIZATION TO CONTRIBUTE TO SEGMENTAL GROWTH
           8.8.2 OZONE PRODUCTION
           8.8.3 UV CURING
           8.8.4 ADHESIVE BONDING
           8.8.5 SURFACE DISINFECTION & STERILIZATION
           8.8.6 WATER TREATMENT & AIR PURIFICATION
    8.9 OTHER APPLICATIONS 
           TABLE 102 OTHER APPLICATIONS: ARC-BASED PLASMA LIGHTING MARKET BY SUB-APPLICATION, 2020–2023 (USD MILLION)
           TABLE 103 OTHER APPLICATIONS: ARC-BASED PLASMA LIGHTING MARKET BY SUB-APPLICATION, 2024–2029 (USD MILLION)
 
9 ARC-BASED PLASMA LIGHTING MARKET, BY REGION (Page No. - 146)
    9.1 INTRODUCTION 
           FIGURE 42 ARC-BASED PLASMA LIGHTING MARKET, BY REGION
           FIGURE 43 INDIA TO EXHIBIT HIGHEST CAGR IN ARC-BASED PLASMA LIGHTING MARKET BETWEEN 2024 AND 2029
           FIGURE 44 ASIA PACIFIC TO DOMINATE ARC-BASED PLASMA LIGHTING MARKET DURING FORECAST PERIOD
           TABLE 104 ARC-BASED PLASMA LIGHTING MARKET, BY REGION, 2020–2023 (USD MILLION)
           TABLE 105 ARC-BASED PLASMA LIGHTING MARKET, BY REGION, 2024–2029 (USD MILLION)
    9.2 NORTH AMERICA 
           FIGURE 45 NORTH AMERICA: ARC-BASED PLASMA LIGHTING MARKET SNAPSHOT
           9.2.1 RECESSION IMPACT ON ARC-BASED PLASMA LIGHTING MARKET IN NORTH AMERICA
                    TABLE 106 NORTH AMERICA: ARC-BASED PLASMA LIGHTING MARKET, BY COUNTRY, 2020–2023 (USD MILLION)
                    TABLE 107 NORTH AMERICA: ARC-BASED PLASMA LIGHTING MARKET, BY COUNTRY, 2024–2029 (USD MILLION)
                    TABLE 108 NORTH AMERICA: ARC-BASED PLASMA LIGHTING MARKET, BY LIGHT SOURCE, 2020–2023 (USD MILLION)
                    TABLE 109 NORTH AMERICA: ARC-BASED PLASMA LIGHTING MARKET, BY LIGHT SOURCE, 2024–2029 (USD MILLION)
           9.2.2 US
                    9.2.2.1 Growing preference for premium movie experiences to boost installation of arc-based plasma lighting solutions in theaters
           9.2.3 CANADA
                    9.2.3.1 Rising demand for immersive lighting experiences in sports arenas to drive market
           9.2.4 MEXICO
                    9.2.4.1 Increasing need for automotive environmental testing solutions to contribute to market growth
    9.3 EUROPE 
           FIGURE 46 EUROPE: ARC-BASED PLASMA LIGHTING MARKET SNAPSHOT
           9.3.1 RECESSION IMPACT ON ARC-BASED PLASMA LIGHTING MARKET IN EUROPE
                    TABLE 110 EUROPE: ARC-BASED PLASMA LIGHTING MARKET, BY COUNTRY, 2020–2023 (USD MILLION)
                    TABLE 111 EUROPE: ARC-BASED PLASMA LIGHTING MARKET, BY COUNTRY, 2024–2029 (USD MILLION)
                    TABLE 112 EUROPE: ARC-BASED PLASMA LIGHTING MARKET, BY LIGHT SOURCE, 2020–2023 (USD MILLION)
                    TABLE 113 EUROPE: ARC-BASED PLASMA LIGHTING MARKET, BY LIGHT SOURCE, 2024–2029 (USD MILLION)
           9.3.2 UK
                    9.3.2.1 Rising awareness about benefits of UV disinfection systems to foster market growth
           9.3.3 GERMANY
                    9.3.3.1 Increasing government initiatives to promote energy-efficient surgical lighting to accelerate market growth
           9.3.4 FRANCE
                    9.3.4.1 Growing demand for high-quality lighting in entertainment settings to drive market
           9.3.5 REST OF EUROPE
    9.4 ASIA PACIFIC 
           FIGURE 47 ASIA PACIFIC: ARC-BASED PLASMA LIGHTING MARKET SNAPSHOT
           9.4.1 RECESSION IMPACT ON ARC-BASED PLASMA LIGHTING MARKET IN ASIA PACIFIC
                    TABLE 114 ASIA PACIFIC: ARC-BASED PLASMA LIGHTING MARKET, BY COUNTRY, 2020–2023 (USD MILLION)
                    TABLE 115 ASIA PACIFIC: ARC-BASED PLASMA LIGHTING MARKET, BY COUNTRY, 2024–2029 (USD MILLION)
                    TABLE 116 ASIA PACIFIC: ARC-BASED PLASMA LIGHTING MARKET, BY LIGHT SOURCE, 2020–2023 (USD MILLION)
                    TABLE 117 ASIA PACIFIC: ARC-BASED PLASMA LIGHTING MARKET, BY LIGHT SOURCE, 2024–2029 (USD MILLION)
           9.4.2 CHINA
                    9.4.2.1 Flourishing chip manufacturing to boost adoption of arc-based plasma lamps for photolithography equipment
           9.4.3 JAPAN
                    9.4.3.1 Rising popularity of theater lighting to contribute to market growth
           9.4.4 INDIA
                    9.4.4.1 Increasing need to develop sufficient effluent treatment facilities to drive demand for plasma UV lamps
           9.4.5 REST OF ASIA PACIFIC
    9.5 ROW 
           FIGURE 48 ROW: ARC-BASED PLASMA LIGHTING MARKET SNAPSHOT
           9.5.1 RECESSION IMPACT ON ARC-BASED PLASMA LIGHTING MARKET IN ROW
                    TABLE 118 ROW: ARC-BASED PLASMA LIGHTING MARKET, BY REGION, 2020–2023 (USD MILLION)
                    TABLE 119 ROW: ARC-BASED PLASMA LIGHTING MARKET, BY REGION, 2024–2029 (USD MILLION)
                    TABLE 120 ROW: ARC-BASED PLASMA LIGHTING MARKET, BY LIGHT SOURCE, 2020–2023 (USD MILLION)
                    TABLE 121 ROW: ARC-BASED PLASMA LIGHTING MARKET, BY LIGHT SOURCE, 2024–2029 (USD MILLION)
           9.5.2 SOUTH AMERICA
                    9.5.2.1 Rising emphasis on infrastructure development projects to accelerate market growth
           9.5.3 MIDDLE EAST & AFRICA
                    TABLE 122 MIDDLE EAST & AFRICA: ARC-BASED PLASMA LIGHTING MARKET, BY COUNTRY, 2020–2023 (USD MILLION)
                    TABLE 123 MIDDLE EAST & AFRICA: ARC-BASED PLASMA LIGHTING MARKET, BY COUNTRY, 2024–2029 (USD MILLION)
                    9.5.3.1 GCC countries
                                     9.5.3.1.1 Strong focus on water sterilization to fuel market growth
                    9.5.3.2 Rest of Middle East & Africa
                                     9.5.3.2.1 Rapid advancements in healthcare infrastructure to contribute to market growth
 
10 COMPETITIVE LANDSCAPE (Page No. - 167)
     10.1 INTRODUCTION 
     10.2 STRATEGIES ADOPTED BY KEY PLAYERS, 2020–2024 
             TABLE 124 STRATEGIES ADOPTED BY KEY PLAYERS IN ARC-BASED PLASMA LIGHTING MARKET, 2020–2024
     10.3 MARKET SHARE ANALYSIS, 2023 
             TABLE 125 ARC-BASED PLASMA LIGHTING MARKET: DEGREE OF COMPETITION
             FIGURE 49 ARC-BASED PLASMA LIGHTING MARKET SHARE ANALYSIS, 2023
     10.4 REVENUE ANALYSIS OF TOP FIVE PLAYERS, 2019–2023 
             FIGURE 50 REVENUE ANALYSIS OF TOP FIVE PLAYERS IN ARC-BASED PLASMA LIGHTING MARKET, 2019–2023
     10.5 COMPANY VALUATION AND FINANCIAL METRICS 
             FIGURE 51 COMPANY VALUATION (USD BILLION), 2023
             FIGURE 52 FINANCIAL METRICS (EV/EBITDA), 2023
     10.6 BRAND/PRODUCT COMPARISON 
             FIGURE 53 BRAND/PRODUCT COMPARISON
     10.7 COMPANY EVALUATION MATRIX: KEY PLAYERS, 2023 
             10.7.1 STARS
             10.7.2 EMERGING LEADERS
             10.7.3 PERVASIVE PLAYERS
             10.7.4 PARTICIPANTS
                        FIGURE 54 ARC-BASED PLASMA LIGHTING MARKET: COMPANY EVALUATION MATRIX (KEY PLAYERS), 2023
             10.7.5 COMPANY FOOTPRINT: KEY PLAYERS
                        10.7.5.1 Company footprint
                                     FIGURE 55 ARC-BASED PLASMA LIGHTING MARKET: COMPANY FOOTPRINT
                        10.7.5.2 Light source footprint
                                     TABLE 126 ARC-BASED PLASMA LIGHTING MARKET: LIGHT SOURCE FOOTPRINT
                        10.7.5.3 Wattage type footprint
                                     TABLE 127 ARC-BASED PLASMA LIGHTING MARKET: WATTAGE TYPE FOOTPRINT
                        10.7.5.4 Application footprint
                                     TABLE 128 ARC-BASED PLASMA LIGHTING MARKET: APPLICATION FOOTPRINT
                        10.7.5.5 Region footprint
                                     TABLE 129 ARC-BASED PLASMA LIGHTING MARKET: REGION FOOTPRINT
     10.8 COMPANY EVALUATION MATRIX: START-UPS/SMES, 2023 
             10.8.1 PROGRESSIVE COMPANIES
             10.8.2 RESPONSIVE COMPANIES
             10.8.3 DYNAMIC COMPANIES
             10.8.4 STARTING BLOCKS
                        FIGURE 56 ARC-BASED PLASMA LIGHTING MARKET: COMPANY EVALUATION MATRIX (START-UPS/SMES), 2023
             10.8.5 COMPETITIVE BENCHMARKING: START-UPS/SMES
                        10.8.5.1 List of key start-ups/SMEs
                                     TABLE 130 ARC-BASED PLASMA LIGHTING MARKET: LIST OF KEY START-UPS/SMES
                        10.8.5.2 Competitive benchmarking of key start-ups/SMEs
                                     TABLE 131 ARC-BASED PLASMA LIGHTING MARKET: COMPETITIVE BENCHMARKING FOR KEY START-UPS/SMES
     10.9 COMPETITIVE SITUATION AND TRENDS 
             10.9.1 PRODUCT LAUNCHES
                        TABLE 132 ARC-BASED PLASMA LIGHTING MARKET: PRODUCT LAUNCHES, MARCH 2020– JANUARY 2024
             10.9.2 DEALS
                        TABLE 133 ARC-BASED PLASMA LIGHTING MARKET: DEALS, MARCH 2020–JANUARY 2024
             10.9.3 EXPANSIONS
                        TABLE 134 ARC-BASED PLASMA LIGHTING MARKET: EXPANSIONS, MARCH 2020–JANUARY 2024
             10.9.4 OTHERS
                        TABLE 135 ARC-BASED PLASMA LIGHTING MARKET: OTHERS, MARCH 2020–JANUARY 2024
 
11 COMPANY PROFILES (Page No. - 187)
(Business Overview, Products/Solutions/Services Offered, Recent Developments, and MnM View (Key strengths/Right to Win, Strategic Choices Made, and Weaknesses and Competitive Threats))*  
     11.1 INTRODUCTION 
     11.2 KEY PLAYERS 
             11.2.1 USHIO INC.
                        TABLE 136 USHIO INC.: COMPANY OVERVIEW
                        FIGURE 57 USHIO INC.: COMPANY SNAPSHOT
                        TABLE 137 USHIO INC.: PRODUCTS/SOLUTIONS/SERVICES OFFERED
                        TABLE 138 USHIO INC.: DEALS
             11.2.2 AMS-OSRAM AG
                        TABLE 139 AMS-OSRAM AG: COMPANY OVERVIEW
                        FIGURE 58 AMS-OSRAM AG: COMPANY SNAPSHOT
                        TABLE 140 AMS-OSRAM AG: PRODUCTS/SOLUTIONS/SERVICES OFFERED
                        TABLE 141 AMS-OSRAM AG: DEALS
                        TABLE 142 AMS-OSRAM AG: OTHERS
             11.2.3 EXCELITAS TECHNOLOGIES CORP.
                        TABLE 143 EXCELITAS TECHNOLOGIES CORP.: COMPANY OVERVIEW
                        TABLE 144 EXCELITAS TECHNOLOGIES CORP.: PRODUCTS/SOLUTIONS/SERVICES OFFERED
                        TABLE 145 EXCELITAS TECHNOLOGIES CORP.: PRODUCT LAUNCHES
                        TABLE 146 EXCELITAS TECHNOLOGIES CORP.: DEALS
             11.2.4 SIGNIFY HOLDING
                        TABLE 147 SIGNIFY HOLDING: COMPANY OVERVIEW
                        FIGURE 59 SIGNIFY HOLDING: COMPANY SNAPSHOT
                        TABLE 148 SIGNIFY HOLDING: PRODUCTS/SOLUTIONS/SERVICES OFFERED
                        TABLE 149 SIGNIFY HOLDING: DEALS
             11.2.5 HAMAMATSU PHOTONICS K.K.
                        TABLE 150 HAMAMATSU PHOTONICS K.K.: COMPANY OVERVIEW
                        FIGURE 60 HAMAMATSU PHOTONICS K.K.: COMPANY SNAPSHOT
                        TABLE 151 HAMAMATSU PHOTONICS K.K.: PRODUCTS/SOLUTIONS/SERVICES OFFERED
                        TABLE 152 HAMAMATSU PHOTONICS K.K.: EXPANSIONS
             11.2.6 LEDVANCE GMBH
                        TABLE 153 LEDVANCE GMBH: COMPANY OVERVIEW
                        TABLE 154 LEDVANCE GMBH: PRODUCTS/SOLUTIONS/SERVICES OFFERED
             11.2.7 ADVANCED SPECIALTY LIGHTING
                        TABLE 155 ADVANCED SPECIALTY LIGHTING: COMPANY OVERVIEW
                        TABLE 156 ADVANCED SPECIALTY LIGHTING: PRODUCTS/SOLUTIONS/SERVICES OFFERED
             11.2.8 AMGLO KEMLITE LABORATORIES, INC.
                        TABLE 157 AMGLO KEMLITE LABORATORIES, INC.: COMPANY OVERVIEW
                        TABLE 158 AMGLO KEMLITE LABORATORIES, INC.: PRODUCTS/SOLUTIONS/SERVICES OFFERED
             11.2.9 SUPERIOR QUARTZ PRODUCTS, INC.
                        TABLE 159 SUPERIOR QUARTZ PRODUCTS, INC.: COMPANY OVERVIEW
                        TABLE 160 SUPERIOR QUARTZ PRODUCTS, INC.: PRODUCTS/SOLUTIONS/SERVICES OFFERED
             11.2.10 NEWPORT CORPORATION
                        TABLE 161 NEWPORT CORPORATION: COMPANY OVERVIEW
                        FIGURE 61 NEWPORT CORPORATION: COMPANY SNAPSHOT
                        TABLE 162 NEWPORT CORPORATION: PRODUCTS/SOLUTIONS/SERVICES OFFERED
     11.3 OTHER PLAYERS 
             11.3.1 VENTURE LIGHTING INTERNATIONAL
             11.3.2 THORLABS, INC.
             11.3.3 SCIENCETECH
             11.3.4 COLE-PARMER INSTRUMENT COMPANY, LLC
             11.3.5 LITETRONICS
             11.3.6 LARSON ELECTRONICS
             11.3.7 ADVANCED STROBE PRODUCTS, INC.
             11.3.8 AGILENT TECHNOLOGIES, INC.
             11.3.9 QUANTUM DESIGN INC.
             11.3.10 HELIOS QUARTZ GROUP
             11.3.11 APPLIED PHOTON TECHNOLOGY, INC.
             11.3.12 ADVANCED RADIATION CORPORATION
             11.3.13 DYMAX
             11.3.14 JELIGHT COMPANY INC.
             11.3.15 BLC INTERNATIONAL, INC.
*Details on Business Overview, Products/Solutions/Services Offered, Recent Developments, and MnM View (Key strengths/Right to Win, Strategic Choices Made, and Weaknesses and Competitive Threats) might not be captured in case of unlisted companies.  
 
12 APPENDIX (Page No. - 232)
     12.1 INSIGHTS FROM INDUSTRY EXPERTS 
     12.2 DISCUSSION GUIDE 
     12.3 KNOWLEDGESTORE: MARKETSANDMARKETS’ SUBSCRIPTION PORTAL 
     12.4 CUSTOMIZATION OPTIONS 
     12.5 RELATED REPORTS 
     12.6 AUTHOR DETAILS 


The study involved four major activities in estimating the arc-based plasma lighting market size. Exhaustive secondary research has been carried out to collect information on the market, the peer markets, and the parent market. Both top-down and bottom-up approaches have been employed to estimate the total market size. Market breakdown and data triangulation methods have also been used to estimate the market for segments and subsegments.

Secondary Research

In the secondary research process, various secondary sources have been referred to for identifying and collecting information relevant to this study on the arc-based plasma lighting market. The secondary sources included the Global Lighting Association, American Lighting Association (ALA), Illuminating Engineering Society (IES), The International Commission on Illumination (CIE), National Electrical Manufacturers Association (NEMA), annual reports, press releases, and investor presentations of companies; white papers, certified publications, and articles by recognized authors; directories; and databases.

The global size of the arc-based plasma lighting market has been obtained from the secondary data available through paid and unpaid sources. It has also been determined by analyzing the product portfolios of the leading companies and rating them based on the quality of their offerings.

Secondary research has been used to gather key information about the industry's supply chain, the market’s monetary chain, the total number of key players, and market segmentation according to the industry trends to the bottom-most level, geographic markets, and key developments from both the market- and technology-oriented perspectives. It has also been conducted to identify and analyze the industry trends and key developments undertaken from both the market- and technology perspectives.

Primary Research

In the primary research process, various primary sources have been interviewed to obtain qualitative and quantitative information about the market across four main regions-Asia Pacific, North America, Europe, and the Rest of the World (the Middle East & Africa, and South America). Primary sources from the supply side include industry experts such as CEOs, vice presidents, marketing directors, technology directors, and other related key executives from major companies and organizations operating in the arc-based plasma lighting market or related markets.

After completing market engineering, primary research was conducted to gather information and verify and validate critical numbers from other sources. Primary research has also been conducted to identify various market segments; industry trends; key players; competitive landscape; and key market dynamics, such as drivers, restraints, opportunities, and challenges, along with key strategies adopted by market players. Most primary interviews have been conducted with the market's supply side. This primary data has been collected through questionnaires, emails, and telephonic interviews.
The breakdown of primary respondents is as follows:

Arc-based Plasma Lighting Market
 Size, and Share

To know about the assumptions considered for the study, download the pdf brochure

Market Size Estimation

In the complete engineering process, both top-down and bottom-up approaches and several data triangulation methods have been used to estimate and validate the size of the overall arc-based plasma lighting market and other dependent submarkets. Key players in the market have been identified through secondary research, and their market positions in the respective geographies have been determined through both primary and secondary research. This entire procedure includes studying top market players’ annual and financial reports and extensive interviews with industry leaders such as CEOs, VPs, directors, and marketing executives for key insights (qualitative and quantitative).

All percentage shares and breakdowns have been determined using secondary sources and verified through primary sources. All the possible parameters that affect the markets covered in this research study have been accounted for, viewed in detail, verified through primary research, and analyzed to obtain the final quantitative and qualitative data. This data has been consolidated and supplemented with detailed inputs and analysis from MarketsandMarkets and presented in this report.

Global Arc-based plasma lighting Market Size: Bottom-Up Approach

Arc-based Plasma Lighting Market
 Size, and Bottom-Up Approach

Global Arc-based plasma lighting Market Size: Top-Down Approach

Arc-based Plasma Lighting Market
 Size, and Top-Down Approach

Data Triangulation

After arriving at the overall market size from the estimation process explained above, the overall market has been split into several segments and subsegments. To complete the overall market engineering process and arrive at the exact statistics for all segments and subsegments, the market breakdown and data triangulation procedures have been employed, wherever applicable. Data has been triangulated by studying various factors and trends from both the demand and supply sides. Along with this, the market size has been validated using top-down and bottom-up approaches.

Market Definition

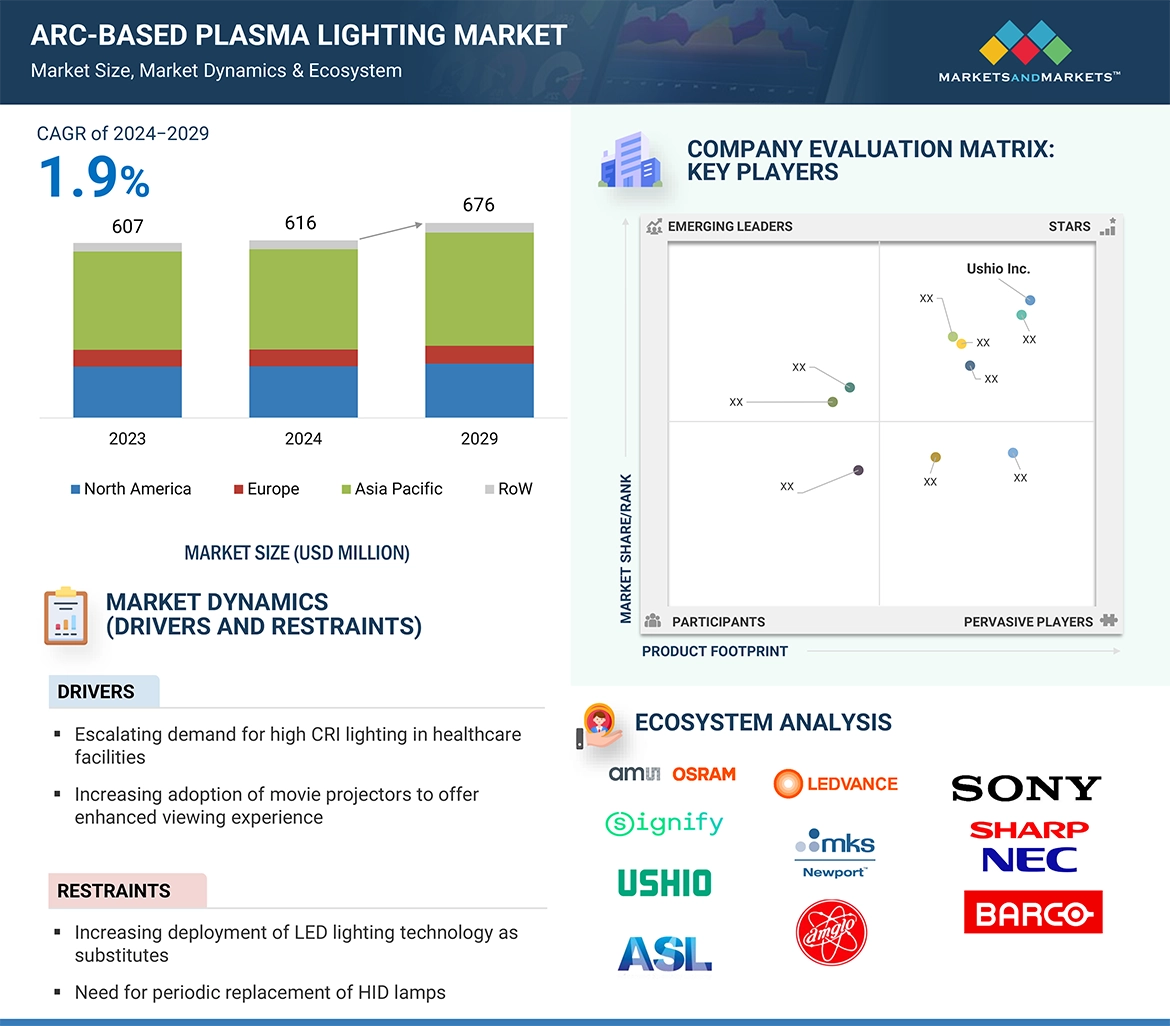
Arc-based plasma lighting is a lighting technology that operates by creating a high-intensity electric arc within a sealed quartz bulb or other transparent enclosure filled with a noble gas or a mixture of gases. This arc generates a plasma, which is a highly ionized gas consisting of charged particles such as ions and free electrons. The plasma emits light across a broad spectrum, ranging from ultraviolet (UV) to visible and infrared (IR) wavelengths, depending on the specific gas mixture and operating conditions. The arc is typically initiated and maintained by an electrical discharge between two electrodes, which may be made of tungsten, molybdenum, or other refractory materials. As the arc current passes through the gas, it ionizes the gas molecules, causing them to emit photons of light. This process produces an intense and uniform illumination characterized by high brightness and excellent color rendering properties.

Key Stakeholders

  • Raw material suppliers
  • Research organizations
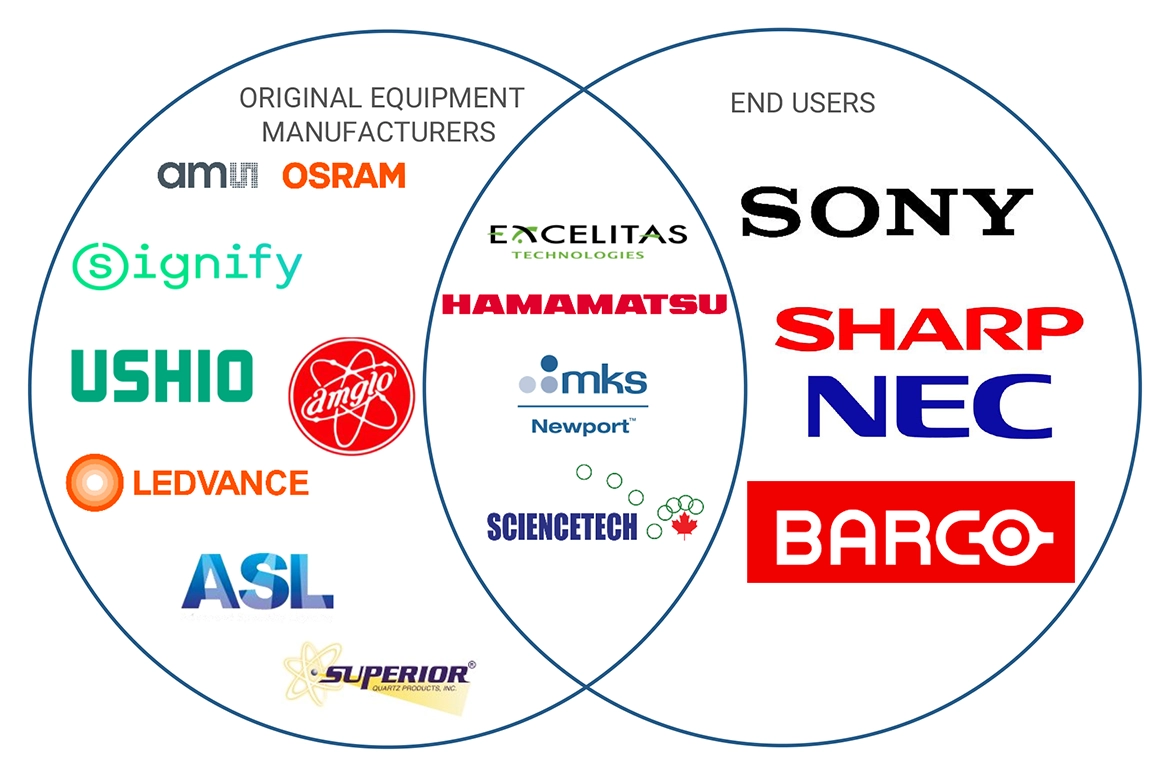
  • Original equipment manufacturers (OEMs)
  • Technology investors
  • Analysts and strategic business planners
  • Government bodies, venture capitalists, and private equity firms
  • End users

Report Objectives

  • To define and forecast the arc-based plasma lighting market based on light source, wattage type, and application, in terms of value
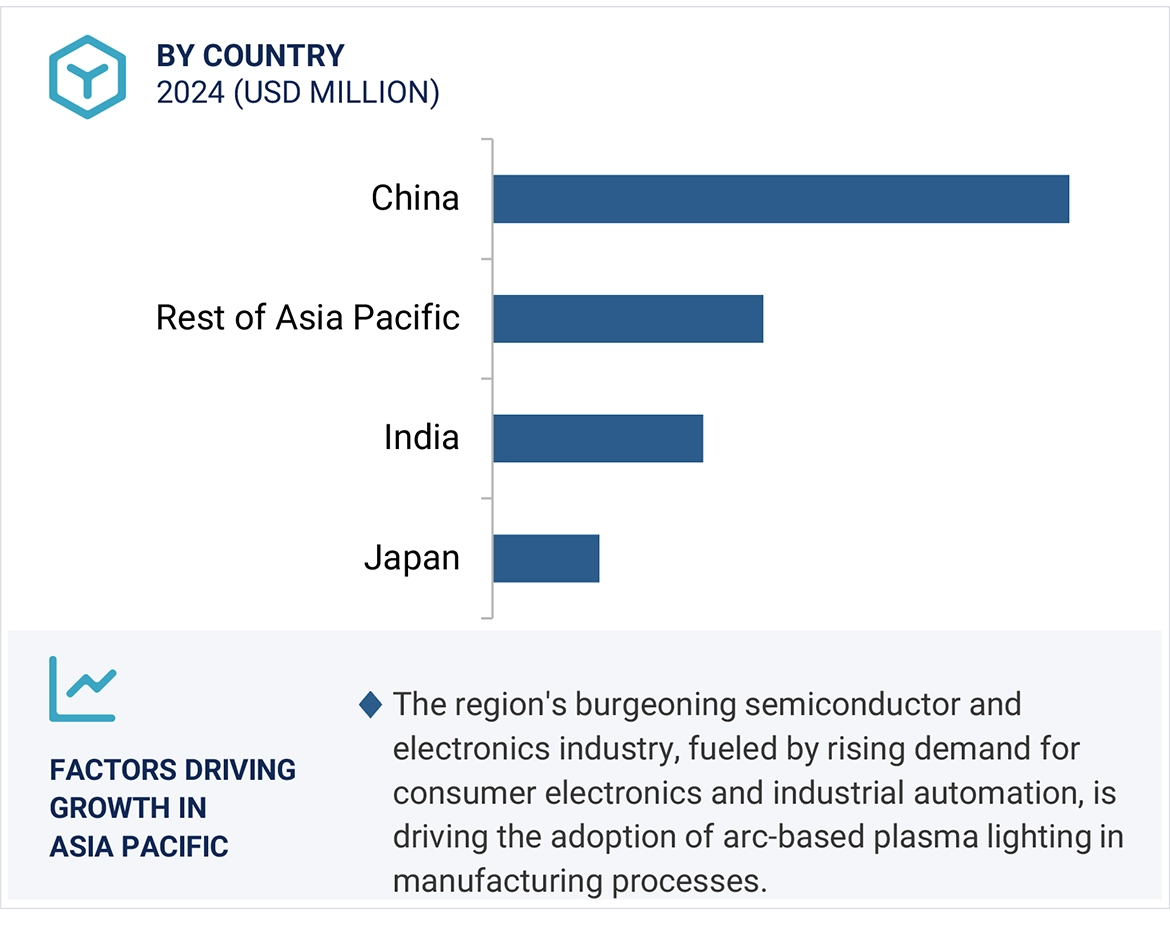
  • To forecast the market size of various segments with respect to four main regions: North America, Europe, Asia Pacific, and the Rest of the World (RoW), in terms of value
  • To provide detailed information regarding the drivers, restraints, opportunities, and challenges influencing the market growth
  • To understand and analyze the impact of evolving technologies on the arc-based plasma lighting value chain and upcoming trends in the ecosystem
  • To highlight the impact of Porter’s five forces on the arc-based plasma lighting ecosystem and analyze the underlying market opportunities
  • To analyze the associated use cases in the arc-based plasma lighting business and their impact on the business strategies adopted by key players
  • To provide key industry trends and associated important regulations impacting the global arc-based plasma lighting market
  • To strategically analyze micromarkets with respect to individual growth trends, prospects, and contributions to the total market
  • To strategically profile key players and comprehensively analyze their market share and core competencies, along with detailing the competitive landscape for market leaders
  • To analyze competitive developments such as agreements, partnerships, acquisitions, and product launches in the arc-based plasma lighting market

Available customizations:

With the given market data, MarketsandMarkets offers customizations according to the specific requirements of companies. The following customization options are available for the report:

  • Detailed analysis and profiling of additional market players (up to 5 players) based on various blocks of the supply chain
Custom Market Research Services

We will customize the research for you, in case the report listed above does not meet with your exact requirements. Our custom research will comprehensively cover the business information you require to help you arrive at strategic and profitable business decisions.

Request Customization
Report Code
SE 8987
Published ON
Apr, 2024
Choose License Type
BUY NOW
  • SHARE
X
Request Customization
Speak to Analyst
Speak to Analyst
OR FACE-TO-FACE MEETING
PERSONALIZE THIS RESEARCH
  • Triangulate with your Own Data
  • Get Data as per your Format and Definition
  • Gain a Deeper Dive on a Specific Application, Geography, Customer or Competitor
  • Any level of Personalization
REQUEST A FREE CUSTOMIZATION
LET US HELP YOU!
  • What are the Known and Unknown Adjacencies Impacting the Arc-based Plasma Lighting Market
  • What will your New Revenue Sources be?
  • Who will be your Top Customer; what will make them switch?
  • Defend your Market Share or Win Competitors
  • Get a Scorecard for Target Partners
CUSTOMIZED WORKSHOP REQUEST
+1-888-600-6441
  • Call Us
  • +1-888-600-6441 (Corporate office hours)
  • +1-888-600-6441 (US/Can toll free)
  • +44-800-368-9399 (UK office hours)
CONNECT WITH US
ABOUT TRUST ONLINE
©2024 MarketsandMarkets Research Private Ltd. All rights reserved
DMCA.com Protection Status Website Feedback