Artificial Intelligence (AI) Supercomputer Market

Artificial Intelligence (AI) Supercomputer Market Size, Share, Industry Growth, Trends & Analysis by Components (Processors/Compute, Storage, Memory, Interconnects), Deployment (Cloud, On-Premises), Application (Government, Academia and Research, Commercial) and Geography – Global Forecast to 2028

Report Code: SE 8831 Oct, 2023, by marketsandmarkets.com

The AI supercomputer market Size, Share, Industry Growth, Trends & Analysis is projected to grow from USD 1.2 billion in 2023 and is expected to reach USD 3.3 billion by 2028, growing at a CAGR of 22.0% from 2023 to 2028. The application of AI supercomputers in the healthcare sector has witnessed significant growth in recent years. These powerful computing systems are being leveraged to address complex challenges, enhance medical research, and streamline healthcare operations. AI supercomputers helps accelerate drug discovery by simulating molecular interactions, predicting potential drug candidates, and simulating the behavior of compounds. This aids in precision medicine and enhances diagnostic capabilities.

Artificial Intelligence (AI) Supercomputer Market

Artificial Intelligence (AI) Supercomputer Market

Artificial Intelligence (AI) Supercomputer Market Forecast to 2028

To know about the assumptions considered for the study, Request for Free Sample Report

AI supercomputers market Dynamics

Drivers: Increased application of AI supercomputers in healthcare industry

The application of AI supercomputers in the healthcare industry has witnessed significant growth in recent years. These powerful computing systems are being leveraged to address complex challenges, enhance medical research, improve patient care, and streamline healthcare operations. AI supercomputers accelerate drug discovery by simulating molecular interactions, predicting potential drug candidates, and simulating the behavior of compounds. They analyze massive datasets to identify targets for disease treatment and to optimize drug designs, ultimately expediting the drug development process. Moreover, AI supercomputers also enable the analysis of vast genomic datasets, helping researchers identify genetic markers for diseases, understand genetic variations, and personalize treatment plans. This aids in precision medicine and enhances diagnostic capabilities.

Restraint: High acquisition and maintenance costs

The high acquisition and maintenance costs associated with AI supercomputers can indeed act as a significant restraint for many organizations. Purchasing or building an AI supercomputer requires a substantial upfront capital investment. The cost includes the hardware and specialized cooling systems, power infrastructure, and dedicated data center facilities. AI supercomputers rely on specialized hardware components like high-end GPUs, TPUs, or FPGAs, which are costly. Additionally, as technology evolves, hardware may need to be upgraded or replaced to keep up with the demands of newer AI models.

Opportunity: Contribution of AI in development and deployment of autonomous vehicles

AI supercomputers play a crucial role in developing and deploying autonomous vehicles (AVs). These high-performance computing systems provide the computational power required to process sensor data, make real-time decisions, and ensure the safety and efficiency of AV (Autonomous vehicles) operations. For example, Tesla uses AI in its Autopilot and Full Self-Driving systems. These systems use a combination of cameras, radar, and lidar to create a model of the vehicle's surroundings and make decisions about how to navigate.

AI supercomputers are at the core of the AV ecosystem, facilitating the development, testing, and deployment of autonomous vehicles. Their computational power, parallel processing capabilities, and ability to handle complex AI algorithms are essential for ensuring autonomous transportation systems' safety, reliability, and efficiency.

Challenge: Long development and delployment cycles

Long development and deployment cycles are challenging for the AI supercomputer market. Building and configuring AI supercomputers can be a time-consuming process. Long development and deployment cycles may delay organizations' ability to capitalize on AI opportunities.

Longer development cycles often lead to higher development costs, as organizations must allocate resources to maintain and upgrade existing infrastructure while waiting for new systems to be deployed. Eventually, organizations spend more time on maintenance and development and less on AI research and application development, which affects the market position of the organization in the competitive market of AI.

AI Infrastructure Map/Ecosystem:

Artificial Intelligence (AI) Supercomputer Market by Ecosystem

Market for Processors/compute is expected to have largest market share during the forecast period.

Prcessors with faster and higher compute power provides the ability to AI supercomputers to handle larger and complex models and aids in reducing the time it takes to train and run AI models. AI supercomputers with high computational power processors are used for a wider range of applications. This includes applications that require large and complex AI models, such as drug discovery, climate change research, and financial modelling.

Market for Government segment in the AI supercomputer to have largest market size during the forecast period

The Government segment in the AI supercomputer market for application is expected to hold the largest market size during the forecast period in the AI supercomputer market. AI supercomputers can be used to detect fraud in a variety of areas, such as tax evasion, insurance fraud, and welfare fraud. For example, the US Internal Revenue Service (IRS) is using AI supercomputers to detect tax evasion. Moreover, AI supercomputers are also being used to coordinate disaster relief efforts and provide assistance to victims of disasters. For example, the US Federal Emergency Management Agency (FEMA) is using AI supercomputers to coordinate disaster relief efforts during hurricanes and other natural disasters. In this sector, AI supercomputers are being used for various applications, including disaster management, oil exploration, space, and energy research, and enhancing healthcare facilities.

Commercial application segment is expected to hold the highest growth rate in the AI supercomputer market during the forecast period

Commercial enterprises are increasingly utilizing AI supercomputers for various applications, leveraging their immense computational power and advanced algorithms to gain competitive advantages and drive innovation. AI supercomputers process vast datasets in real time, providing valuable insights into customer behavior, market trends, and operational efficiency. This data-driven approach enhances decision-making processes for businesses.

AI supercomputer market in the Asia Pacific estimated to grow at the fastest rate during the forecast period.

The AI supercomputer market in the Asia Pacific has been studied for China, Japan, India, and the Rest of Asia Pacific. Asia Pacific is expected to hold the largest market share of the AI supercomputer market during the forecast period. The growth of the AI supercomputer market in this region is primarily attributed to the development and deployment of AI supercomputers for government and academia and research. Countries like China, Japan, and India have become global innovation hubs, fostering cutting-edge research and development in AI technologies, including AI supercomputing such as AIRAWAT and Tianhe-3A. Moreover, the Smart City Development initiative in Japan would also be a major driver for the country's growth of the AI supercomputer market.

Artificial Intelligence (AI) Supercomputer Market by Region

Artificial Intelligence (AI) Supercomputer Market by Region

To know about the assumptions considered for the study, download the pdf brochure

Key Market Players

Major vendors in the AI supercomputer companis include NIVIDIA Corporation (US), Intel Corporation (US), Advanced Micro Devices, Inc. (US), Samsung Electronics (South Korea), Micron Technology, Inc. (US), IBM Corporation (US), Meta (US) Google (US), Dell Inc. (US), Microsoft (US), Huawei Technologies Co., Ltd. (China) Cerebras (US).

Get online access to the report on the World's First Market Intelligence Cloud

  • Easy to Download Historical Data & Forecast Numbers
  • Company Analysis Dashboard for high growth potential opportunities
  • Research Analyst Access for customization & queries
  • Competitor Analysis with Interactive dashboard
  • Latest News, Updates & Trend analysis
Request Sample

Scope of the Report

Report Metric

Details

Market size available for years

2019—2028

Base year

2022

Forecast period

2023—2028

Forecast Units

USD Million/USD Billion

Segments Covered

Component, Application, and Region

Geographic regions covered

North America, Europe, Asia Pacific, and RoW

Companies covered

NVIDIA Corporation (US), Intel corporation (US), Advanced Micro Devices, Inc. (US), Samsung Electronics (South Korea), Micron Technology, Inc. (US), IBM Corporation (US), Meta (US) Google (US), Dell Inc. (US), Microsoft (US), Huawei Technologies Co., Ltd. (China) Cerebras (US), Hewlett Packard Enterprise Development LP (US), Fujitsu (Japan), Pezy Group (Netherlands), Tesla (US), Atos SE (France), NEC Corporation (Japan), Oracle (US), Amazon Web Services, Inc. (US), Groq, Inc. (US), MediaTek Inc. (Taiwan), Graphcore (UK), SambaNova Systems Inc. (US), Kalray (France), Kneron Inc. (US), Arm Ltd.(UK) .

Artificial Intelligence (AI) Supercomputer Market Highlights

This research report categorizes the AI supercomputer market based on component, application and region.

Segment

Subsegment

By Component

  • Processors /Computer
    • CPU
    • GPU
    • ASIC
    • FPGA
  • Storage
  • Memory
  • Interconnects

By Application

  • Government
  • Academia and Research
  • Commercial
    • Generative AI
    • Computer Vision
    • Drug Discovery
    • Others

By Region:

  • North America
    • US
    • Canada
  • Europe
    • UK
    • Germany
    • France
    • Rest of Europe
  • Asia Pacific
    • China
    • Japan
    • India
    • Rest of Asia Pacific
  • Rest of the world
    • Middle East and Africa
    • South America

Recent Developments

  • In july 2023 , Cerebras (US) announced the launch of Condor Galaxy 1, which is one of the largest AI supercomputers. It consists of a network of nine interconnected supercomputers with a lesser AI model training time significantly, with a total capacity of 36 exaflops.
  • In May 2023, NVIDIA Corporation (US) announced a new class of large-memory AI supercomputer, the NVIDIA DGX GH200. Its massive shared memory space uses NVLink interconnect technology with the NVLink Switch System to combine 256 GH200 Superchips, allowing them to perform as a single GPU.

Critical questions answered by this report :

To speak to our analyst for a discussion on the above findings, click Speak to Analyst

183
 
TABLE OF CONTENTS
 
1 INTRODUCTION (Page No. - 24)
    1.1 STUDY OBJECTIVES 
    1.2 MARKET DEFINITION 
           1.2.1 INCLUSIONS AND EXCLUSIONS
    1.3 STUDY SCOPE 
           1.3.1 MARKETS COVERED
                    FIGURE 1 AI SUPERCOMPUTER MARKET: SEGMENTATION
           1.3.2 REGIONAL SCOPE
           1.3.3 YEARS CONSIDERED
    1.4 CURRENCY CONSIDERED 
           1.4.1 USD EXCHANGE RATES
    1.5 UNITS CONSIDERED 
    1.6 LIMITATIONS 
    1.7 STAKEHOLDERS 
    1.8 IMPACT OF RECESSION 
 
2 RESEARCH METHODOLOGY (Page No. - 28)
    2.1 RESEARCH APPROACH 
           FIGURE 2 AI SUPERCOMPUTER MARKET: RESEARCH DESIGN
           2.1.1 SECONDARY AND PRIMARY RESEARCH
                   FIGURE 3 AI SUPERCOMPUTER MARKET: RESEARCH APPROACH
           2.1.2 SECONDARY DATA
                    2.1.2.1 Key data from secondary sources
                    2.1.2.2 List of major secondary sources
           2.1.3 PRIMARY DATA
                    2.1.3.1 Primary interviews with experts
                    2.1.3.2 Key data from primary sources
                    2.1.3.3 Key industry insights
                    2.1.3.4 List of key primary respondents
                    2.1.3.5 Breakdown of primaries
    2.2 MARKET SIZE ESTIMATION 
           FIGURE 4 MARKET SIZE ESTIMATION METHODOLOGY: SUPPLY SIDE
           2.2.1 BOTTOM-UP APPROACH
                    2.2.1.1 Approach to derive market size using bottom-up analysis (demand side)
                               FIGURE 5 AI SUPERCOMPUTER MARKET: BOTTOM-UP APPROACH
           2.2.2 TOP-DOWN APPROACH
                    2.2.2.1 Approach to derive market size using top-down analysis (supply side)
                               FIGURE 6 AI SUPERCOMPUTER MARKET: TOP-DOWN APPROACH
    2.3 MARKET BREAKDOWN AND DATA TRIANGULATION 
           FIGURE 7 DATA TRIANGULATION
    2.4 RESEARCH ASSUMPTIONS 
    2.5 PARAMETERS CONSIDERED TO ANALYZE IMPACT OF RECESSION ON AI SUPERCOMPUTER MARKET 
    2.6 RISK ASSESSMENT 
 
3 EXECUTIVE SUMMARY (Page No. - 39)
    FIGURE 8 MEMORY SEGMENT TO EXHIBIT HIGHEST CAGR DURING FORECAST PERIOD
    FIGURE 9 GOVERNMENT SEGMENT TO SECURE LARGEST MARKET SHARE DURING FORECAST PERIOD
    FIGURE 10 AI SUPERCOMPUTER MARKET, BY REGION, 2022
 
4 PREMIUM INSIGHTS (Page No. - 42)
    4.1 ATTRACTIVE OPPORTUNITIES FOR PLAYERS IN AI SUPERCOMPUTER MARKET 
           FIGURE 11 INCREASING APPLICATIONS OF AI SUPERCOMPUTERS IN HEALTHCARE SECTOR TO BOOST MARKET GROWTH
    4.2 AI SUPERCOMPUTER MARKET, BY COMPONENT 
           FIGURE 12 MEMORY SEGMENT TO REGISTER HIGHEST CAGR FROM 2023 TO 2028
    4.3 AI SUPERCOMPUTER MARKET, BY APPLICATION 
           FIGURE 13 GOVERNMENT SEGMENT TO HOLD LARGEST MARKET SHARE FROM 2023 TO 2028
    4.4 AI SUPERCOMPUTER MARKET IN ASIA PACIFIC, BY APPLICATION AND COUNTRY 
           FIGURE 14 GOVERNMENT AND CHINA HELD LARGEST MARKET SHARES IN 2022
    4.5 AI SUPERCOMPUTER MARKET, BY COUNTRY 
           FIGURE 15 INDIA TO EXHIBIT HIGHEST CAGR DURING FORECAST PERIOD
 
5 MARKET OVERVIEW (Page No. - 45)
    5.1 INTRODUCTION 
    5.2 MARKET DYNAMICS 
           FIGURE 16 AI SUPERCOMPUTER MARKET: DRIVERS, RESTRAINTS, OPPORTUNITIES, AND CHALLENGES
           5.2.1 DRIVERS
                    FIGURE 17 AI SUPERCOMPUTER MARKET: IMPACT ANALYSIS OF DRIVERS
                    5.2.1.1 Increased application of AI supercomputers in healthcare industry
                    5.2.1.2 Development of complex AI models
                    5.2.1.3 High computational power of AI supercomputers
                    5.2.1.4 Usage of AI supercomputers in financial institutions
           5.2.2 RESTRAINTS
                    FIGURE 18 AI SUPERCOMPUTER MARKET: IMPACT ANALYSIS OF RESTRAINTS
                    5.2.2.1 High acquisition and maintenance costs
                    5.2.2.2 Lack of AI hardware experts and skilled workforce
           5.2.3 OPPORTUNITIES
                    FIGURE 19 AI SUPERCOMPUTER MARKET: IMPACT ANALYSIS OF OPPORTUNITIES
                    5.2.3.1 Contribution of AI to development and deployment of autonomous vehicles
                    5.2.3.2 Adoption of cloud-based AI services by several organizations and researchers
           5.2.4 CHALLENGES
                    FIGURE 20 AI SUPERCOMPUTER MARKET: IMPACT ANALYSIS OF CHALLENGES
                    5.2.4.1 Long development and deployment cycles
                    5.2.4.2 Complexities associated with hardware and software integration
    5.3 VALUE CHAIN ANALYSIS 
           FIGURE 21 AI INFRASTRUCTURE MARKET: VALUE CHAIN ANALYSIS
    5.4 TRENDS/DISRUPTIONS IMPACTING CUSTOMERS’ BUSINESSES 
           FIGURE 22 TRENDS/DISRUPTIONS IMPACTING CUSTOMERS’ BUSINESSES
    5.5 ECOSYSTEM MAPPING 
           FIGURE 23 AI SUPERCOMPUTER MARKET: ECOSYSTEM MAPPING
           TABLE 1 COMPANIES AND THEIR ROLE IN AI SUPERCOMPUTER ECOSYSTEM
    5.6 PORTER’S FIVE FORCES ANALYSIS 
           TABLE 2 AI SUPERCOMPUTER MARKET: PORTER’S FIVE FORCES ANALYSIS
           FIGURE 24 AI SUPERCOMPUTER MARKET: PORTER’S FIVE FORCES ANALYSIS
           5.6.1 THREAT OF NEW ENTRANTS
           5.6.2 THREAT OF SUBSTITUTES
           5.6.3 BARGAINING POWER OF SUPPLIERS
           5.6.4 BARGAINING POWER OF BUYERS
           5.6.5 INTENSITY OF COMPETITIVE RIVALRY
    5.7 KEY STAKEHOLDERS AND BUYING CRITERIA 
           5.7.1 KEY STAKEHOLDERS IN BUYING PROCESS
                    FIGURE 25 KEY STAKEHOLDERS IN BUYING PROCESS FOR TOP THREE APPLICATIONS
                    TABLE 3 INFLUENCE OF STAKEHOLDERS ON BUYING PROCESS FOR TOP THREE APPLICATIONS
           5.7.2 BUYING CRITERIA
                    FIGURE 26 KEY BUYING CRITERIA FOR TOP THREE APPLICATIONS
                    TABLE 4 KEY BUYING CRITERIA FOR TOP THREE APPLICATIONS
    5.8 CASE STUDY ANALYSIS 
           5.8.1 MEMORIAL SLOAN-KETTERING CANCER CENTER DEPLOYS IBM WATSON’S “COGNITIVE COMPUTING” TO SORT MEDICAL DATA
           5.8.2 BRADESCO (BRAZILIAN BANK) DEPLOYS IBM’S AI-ENABLED COMPUTER SYSTEM TO UNDERSTAND WRITTEN AND SPOKEN QUESTIONS
           5.8.3 EXOR INTERNATIONAL COLLABORATES WITH INTEL, TELECOM ITALIA (TIM), AND JMA WIRELESS TO BUILD SMART FACTORY
    5.9 TECHNOLOGY ANALYSIS 
           5.9.1 KEY TECHNOLOGIES
                    5.9.1.1 Green computing
                    5.9.1.2 Cloud GPUs
    5.10 TRADE ANALYSIS 
           5.10.1 IMPORT SCENARIO
                    FIGURE 27 IMPORT DATA FOR PRODUCTS UNDER HS CODE 854231, BY COUNTRY, 2018–2022 (USD MILLION)
                    TABLE 5 IMPORT DATA, BY COUNTRY, 2018–2022 (USD MILLION)
           5.10.2 EXPORT SCENARIO
                    FIGURE 28 EXPORT DATA FOR PRODUCTS UNDER HS CODE 854231, BY COUNTRY, 2018–2022 (USD MILLION)
                    TABLE 6 EXPORT DATA, BY COUNTRY, 2018–2022 (USD MILLION)
    5.11 TARIFF ANALYSIS 
           TABLE 7 TARIFF FOR HS CODE 854231-COMPLIANT PRODUCTS EXPORTED BY CHINA
           TABLE 8 TARIFF FOR HS CODE 854231-COMPLIANT PRODUCTS EXPORTED BY GERMANY
           TABLE 9 TARIFF FOR HS CODE 854231-COMPLIANT PRODUCTS EXPORTED BY FRANCE
    5.12 PATENT ANALYSIS 
           TABLE 10 AI SUPERCOMPUTER MARKET: LIST OF PATENTS, 2020–2023
           FIGURE 29 NUMBER OF PATENTS GRANTED PER YEAR, 2012–2022
           TABLE 11 TOP 20 PATENT OWNERS IN US IN LAST 10 YEARS
           FIGURE 30 TOP 10 COMPANIES WITH HIGHEST NUMBER OF PATENT APPLICATIONS IN LAST 10 YEARS
    5.13 REGULATORY LANDSCAPE AND STANDARDS 
           5.13.1 REGULATORY BODIES, GOVERNMENT AGENCIES, AND OTHER ORGANIZATIONS
                    TABLE 12 NORTH AMERICA: LIST OF REGULATORY BODIES, GOVERNMENT AGENCIES, AND OTHER ORGANIZATIONS
                    TABLE 13 EUROPE: LIST OF REGULATORY BODIES, GOVERNMENT AGENCIES, AND OTHER ORGANIZATIONS
                    TABLE 14 ASIA PACIFIC: LIST OF REGULATORY BODIES, GOVERNMENT AGENCIES, AND OTHER ORGANIZATIONS
                    TABLE 15 ROW: LIST OF REGULATORY BODIES, GOVERNMENT AGENCIES, AND OTHER ORGANIZATIONS
           5.13.2 STANDARDS
    5.14 KEY CONFERENCES AND EVENTS, 2023–2024 
           TABLE 16 AI SUPERCOMPUTER MARKET: LIST OF CONFERENCES AND EVENTS
    5.15 PRICING ANALYSIS 
           TABLE 17 AVERAGE SELLING PRICE (ASP) OF PROCESSORS/COMPUTE FOR AI SUPERCOMPUTERS OFFERED BY TWO KEY PLAYERS
           5.15.1 AVERAGE SELLING PRICE (ASP) OF PROCESSORS/COMPUTE OFFERED BY TWO KEY PLAYERS
                    FIGURE 31 AVERAGE SELLING PRICE (ASP) OF PROCESSORS/COMPUTE OFFERED BY TWO KEY PLAYERS
           5.15.2 AVERAGE SELLING PRICE (ASP) TREND, BY COMPONENT
                    FIGURE 32 AVERAGE SELLING PRICE (ASP) OF CPUS & GPUS
 
6 AI SUPERCOMPUTER MARKET, BY COMPONENT (Page No. - 75)
    6.1 INTRODUCTION 
           FIGURE 33 MEMORY SEGMENT TO EXHIBIT HIGHEST CAGR DURING FORECAST PERIOD
           TABLE 18 AI SUPERCOMPUTER MARKET, BY COMPONENT, 2019–2022 (USD MILLION)
           TABLE 19 AI SUPERCOMPUTER MARKET, BY COMPONENT, 2023–2028 (USD MILLION)
    6.2 PROCESSORS/COMPUTE 
           TABLE 20 PROCESSORS/COMPUTE: AI SUPERCOMPUTER MARKET, BY TYPE, 2019–2022 (USD MILLION)
           TABLE 21 PROCESSORS/COMPUTE: AI SUPERCOMPUTER MARKET, BY TYPE, 2023–2028 (USD MILLION)
           TABLE 22 PROCESSORS/COMPUTE: AI SUPERCOMPUTER MARKET, BY REGION, 2019–2022 (USD MILLION)
           TABLE 23 PROCESSORS/COMPUTE: AI SUPERCOMPUTER MARKET, BY REGION, 2023–2028 (USD MILLION)
           6.2.1 CENTRAL PROCESSING UNITS (CPUS)
                    6.2.1.1 Growing demand for realistic and immersive gaming experiences to foster segmental growth
           6.2.2 GRAPHICS PROCESSING UNITS (GPUS)
                    6.2.2.1 Ability to process multiple layers and millions of parameters in parallel to drive market
                               TABLE 24 COMPONENT: AI SUPERCOMPUTER MARKET FOR CPUS & GPUS, 2019–2022 (THOUSAND UNITS)
                               TABLE 25 COMPONENT: AI SUPERCOMPUTER MARKET FOR CPUS & GPUS, 2023–2028 (THOUSAND UNITS)
           6.2.3 APPLICATION-SPECIFIC INTEGRATED CIRCUITS (ASICS)
                    6.2.3.1 Ability to enhance to overall performance and competitiveness of AI supercomputing systems to foster segmental growth
           6.2.4 FIELD-PROGRAMMABLE GATE ARRAYS (FPGAS)
                    6.2.4.1 Potential to quickly test new and updated algorithms to boost demand
    6.3 STORAGE 
           6.3.1 EFFICIENT MANAGEMENT AND HANDLING OF VAST AMOUNT OF DATA TO DRIVE MARKET
                    FIGURE 34 ASIA PACIFIC TO HOLD LARGEST SHARE OF AI SUPERCOMPUTER MARKET FOR STORAGE IN 2028
                    TABLE 26 STORAGE: AI SUPERCOMPUTER MARKET, BY REGION, 2019–2022 (USD MILLION)
                    TABLE 27 STORAGE: AI SUPERCOMPUTER MARKET, BY REGION, 2023–2028 (USD MILLION)
    6.4 MEMORY 
           6.4.1 NEED TO OPTIMIZE DATA TRANSFER BETWEEN CPU AND GPU MEMORY TO DRIVE MARKET
                    TABLE 28 MEMORY: AI SUPERCOMPUTER MARKET, BY REGION, 2019–2022 (USD MILLION)
                    TABLE 29 MEMORY: AI SUPERCOMPUTER MARKET, BY REGION, 2023–2028 (USD MILLION)
    6.5 INTERCONNECTS 
           6.5.1 ABILITY TO SEAMLESSLY COMMUNICATE AND SHARE DATA BETWEEN HETEROGENEOUS COMPUTING RESOURCES TO BOOST DEMAND
                    TABLE 30 INTERCONNECTS: AI SUPERCOMPUTER MARKET, BY REGION, 2019–2022 (USD MILLION)
                    TABLE 31 INTERCONNECTS: AI SUPERCOMPUTER MARKET, BY REGION, 2023–2028 (USD MILLION)
 
7 DEPLOYMENT TYPE OF AI SUPERCOMPUTERS IN ORGANIZATIONS (Page No. - 85)
    7.1 INTRODUCTION 
    7.2 CLOUD 
           7.2.1 REDUCED OPERATIONAL COSTS, EASY DEPLOYMENT, AND HIGH SCALABILITY TO DRIVE DEMAND
    7.3 ON-PREMISES 
           7.3.1 CUSTOM DESIGN AND CONFIGURATION WITH SPECIFIC COMPUTATIONAL REQUIREMENTS OF AI WORKLOADS TO DRIVE DEMAND
 
8 AI SUPERCOMPUTER MARKET, BY APPLICATION (Page No. - 86)
    8.1 INTRODUCTION 
           FIGURE 35 COMMERCIAL APPLICATION TO EXHIBIT HIGHEST CAGR DURING FORECAST PERIOD
           TABLE 32 APPLICATION: AI SUPERCOMPUTER MARKET, 2019–2022 (USD MILLION)
           TABLE 33 APPLICATION: AI SUPERCOMPUTER MARKET, 2023–2028 (USD MILLION)
    8.2 GOVERNMENT 
           8.2.1 RISING CYBERSECURITY THREATS TO DRIVE MARKET
                    TABLE 34 GOVERNMENT: AI SUPERCOMPUTER MARKET, BY REGION, 2019–2022 (USD MILLION)
                    TABLE 35 GOVERNMENT: AI SUPERCOMPUTER MARKET, BY REGION, 2023–2028 (USD MILLION)
    8.3 ACADEMIA AND RESEARCH 
           8.3.1 GROWING NEED TO RESOLVE COMPLEX SCIENTIFIC PROBLEMS TO DRIVE MARKET
                    TABLE 36 ACADEMIA AND RESEARCH: AI SUPERCOMPUTER MARKET, BY REGION, 2019–2022 (USD MILLION)
                    TABLE 37 ACADEMIA AND RESEARCH: AI SUPERCOMPUTER MARKET, BY REGION, 2023–2028 (USD MILLION)
    8.4 COMMERCIAL 
           FIGURE 36 NORTH AMERICA TO HOLD LARGEST MARKET SHARE OF AI SUPERCOMPUTER FOR COMMERCIAL APPLICATION FROM IN 2028
           TABLE 38 COMMERCIAL: AI SUPERCOMPUTER MARKET, BY REGION, 2019–2022 (USD MILLION)
           TABLE 39 COMMERCIAL: AI SUPERCOMPUTER MARKET, BY REGION, 2023–2028 (USD MILLION)
           8.4.1 GENERATIVE AI
                    8.4.1.1 Ability to offer realistic images and videos in entertainment industry to boost demand
           8.4.2 COMPUTER VISION
                    8.4.2.1 Semiautonomous and autonomous cars to create lucrative opportunities for market players
           8.4.3 DRUG DISCOVERY
                    8.4.3.1 Ability to accelerate and optimize drug discovery to boost demand
           8.4.4 OTHERS
 
9 AI SUPERCOMPUTER MARKET, BY REGION (Page No. - 94)
    9.1 INTRODUCTION 
           FIGURE 37 ASIA PACIFIC TO ACCOUNT FOR HIGHEST CAGR DURING FORECAST PERIOD
           FIGURE 38 ASIA PACIFIC TO HOLD LARGEST MARKET SHARE IN 2028
           TABLE 40 AI SUPERCOMPUTER MARKET, BY REGION, 2019–2022 (USD MILLION)
           TABLE 41 AI SUPERCOMPUTER MARKET, BY REGION, 2023–2028 (USD MILLION)
    9.2 NORTH AMERICA 
           9.2.1 IMPACT OF RECESSION ON NORTH AMERICA
                    FIGURE 39 NORTH AMERICA: AI SUPERCOMPUTER MARKET SNAPSHOT
                    TABLE 42 NORTH AMERICA: AI SUPERCOMPUTER MARKET, BY COUNTRY, 2019–2022 (USD MILLION)
                    TABLE 43 NORTH AMERICA: AI SUPERCOMPUTER MARKET, BY COUNTRY, 2023–2028 (USD MILLION)
                    TABLE 44 NORTH AMERICA: AI SUPERCOMPUTER MARKET, BY COMPONENT, 2019–2022 (USD MILLION)
                    TABLE 45 NORTH AMERICA: AI SUPERCOMPUTER MARKET, BY COMPONENT, 2023–2028 (USD MILLION)
                    TABLE 46 NORTH AMERICA: AI SUPERCOMPUTER MARKET, BY APPLICATION, 2019–2022 (USD MILLION)
                    TABLE 47 NORTH AMERICA: AI SUPERCOMPUTER MARKET, BY APPLICATION, 2023–2028 (USD MILLION)
           9.2.2 US
                    9.2.2.1 Growing private sector investments in developing computing systems to drive market
           9.2.3 CANADA
                    9.2.3.1 Government-led funding for research and development of AI technologies and supercomputing to boost demand
    9.3 EUROPE 
           9.3.1 IMPACT OF RECESSION ON EUROPE
                    FIGURE 40 EUROPE: AI SUPERCOMPUTER MARKET SNAPSHOT
                    TABLE 48 EUROPE: AI SUPERCOMPUTER MARKET, BY COUNTRY, 2019–2022 (USD MILLION)
                    TABLE 49 EUROPE: AI SUPERCOMPUTER MARKET, BY COUNTRY, 2023–2028 (USD MILLION)
                    TABLE 50 EUROPE: AI SUPERCOMPUTER MARKET, BY COMPONENT, 2019–2022 (USD MILLION)
                    TABLE 51 EUROPE: AI SUPERCOMPUTER MARKET, BY COMPONENT, 2023–2028 (USD MILLION)
                    TABLE 52 EUROPE: AI SUPERCOMPUTER MARKET, BY APPLICATION, 2019–2022 (USD MILLION)
                    TABLE 53 EUROPE: AI SUPERCOMPUTER MARKET, BY APPLICATION, 2023–2028 (USD MILLION)
           9.3.2 UK
                    9.3.2.1 Government-led initiatives for increasing adoption of AI to drive market growth
           9.3.3 GERMANY
                    9.3.3.1 Introduction of Industry 4.0 technologies to boost market growth
           9.3.4 FRANCE
                    9.3.4.1 Growing government funding to startups to drive market
           9.3.5 REST OF EUROPE
    9.4 ASIA PACIFIC 
           9.4.1 IMPACT OF RECESSION ON ASIA PACIFIC
                    FIGURE 41 ASIA PACIFIC: AI SUPERCOMPUTER MARKET SNAPSHOT
                    TABLE 54 ASIA PACIFIC: AI SUPERCOMPUTER MARKET, BY COUNTRY, 2019–2022 (USD MILLION)
                    TABLE 55 ASIA PACIFIC: AI SUPERCOMPUTER MARKET, BY COUNTRY, 2023–2028 (USD MILLION)
                    TABLE 56 ASIA PACIFIC: AI SUPERCOMPUTER MARKET, BY COMPONENT, 2019–2022 (USD MILLION)
                    TABLE 57 ASIA PACIFIC: AI SUPERCOMPUTER MARKET, BY COMPONENT, 2023–2028 (USD MILLION)
                    TABLE 58 ASIA PACIFIC: AI SUPERCOMPUTER MARKET, BY APPLICATION, 2019–2022 (USD MILLION)
                    TABLE 59 ASIA PACIFIC: AI SUPERCOMPUTER MARKET, BY APPLICATION, 2023–2028 (USD MILLION)
           9.4.2 CHINA
                    9.4.2.1 Government-led investments in development AI technologies to drive market
           9.4.3 JAPAN
                    9.4.3.1 Growing deployment of robots in healthcare sector to drive demand
           9.4.4 INDIA
                    9.4.4.1 Growing investment in AI-specific supercomputers to drive market
           9.4.5 REST OF ASIA PACIFIC
    9.5 ROW 
           9.5.1 IMPACT OF RECESSION ON ROW
                    FIGURE 42 ROW: AI SUPERCOMPUTER MARKET SNAPSHOT
                    TABLE 60 ROW: AI SUPERCOMPUTER MARKET, BY COMPONENT, 2019–2022 (USD MILLION)
                    TABLE 61 ROW: AI SUPERCOMPUTER MARKET, BY COMPONENT, 2023–2028 (USD MILLION)
                    TABLE 62 ROW: AI SUPERCOMPUTER MARKET, BY APPLICATION, 2019–2022 (USD MILLION)
                    TABLE 63 ROW: AI SUPERCOMPUTER MARKET, BY APPLICATION, 2023–2028 (USD MILLION)
           9.5.2 MIDDLE EAST & AFRICA
                    9.5.2.1 Increasing R&D investments in AI technology to drive market
           9.5.3 SOUTH AMERICA
                    9.5.3.1 Increasing public–private partnerships to boost demand
 
10 COMPETITIVE LANDSCAPE (Page No. - 113)
     10.1 OVERVIEW 
     10.2 KEY STRATEGIES ADOPTED BY MAJOR PLAYERS 
             TABLE 64 AI SUPERCOMPUTER MARKET: OVERVIEW OF STRATEGIES ADOPTED BY KEY PLAYERS
     10.3 MARKET SHARE ANALYSIS, 2022 
             FIGURE 43 AI SUPERCOMPUTER MARKET SHARE ANALYSIS, 2022
             TABLE 65 AI SUPERCOMPUTER MARKET SHARE ANALYSIS, 2022
     10.4 REVENUE ANALYSIS, 2020–2022 
             FIGURE 44 REVENUE ANALYSIS OF FIVE KEY PLAYERS, 2020–2022
     10.5 COMPANY EVALUATION MATRIX, 2022 
             10.5.1 STARS
             10.5.2 EMERGING LEADERS
             10.5.3 PERVASIVE PLAYERS
             10.5.4 PARTICIPANTS
                        FIGURE 45 AI SUPERCOMPUTER MARKET: COMPANY EVALUATION MATRIX, 2022
     10.6 STARTUPS/SMALL AND MEDIUM-SIZED ENTERPRISES (SMES) EVALUATION MATRIX, 2022 
           TABLE 66 DETAILED LIST OF KEY START-UPS/SMES
             10.6.1 PROGRESSIVE COMPANIES
             10.6.2 RESPONSIVE COMPANIES
             10.6.3 DYNAMIC COMPANIES
             10.6.4 STARTING BLOCKS
                        FIGURE 46 AI SUPERCOMPUTER MARKET: START-UPS/SMES EVALUATION MATRIX, 2022
     10.7 COMPETITIVE BENCHMARKING 
             TABLE 67 AI SUPERCOMPUTER MARKET: COMPETITIVE BENCHMARKING OF KEY START-UPS/SME
             TABLE 68 AI SUPERCOMPUTER MARKET: DETAILED LIST OF KEY START-UPS/SMES
     10.8 COMPANY FOOTPRINT 
             TABLE 69 COMPANY FOOTPRINT
             TABLE 70 COMPONENT: COMPANY FOOTPRINT
             TABLE 71 APPLICATION: COMPANY FOOTPRINT
             TABLE 72 REGION: COMPANY FOOTPRINT
     10.9 COMPETITIVE SCENARIOS AND TRENDS 
             10.9.1 PRODUCT LAUNCHES
                        TABLE 73 AI SUPERCOMPUTER MARKET, PRODUCT LAUNCHES, 2020–2023
             10.9.2 DEALS
                        TABLE 74 DEALS, 2020–2023
 
11 COMPANY PROFILES (Page No. - 128)
     11.1 KEY PLAYERS 
(Business overview, Products/Solutions/Services offered, Recent developments, Product launches, Deals, MnM view, Key strengths/Right to win, Strategic choices made, and Weaknesses/Competitive threats)*  
             11.1.1 NVIDIA CORPORATION
                        TABLE 75 NVIDIA CORPORATION: COMPANY OVERVIEW
                        FIGURE 47 NVIDIA CORPORATION: COMPANY SNAPSHOT
                        TABLE 76 NVIDIA CORPORATION: PRODUCTS/SOLUTIONS/SERVICES OFFERED
                        TABLE 77 NVIDIA CORPORATION: PRODUCT LAUNCHES
                        TABLE 78 NVIDIA CORPORATION: DEALS
             11.1.2 INTEL CORPORATION
                        TABLE 79 INTEL CORPORATION: COMPANY OVERVIEW
                        FIGURE 48 INTEL CORPORATION: COMPANY SNAPSHOT
                        TABLE 80 INTEL CORPORATION: PRODUCTS/SOLUTIONS/SERVICES OFFERED
                        TABLE 81 INTEL CORPORATION: PRODUCT LAUNCHES
                        TABLE 82 INTEL CORPORATION: DEALS
             11.1.3 ADVANCED MICRO DEVICES, INC.
                        TABLE 83 ADVANCED MICRO DEVICES, INC.: COMPANY OVERVIEW
                        FIGURE 49 ADVANCED MICRO DEVICES, INC.: COMPANY SNAPSHOT
                        TABLE 84 ADVANCED MICRO DEVICES, INC.: PRODUCTS/SOLUTIONS/SERVICES OFFERED
                        TABLE 85 ADVANCED MICRO DEVICES, INC.: PRODUCT LAUNCHES
                        TABLE 86 ADVANCED MICRO DEVICES, INC.: DEALS
             11.1.4 SAMSUNG ELECTRONICS
                        TABLE 87 SAMSUNG ELECTRONICS: COMPANY OVERVIEW
                        FIGURE 50 SAMSUNG ELECTRONICS: COMPANY SNAPSHOT
                        TABLE 88 SAMSUNG ELECTRONICS: PRODUCTS/SOLUTIONS/SERVICES OFFERED
                        TABLE 89 SAMSUNG ELECTRONICS: PRODUCT LAUNCHES
                        TABLE 90 SAMSUNG ELECTRONICS: DEALS
             11.1.5 MICRON TECHNOLOGY, INC.
                        TABLE 91 MICRON TECHNOLOGY, INC.: COMPANY OVERVIEW
                        FIGURE 51 MICRON TECHNOLOGY, INC.: COMPANY SNAPSHOT
                        TABLE 92 MICRON TECHNOLOGY, INC.: PRODUCTS/SOLUTIONS/SERVICES OFFERED
                        TABLE 93 MICRON TECHNOLOGY, INC.: PRODUCT LAUNCHES
             11.1.6 IBM CORPORATION
                        TABLE 94 IBM CORPORATION: COMPANY OVERVIEW
                        FIGURE 52 IBM CORPORATION: COMPANY SNAPSHOT
                        TABLE 95 IBM CORPORATION: PRODUCTS/SOLUTIONS/SERVICES OFFERED
                        TABLE 96 IBM CORPORATION: PRODUCT LAUNCHES
                        TABLE 97 IBM CORPORATION: DEALS
             11.1.7 META
                        TABLE 98 META: COMPANY OVERVIEW
                        FIGURE 53 META: COMPANY SNAPSHOT
                        TABLE 99 META: PRODUCTS/SOLUTIONS/SERVICES OFFERED
             11.1.8 DELL INC.
                        TABLE 100 DELL INC.: COMPANY OVERVIEW
                        FIGURE 54 DELL INC.: COMPANY SNAPSHOT
                        TABLE 101 DELL INC.: PRODUCTS/SOLUTIONS/SERVICES OFFERED
                        TABLE 102 DELL INC.: DEALS
             11.1.9 GOOGLE
                        TABLE 103 GOOGLE: COMPANY OVERVIEW
                        FIGURE 55 GOOGLE: COMPANY SNAPSHOT
                        TABLE 104 GOOGLE: PRODUCTS/SOLUTIONS/SERVICES OFFERED
                        TABLE 105 GOOGLE: PRODUCT LAUNCHES
                        TABLE 106 GOOGLE: DEALS
             11.1.10 HUAWEI TECHNOLOGIES CO., LTD.
                        TABLE 107 HUAWEI TECHNOLOGIES CO., LTD.: COMPANY OVERVIEW
                        TABLE 108 HUAWEI TECHNOLOGIES CO., LTD.: PRODUCTS/SOLUTIONS/SERVICES OFFERED
                        TABLE 109 HUAWEI TECHNOLOGIES CO., LTD.: DEALS
             11.1.11 MICROSOFT
                        TABLE 110 MICROSOFT: COMPANY OVERVIEW
                        FIGURE 56 MICROSOFT: COMPANY SNAPSHOT
                        TABLE 111 MICROSOFT: PRODUCTS/SOLUTIONS/SERVICES OFFERED
                        TABLE 112 MICROSOFT: PRODUCT LAUNCHES
                        TABLE 113 MICROSOFT: DEALS
             11.1.12 CEREBRAS
                        TABLE 114 CEREBRAS: COMPANY OVERVIEW
                        TABLE 115 CEREBRAS: PRODUCTS/SOLUTIONS/SERVICES OFFERED
                        TABLE 116 CEREBRAS: PRODUCT LAUNCHES
                        TABLE 117 CEREBRAS: DEALS
     11.2 OTHER PLAYERS 
             11.2.1 HEWLETT PACKARD ENTERPRISE DEVELOPMENT LP
             11.2.2 FUJITSU
             11.2.3 PEZY GROUP
             11.2.4 TESLA
             11.2.5 ATOS SE
             11.2.6 NEC CORPORATION
             11.2.7 ORACLE
             11.2.8 AMAZON WEB SERVICES, INC.
             11.2.9 GROQ, INC.
             11.2.10 MEDIATEK INC.
             11.2.11 GRAPHCORE
             11.2.12 SAMBANOVA SYSTEMS, INC.
             11.2.13 KALRAY
             11.2.14 KNERON, INC.
             11.2.15 ARM LIMITED
*Details on Business overview, Products/Solutions/Services offered, Recent developments, Product launches, Deals, MnM view, Key strengths/Right to win, Strategic choices made, and Weaknesses/Competitive threats might not be captured in case of unlisted companies.  
 
12 APPENDIX (Page No. - 178)
     12.1 DISCUSSION GUIDE 
     12.2 KNOWLEDGESTORE: MARKETSANDMARKETS’ SUBSCRIPTION PORTAL 
     12.3 CUSTOMIZATION OPTIONS 
     12.4 RELATED REPORTS 
     12.5 AUTHOR DETAILS 
 

The research process for this study included systematic gathering, recording, and analysis of data about customers and companies operating in the AI supercomputer market. This process involved the extensive use of secondary sources, directories, and databases (Factiva, Oanda, and OneSource) for identifying and collecting valuable information for the comprehensive, technical, market-oriented, and commercial study of the AI supercomputer market. In-depth interviews were conducted with primary respondents, including experts from core and related industries and preferred manufacturers, to obtain and verify critical qualitative and quantitative information as well as to assess growth prospects. Key players in the AI supercomputer market were identified through secondary research, and their market rankings were determined through primary and secondary research. This research included studying annual reports of top players and interviewing key industry experts such as CEOs, directors, and marketing executives.

Secondary Research:

In the secondary research process, various sources were used to identify and collect information important for this study. These include annual reports, press releases & investor presentations of companies, white papers, technology journals, certified publications, articles by recognized authors, directories, and databases.

Secondary research was mainly used to obtain key information about the industry's supply chain, the total pool of market players, the classification of the market according to industry trends to the bottom-most level, regional markets, and key developments from the market and technology-oriented perspectives.

Primary Research

Primary research was also conducted to identify the segmentation types, key players, competitive landscape, and key market dynamics, such as drivers, restraints, opportunities, challenges, and industry trends, along with key strategies adopted by players operating in the AI supercomputer market. Extensive qualitative and quantitative analyses were performed on the complete market engineering process to list key information and insights throughout the report.

Extensive primary research has been conducted after acquiring knowledge about the AI supercomputer market scenario through secondary research. Several primary interviews have been conducted with experts from both demand (end users) and supply side (AI supercomputer component suppliers /providers) across four major geographic regions: North America, Europe, Asia Pacific, and RoW. Approximately 80% and 20% of the primary interviews have been conducted from the supply and demand side, respectively. These primary data have been collected through questionnaires, emails, and telephonic interviews.

Artificial Intelligence (AI) Supercomputer Market Size, and Share

To know about the assumptions considered for the study, download the pdf brochure

Market Size Estimation

In the complete market engineering process, both top-down and bottom-up approaches were implemented, along with several data triangulation methods, to estimate and validate the size of the Ai supercomputer market and various other dependent submarkets. Key players in the market were identified through secondary research, and their market share in the respective regions was determined through primary and secondary research. This entire research methodology included the study of annual and financial reports of the top players, as well as interviews with experts (such as CEOs, VPs, directors, and marketing executives) for key insights (quantitative and qualitative).

All percentage shares, splits, and breakdowns were determined using secondary sources and verified through primary sources. All the possible parameters that affect the markets covered in this research study were accounted for, viewed in detail, verified through primary research, and analyzed to obtain the final quantitative and qualitative data. This data was consolidated and supplemented with detailed inputs and analysis from MarketsandMarkets and presented in this report.

AI Supercomputer Market: Bottom-Up Approach

Artificial Intelligence (AI) Supercomputer Market Size, and Bottom-Up Approach

AI Supercomputer Market: Top-down Approach

Artificial Intelligence (AI) Supercomputer Market Size, and Top-down Approach

Data Triangulation

After arriving at the overall market size from the market size estimation process, as explained above, the total market has been split into several segments and subsegments. To complete the overall market engineering process and arrive at the exact statistics for all segments and subsegments, market breakdown and data triangulation procedures have been employed, wherever applicable. The data have been triangulated by studying various factors and trends from both the demand and supply sides. Along with this, the market has been validated using top-down and bottom-up approaches.

Market Definition

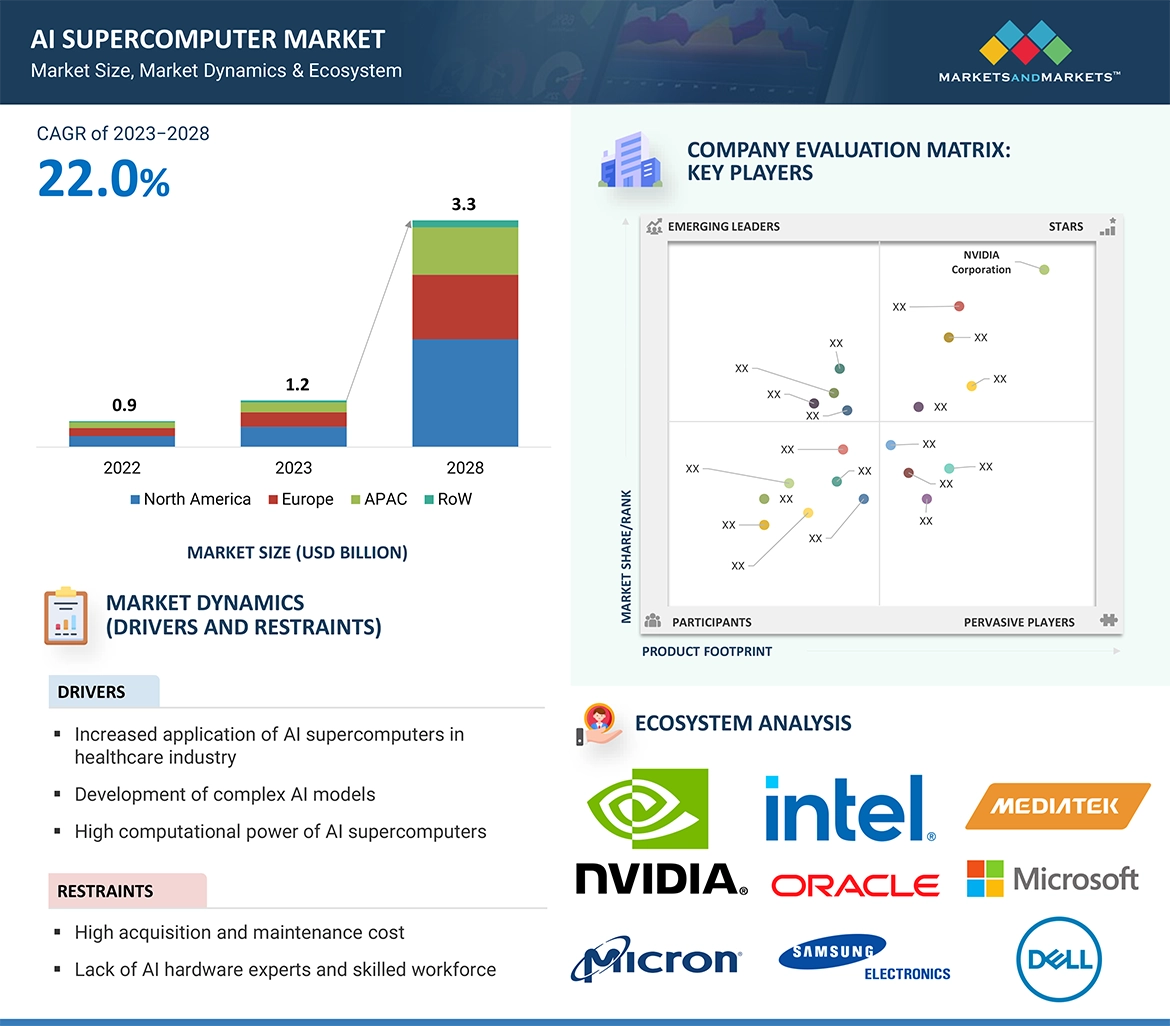
An AI supercomputer is a high-performance computing system designed and optimized for artificial intelligence (AI) and machine learning (ML) workloads. These supercomputers are equipped with powerful processors, extensive memory, and specialized hardware accelerators that can process massive amounts of data and perform complex AI calculations at unprecedented speeds.

Key Stakeholders

  • Technology providers
  • Cloud service providers
  • AI software developers
  • Research institutions
  • Investors and venture capitalists
  • Manufacturers and AI technology users
  • Investors (private equity firms, venture capitalists, and others)
  • Component and device suppliers and distributors
  • Government bodies such as regulatory authorities and policymakers
  • Market research and consulting firms

Report Objectives

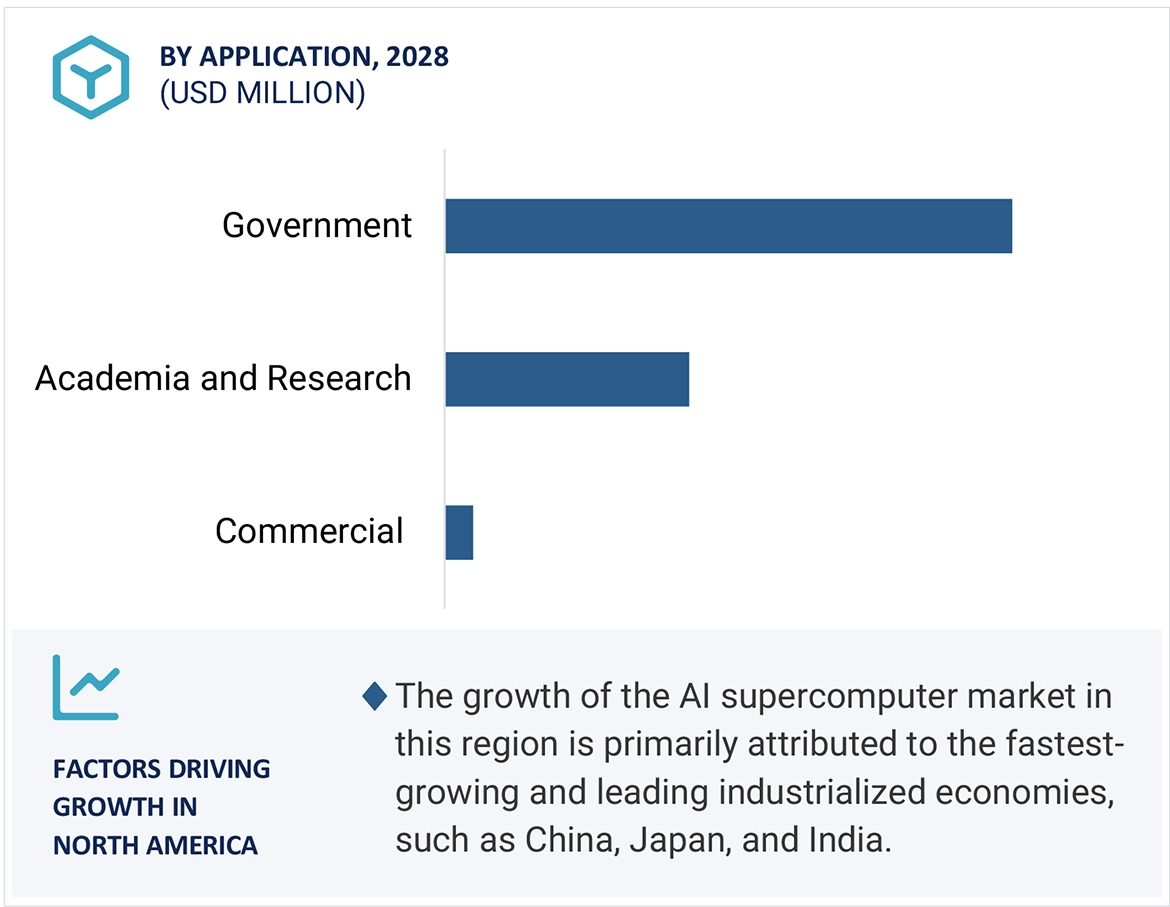
  • To describe, segment, and forecast the AI supercomputer market based on component and application in terms of value.
  • To describe and forecast the market for four key regions: North America, Europe, Asia Pacific, and the Rest of the World (RoW), in terms of value.
  • To describe elements with varied types and application modes of the AI supercomputer market.
  • To provide detailed information regarding drivers, restraints, opportunities, and challenges influencing the growth of the AI supercomputer market
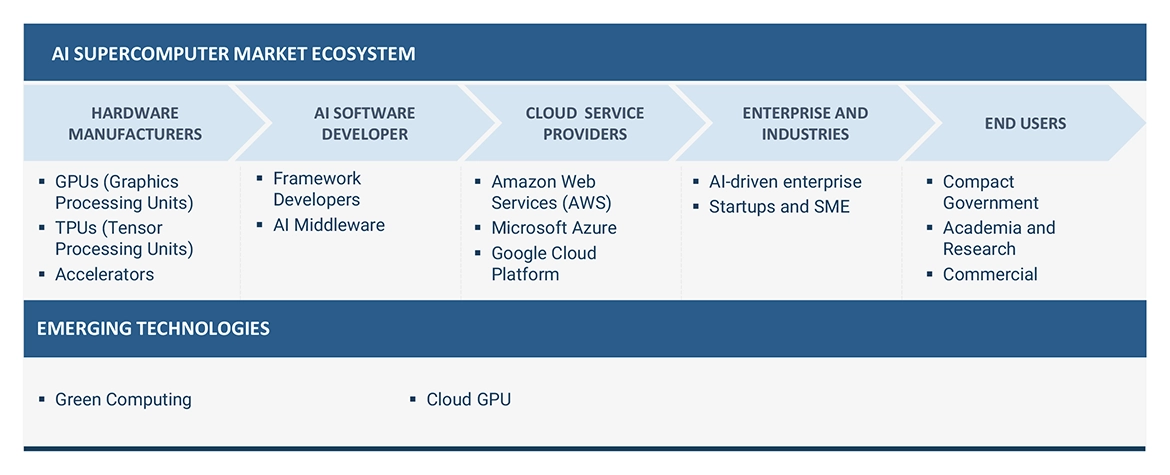
  • To provide a detailed overview of the supply chain and ecosystem pertaining to the AI supercomputer market, along with the average selling prices of components of AI supercomputer market.
  • To strategically analyze the ecosystem, tariffs and regulations, patent landscape, trade landscape, and case studies pertaining to the market under study
  • To strategically analyze micro markets with regard to individual growth trends, prospects, and contributions to the overall market
  • To analyze opportunities in the market for stakeholders and provide a competitive landscape of the market
  • To analyze competitive developments such as product launches and developments, expansions, partnerships, collaborations, contracts, and mergers and acquisitions in the AI supercomputer market
  • To strategically profile the key players in the AI supercomputer market and comprehensively analyze their market ranking and core competencies

Available Customizations

With the given market data, MarketsandMarkets offers customizations according to the company’s specific needs. The following customization options are available for the report:

Company Information

  • Detailed analysis and profiling of additional market players (up to 5)
Custom Market Research Services

We will customize the research for you, in case the report listed above does not meet with your exact requirements. Our custom research will comprehensively cover the business information you require to help you arrive at strategic and profitable business decisions.

Request Customization
Report Code
SE 8831
Published ON
Oct, 2023
Choose License Type
BUY NOW
  • SHARE
X
Request Customization
Speak to Analyst
Speak to Analyst
OR FACE-TO-FACE MEETING
PERSONALIZE THIS RESEARCH
  • Triangulate with your Own Data
  • Get Data as per your Format and Definition
  • Gain a Deeper Dive on a Specific Application, Geography, Customer or Competitor
  • Any level of Personalization
REQUEST A FREE CUSTOMIZATION
LET US HELP YOU!
  • What are the Known and Unknown Adjacencies Impacting the Artificial Intelligence (AI) Supercomputer Market
  • What will your New Revenue Sources be?
  • Who will be your Top Customer; what will make them switch?
  • Defend your Market Share or Win Competitors
  • Get a Scorecard for Target Partners
CUSTOMIZED WORKSHOP REQUEST
+1-888-600-6441
  • Call Us
  • +1-888-600-6441 (Corporate office hours)
  • +1-888-600-6441 (US/Can toll free)
  • +44-800-368-9399 (UK office hours)
CONNECT WITH US
ABOUT TRUST ONLINE
©2024 MarketsandMarkets Research Private Ltd. All rights reserved
DMCA.com Protection Status Website Feedback