Various secondary sources, directories, and databases have been used to identify and collect information for an extensive study of the automotive e-compressor market. The study involved four main activities in estimating the current size of the market: secondary research, validation through primary research, assumptions, and market analysis. Exhaustive secondary research was carried out to collect information on the market, the peer market, and the child markets. The next step was to validate these findings, assumptions, and market analysis with industry experts across the value chain through primary research. The top-down approach was employed to estimate the complete market size for vehicle and propulsion segments considered in this study.
Secondary Research
In the secondary research process, various secondary sources such as company annual reports/presentations, press releases, industry association publications [for example, publications of electric vehicle manufacturers, International Energy Agency (IEA), ACEA (European Automobile Manufacturers Association),Alternative Fuel Data Center (AFDC), European Alternate Fuels Observatory (EAFO), Federal Transit Administration (FTA), Regional Transportation Authority (RTA), country-level vehicle associations and trade organizations, and the US Department of Transportation (DOT)], EV related magazine articles, directories, technical handbooks, World Economic Outlook, trade websites, government organizations websites, and technical articles have been used to identify and collect information useful for an extensive study of the global electric vehicle and electric compressor market
Primary Research
Extensive primary research has been conducted after acquiring and understanding of this market scenario through secondary research. Several primary interviews have been conducted with market experts from the demand- and supply-side OEMs across four major regions, namely, Asia Pacific, Europe, North America, Middle East & Africa. Primary data has been collected through questionnaires, emails, LinkedIn, and telephonic interviews. In the canvassing of primaries, we have strived to cover various departments within organizations, such as sales, operations, and administration, to provide a holistic viewpoint in our report.
After interacting with industry experts, we conducted brief sessions with highly experienced independent consultants to reinforce the findings from our primaries. This, along with the in-house subject matter experts’ opinions, has led us to the findings as described in the remainder of this report. Following is the breakdown of primary respondents.

To know about the assumptions considered for the study, download the pdf brochure
Market Size Estimation
A detailed market estimation approach was followed to estimate and validate the value of the automotive e-compressor market and other dependent submarkets, as mentioned below:
The bottom-up approach has been used to estimate and validate the size of the E-compressor market. In this approach, vehicle sales statistics for each vehicle type have been considered at the country and regional levels. The penetration of each propulsion for each vehicle type at the country level has been identified through model mapping to determine the e-compressor market size in terms of volume. Then, the penetration of each propulsion at vehicle type for all countries has been applied to obtain the volume of the e-compressor market.
Extensive secondary and primary research has been conducted to understand the global market scenario for the e-compressor used in the automotive sector. Several primary interviews have been conducted with key opinion leaders related to e-compressors, including OEMs, Tier 1 suppliers, and applications. Qualitative aspects such as drivers, restraints, opportunities, and challenges have been considered while calculating and forecasting the market size.
Automotive E-Compressor Market: Bottom-Up Approach

To know about the assumptions considered for the study, Request for Free Sample Report
Automotive E-Compressor Market: Top-Down Approach
-
The top-down approach has been used to determine the size of the automotive e-compressor market for the segment. Although the total market size in value (USD million) is derived using the bottom-up approach, the segment – by compressor, technology, and capacity is derived using the top-down approach.
-
We have collected data from secondary research and paid databases and validated it through primary interviews. We have identified the penetration for each segment from the secondary sources. Additionally, the summation of companies’ revenue generated through the sale of a product and the total market size is calculated .

Data Triangulation
After arriving at the overall market size—using the market size estimation processes as explained above—the market was split into several segments and sub-segments. To complete the overall market engineering process and arrive at the exact statistics of each market segment and sub segment, data triangulation and market breakdown procedures were employed, wherever applicable. The data was triangulated by studying various factors and trends.
Market Definition
An electric compressor, or e-compressor, is a power unit that circulates refrigerant under pressure through the thermal management system. It is a crucial component in the thermal management system of electric vehicles. The primary function of the automotive e-compressor is to regulate the temperature within the vehicle cabin and manage the thermal conditions of critical components, such as batteries and power electronics.
In the HVAC (heating, ventilation, and air conditioning) system, the e-compressor plays a crucial role in providing efficient heating and cooling, ensuring passenger comfort. It also contributes to the thermal management of the battery pack, optimizing its performance and extending its lifespan. The e-compressor’s ability to operate independently from the vehicle’s engine allows for precise control over the climate inside the vehicle, enhancing energy efficiency and supporting the environmentally conscious goals of electric and hybrid vehicle technologies.
Stakeholders
-
Automobile Organizations/Associations
-
Country-specific Automotive Associations
-
Dealers and Distributors of E-compressors
-
Government & Research Organizations
-
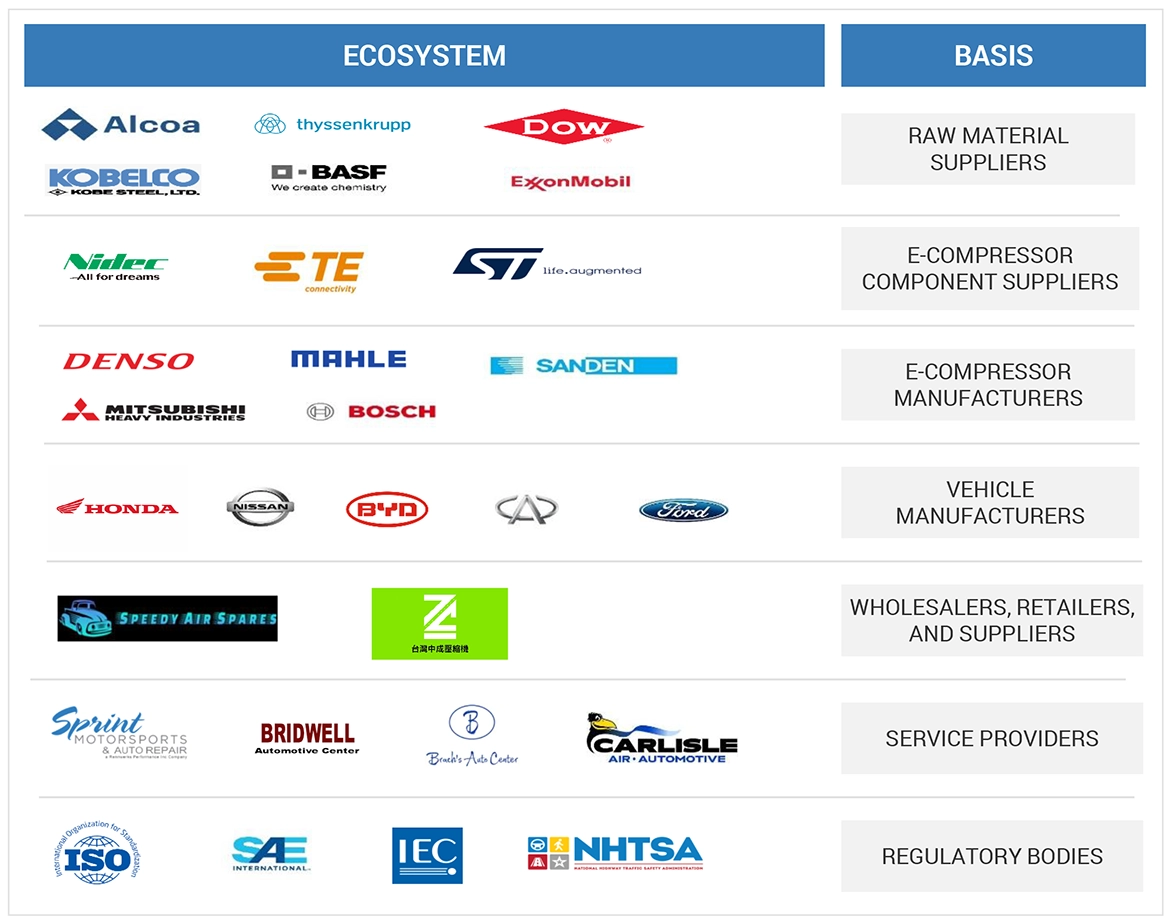
Manufacturers of Automotive E-compressors and Components
-
Original Equipment Manufacturers (OEMs)
-
Raw Material Suppliers for E-compressors
-
Regulatory Bodies
-
Traders and Suppliers of Automotive E-compressor Components
Report Objectives
-
To define, describe, segment, and forecast the size of the automotive e-compressor market in terms of volume (thousand units) and value (USD billion/million), from 2019 to 2033
-
To define, describe, and forecast the size of the market based on compressor type, capacity, vehicle type, propulsion, technology, and region
-
To segment and forecast the size of the market, in terms of volume (thousand units) and value (USD million), based on compressor type (scroll compressors, rotary screw compressors, centrifugal compressors, reciprocating compressors, and axial compressors)
-
To segment and forecast the size of the market, in terms of volume (thousand units) and value (USD million), based on capacity (small, medium, and large)
-
To segment and forecast the size of the market, in terms of volume (thousand units) and value (USD million), based on vehicle type (passenger cars, light commercial vehicles, and heavy commercial vehicles)
-
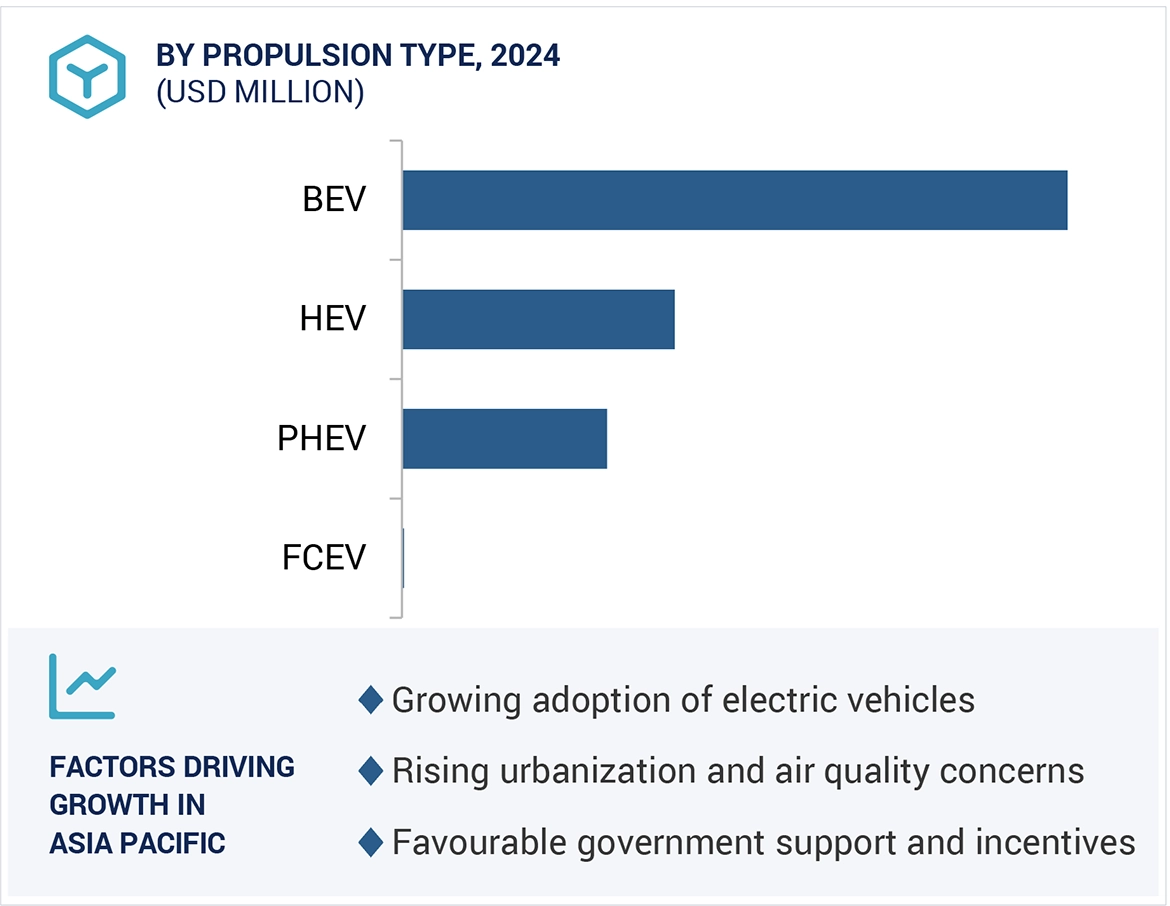
To segment and forecast the size of the market, in terms of volume (thousand units) and value (USD million), based on propulsion (BEV, PHEV, HEV, and FCEV)
-
To segment the market based on technology [variable frequency drive (VFD) and fixed-speed]
-
To define, describe, and forecast the size of the market, in terms of volume (units) and value (USD million), based on region (Asia Pacific, Europe, North America, Middle East & Africa)
-
To understand the market dynamics (drivers, restraints, opportunities, and challenges) and conduct patent analysis, case study analysis, value chain analysis, regulatory analysis, and ecosystem mapping
-
To strategically analyze markets with respect to individual growth trends, prospects, and contributions to the total market
-
To strategically profile key players and comprehensively analyze their respective market share and core competencies
-
To analyze recent developments, such as agreements, partnerships, collaborations, expansions, contracts, and product developments of key players in the automotive e-compressor market
-
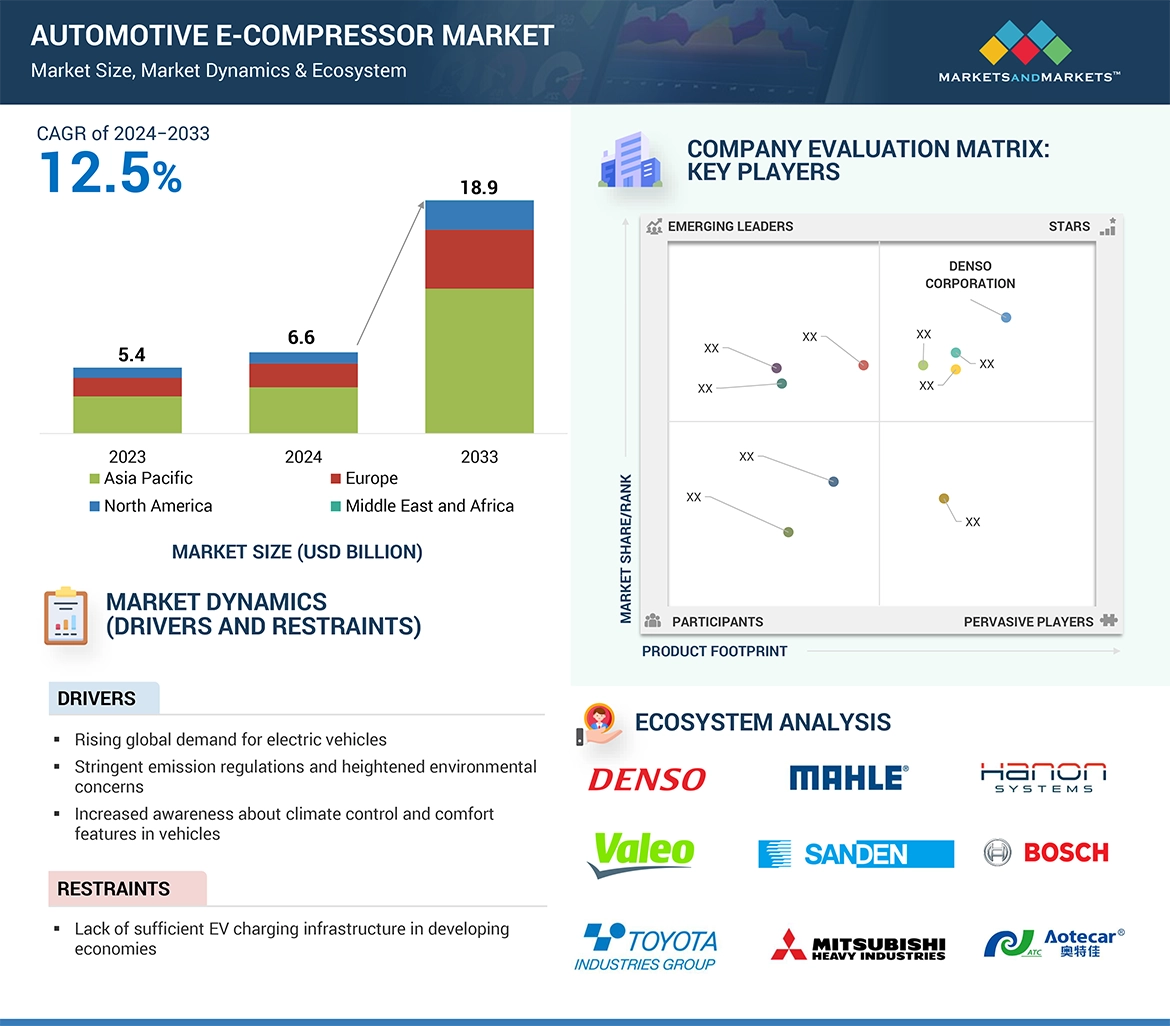
To understand the dynamics of the key market players and distinguish them into stars, emerging leaders, pervasive players, and participants according to their product portfolio strength and business strategies
-
To analyze the opportunities offered by various segments of the market to its stakeholders
Available Customizations
Along with the market data, MarketsandMarkets offers customizations in accordance with company-specific needs.
The following customization options are available for the report:
-
Market Size In Terms of Value (USD Million) And Volume (Thousand Units) At Country Level, By Propulsion Type
-
Market Size In Terms Of Value (USD Million) And Volume (Thousand Units) At Country Level, By Compressor Type
-
Detailed Analysis and Profiling of Additional Market Players


Growth opportunities and latent adjacency in Automotive E-Compressor Market