Battery TIC Market Size, Share & Trends

Battery Testing, Inspection, and Certification Market by Battery Type (Lithium-ion, Lead-acid), Standard and Certification Type (Safety Testing, EMC Testing), Application (Electric Vehicles, Consumer Electronics) and Region - Global Forecast to 2029

Report Code: SE 9083 Jul, 2024, by marketsandmarkets.com

Battery Testing, Inspection, and Certification Market Size Share Industry Growth and Trends

[259 Pages Report] The battery testing, inspection, and certification market is projected to reach USD 36.7 billion by 2029 from USD 14.9 billion in 2024 at a CAGR of 19.6% during the forecast period. Increasing adoption of EVs and energy storage systems, rising enforcement of stringent standards to ensure battery safety, thriving portable electronics industry, and rapid advances in battery technology are some of the major factors driving the market growth globally. Moreover, opportunities such as rising investment in clean energy initiatives, increasing automation of testing and inspection processes using digital technologies, and growing need for rigorous testing in electric aircraft and medical devices to drive the growth of battery testing, inspection, and certification industry.

Battery Testing, Inspection, and Certification Market

Battery Testing, Inspection, and Certification Market

Battery Testing, Inspection, and Certification Market Forecast to 2029

To know about the assumptions considered for the study, Request for Free Sample Report

Battery Testing, Inspection, and Certification Market Trends & Dynamics

Driver: Increasing adoption of EVs and Energy Storage Systems

The upward push in electric vehicle (EV) adoption and the growing use of energy storage systems (ESS) for renewable energy integration drive the demand for rigorous testing and certification of high-performance batteries. According to the International Energy Agency (IEA), international electric vehicle sales accounted13.9 million in 2023, a significant  35% growth from 2022. This growth is over six times higher than the entire electric powered vehicle sales in 2018, highlighting the fast adoption of electric vehicles over the last 5 years.

The international EV marketplace is expanding due to technological advancements, environmental policies, and expanded customer recognition of sustainable practices. Many governments offer incentives to inspire the adoption of EVs, accelerating marketplace growth. ESS is important in storing energy from intermittent renewable assets, which include solar and wind. It helps keep grid stability and ensure a non-stop electricity deliver, mainly for the duration of top demand periods or outages.

Restraint: High initial capital investment

The battery testing, inspection, and certification market confronts significant challenges due to the large capital expenditure required. Setting up sophisticated testing facilities and purchasing innovative equipment requires a major financial investment, particularly for smaller TIC service providers. For example, setting up a battery testing laboratory with necessary equipment like battery cyclers, heat chambers, and safety testing tools might cost millions of dollars.

According to About: Energy, testing batteries for EVs is a rigorous procedure, with each testing program typically requiring roughly 1,000 channels for cell testing, which can cost up to USD 7.5 million for cell cycles alone. The channel demand might treble when testing at the module and pack levels, demonstrating the significant cost needed to verify the reliability and safety of EV batteries and highlighting the high capital costs associated with battery testing. This high capital requirement acts as a barrier to entry, limiting the market participation of smaller players and start-ups.

Opportunity: Rising investment in clean energy initiatives

The growing adoption of electric vehicles (EVs) worldwide and  rising use of energy storage systems (ESS) is driving the growth and expansion of battery testing, inspection, and certification market. The lithium-ion batteries are adapted due to their higher energy density and longer lifespan, which makes them ideal for EVs and ESS. As more EVs and ESS are adopted, the demand for testing and certification of these batteries to ensure they meet safety and performance standards is on the rise. This necessity is propelling the growth of the TIC market.

Challenge: Complexities associated with next-generation batteries

Rapid advancements in battery technologies are both fueling the expansion of the battery testing, inspection, and certification market and creating significant challenges. Cutting edge designs, materials, and chemical compositions are challenging established testing methods and necessitating the development of fresh approaches. The lack of standard testing procedures for modern battery technologies puts current testing frameworks and technological advancements at odds and highlights the need for adaptable and agile testing protocols.
The increased complexity of next-generation batteries, like solid-state and lithium-sulfur batteries, has made the battery testing, inspection, and certification industry more challenging. These state-of-the-art batteries have unique properties and modes of failure that necessitate specific testing techniques and equipment. To meet these challenges, large expenditures in R&D, specialized education, and new skills are required.

Battery Testing, Inspection, and Certification Market Ecosystem

The major players in the battery testing, inspection, and certification market with a significant global presence include UL LLC(US), SGS SA (Switzerland), Intertek Group plc (UK), Bureau Veritas (France), and DEKRA (Germany). These companies not only boast a comprehensive service portfolio but also have a strong geographic footprint.

Battery Testing, Inspection, and Certification Market by Ecosystem

Lead-Acid to register second highest CAGR during the forecast period.

One of the oldest types of rechargeable batteries, lead-acid has appreciated qualities in reliability, safety, and cost-effectiveness. They can also deliver very high surge currents after the delivery of their discharge at a stable voltage over some extended time. Compared to newer technologies such as lithium-ion, lead-acid batteries are more robust and less sensitive to overcharging. It consists of positive and negative plates, a separator, and an electrolyte. These batteries are designed to be simple to produce, cost-effective, and with a life expectancy of two to three years. Since these batteries give off high voltage, they find prominence in most standby power systems like in telecommunication equipment, cars, boats, forklifts, and UPS systems. The key players offering lead-acid batteries include Clarios, GS Yuasa International, and Power Sonic Corporation.

Applications range from automotive, for example, starter batteries for internal combustion engine vehicles, to backup power supplies such as uninterruptible power supplies  and industrial applications such as in forklifts and telecommunications. They are also used in renewable energy storage systems. Stationary lead–acid batteries IEC 60896 require certification for safety; valve regulated and vented standby UL 1989 certification.

Testing to account for the largest share of battery testing, inspection, and certification market during the forecast period.

It is necessary to test batteries to ensure that they are safe and also for the durability of the battery powering vehicles, appliances, and storage. These different tests range from electrical and mechanical tests to environmental tests, including performance checks against varied conditions like temperature, load, charge-discharge cycles, and so on. This gives the product reliability and helps consumers to be safe by detecting the problem at an early stage, thus making sure the battery is safe to use and meets the required performance. As penetration by EVs grows, accompanied by exponential development in new battery technologies, so does the call for all-rounded battery testing services.

Industrial Equipment to account for the largest share of battery testing, inspection, and certification  market during the forecast period.

Industrial equipment applications, including power tools, telecommunication systems, and ESS, represent a significant market for battery testing, inspection, and certification services. Most of these applications typically call for long-life and reliable batteries to reduce losses caused by operational conditioning of the system while minimizing time loss. However, the extremely harsh conditions to which these batteries can be exposed may lead to safety problems due to high temperatures and vibrations. This demands strong testing and certification procedures to prevent problems that could result in fire or explosion and guarantee safe performance.
Moreover, the demands of the Battery Testing, Inspection, and Certification Market are expected to grow significantly due to the cordless and mobile tools segment, integration of ESS into industrial applications, and the requirement for reliable sources of power.

Asia Pacific to account for the largest share during the forecast period.

The largest share of battery testing, inspection, and certification market is dominated by the Asia Pacific, as this region holds well-established battery manufacturers, such as  Contemporary Amperex Technology Co., Ltd. (CATL) (China) and BYD Company Ltd. (China), who have made a significant contribution to signing partnership agreements with peers in the industry. Additionally, government initiatives welcoming electric vehicles further accelerate the growth of the market. Here, there is a strong presence of the globally competitive battery manufacturers, with increasing investments from the governments supporting such progression.

Battery Testing, Inspection, and Certification Market by Region

Battery Testing, Inspection, and Certification Market by Region

To know about the assumptions considered for the study, download the pdf brochure

Top Companies Battery Testing, Inspection, and Certification Market - Key Market Players

The major players in the battery testing, inspection, and certification companies with a significant global presence include UL LLC(US), SGS SA (Switzerland), Intertek Group plc (UK), Bureau Veritas (France), and DEKRA (Germany). These players have adopted various organic and inorganic growth strategies such as service launches and developments, partnerships, collaborations, acquisitions, and joint ventures to strengthen their position in the battery testing, inspection, and certification market.

Scope of the Battery Testing, Inspection, and Certification Market Report

Report Metric

Details

Estimated Market Size USD 14.9 billion in 2024  
Projected Market Size USD 36.7 billion by 2029
Market Growth Rate at a CAGR of 19.6%

Market size available for years

2020–2029

Base year considered

2023

Forecast period

2024–2029

Forecast units

Value (USD Million)

Segments covered

By Standard & Certification Type, Battery Type, Service Type, Application, and Region

Geographies covered

North America, Europe, Asia Pacific, and Rest of World

Companies covered

The key players in the battery testing, inspection, and certification market with a significant global presence include UL LLC (US), SGS SA (Switzerland), Intertek Group plc (UK), TÜV NORD GROUP (Germany), Bureau Veritas (France), DEKRA (Germany), DNV GL (Norway), Eurofins Scientific (Luxembourg), TÜV Rheinland (Germany), TÜV SÜD (Germany).

Battery Testing, Inspection, and Certification Market Highlights

The study segments the battery testing, inspection, and certification market based on standard and  certification type, battery type, service type, application, and market type at the regional and global level.

Segment

Subsegment

By Standard and Certification Type

  • Safety Testing
    • Electrical Testing
    • Mechanical Testing
    • Environmental Testing
    • Other Specialized Safety Testing
  • EMC testing
  • Performance Testing
  • Others

By Battery Type

  • Lithium-ion
  • Lead–Acid
  • Nickel–Metal Hydride
  • Other Battery Types

By Service Type

  • Testing
  • Inspection
  • Certification

By Application

  • Electric Vehicles (EVs)
  • Internal Combustion Engine (ICE) Vehicles
  • Consumer Electronics
  • Industrial Equipment
  • Medical Devices
  • Other Applications

By Region

  • North America
  • Europe
  • Asia Pacific
  • RoW

Recent Developments

  • In September 2023, UL LLC launched a new safety service for lithium-ion battery-powered aviation GSE, meeting all requirements of UL 5840 standard. This service addresses the hazard of fire, electric shock, and explosion throughout the equipment; it will align with the drive by the aviation sector to replace traditional diesel-powered GSE with electric GSE in a campaign to attain the sustainable goal set on carbon reduction and end the use of diesel-driven vehicles.
  • In April 2022, DEKRA introduced a new fast battery test service to corporate customers in Germany. This patented process, validated according to RWTH Aachen University and different vehicle manufacturers, gives in only fifteen minutes an SoH value of the traction batteries with a high accuracy.
  • In April 2024, Modern Testing Services, (Dongguan) Limited, which is part of the Eurofins Scientific Toys & Hardlines laboratory network, is happy to introduce a new testing service that modern offers in support of children's products that contain button cell or coin batteries in compliance with 16 CFR 1263.
  • In August 2023, TÜV Rheinland, in a joint venture with battery analytics specialist TWAICE, launched the Battery Quick Check GmbH, a certified battery test for battery electric vehicles. This service precisely evaluates the condition of traction batteries in used electric vehicles, providing a detailed State of Health report certified by TÜV Rheinland.

Frequently Asked Questions (FAQs):

To speak to our analyst for a discussion on the above findings, click Speak to Analyst

TABLE OF CONTENTS
 
1 INTRODUCTION (Page No. - 24)
    1.1 STUDY OBJECTIVES 
    1.2 MARKET DEFINITION 
    1.3 STUDY SCOPE 
           1.3.1 MARKETS COVERED
           1.3.2 REGIONAL SCOPE
           1.3.3 YEARS CONSIDERED
           1.3.4 INCLUSIONS AND EXCLUSIONS
    1.4 CURRENCY CONSIDERED 
    1.5 LIMITATIONS 
    1.6 UNIT CONSIDERED 
    1.7 STAKEHOLDERS 
    1.8 IMPACT OF RECESSION 
 
2 RESEARCH METHODOLOGY (Page No. - 29)
    2.1 RESEARCH APPROACH 
           2.1.1 SECONDARY DATA
                    2.1.1.1 List of major secondary sources
                    2.1.1.2 Key data from secondary sources
           2.1.2 PRIMARY DATA
                    2.1.2.1 Intended participants in primary interviews
                    2.1.2.2 List of key primary interview participants
                    2.1.2.3 Breakdown of primaries
                    2.1.2.4 Key data from primary sources
           2.1.3 SECONDARY AND PRIMARY RESEARCH
                    2.1.3.1 Key industry insights
    2.2 MARKET SIZE ESTIMATION 
           2.2.1 BOTTOM-UP APPROACH
                    2.2.1.1 Approach to estimate market size using bottom-up analysis (demand side)
           2.2.2 TOP-DOWN APPROACH
                    2.2.2.1 Approach to estimate market size using top-down analysis (supply side)
    2.3 FACTOR ANALYSIS 
           2.3.1 DEMAND-SIDE ANALYSIS
           2.3.2 SUPPLY-SIDE ANALYSIS
           2.3.3 MARKET GROWTH FORECAST
    2.4 RECESSION IMPACT ANALYSIS 
    2.5 DATA TRIANGULATION 
    2.6 RESEARCH ASSUMPTIONS 
    2.7 RISK ASSESSMENT 
 
3 EXECUTIVE SUMMARY (Page No. - 42)
 
4 PREMIUM INSIGHTS (Page No. - 47)
    4.1 ATTRACTIVE OPPORTUNITIES FOR PLAYERS IN BATTERY TIC MARKET 
    4.2 BATTERY TIC MARKET, BY STANDARD AND CERTIFICATION TYPE 
    4.3 BATTERY TIC MARKET, BY BATTERY TYPE 
    4.4 BATTERY TIC MARKET, BY SERVICE TYPE 
    4.5 BATTERY TIC MARKET, BY APPLICATION 
    4.6 BATTERY TIC MARKET IN ASIA PACIFIC, BY BATTERY TYPE AND COUNTRY 
 
5 MARKET OVERVIEW (Page No. - 51)
    5.1 INTRODUCTION 
    5.2 MARKET DYNAMICS 
           5.2.1 DRIVERS
                    5.2.1.1 Increasing adoption of EVs and energy storage systems
                    5.2.1.2 Rising enforcement of stringent standards to ensure battery safety
                    5.2.1.3 Thriving portable electronics industry
                    5.2.1.4 Rapid advances in battery technology
           5.2.2 RESTRAINTS
                    5.2.2.1 High initial capital investment
                    5.2.2.2 Lack of uniform and standardized testing protocols
                    5.2.2.3 High testing and certification costs
           5.2.3 OPPORTUNITIES
                    5.2.3.1 Rising investment in clean energy initiatives
                    5.2.3.2 Increasing automation of testing and inspection processes using digital technologies
                    5.2.3.3 Growing need for rigorous testing of electric aircraft and medical devices
           5.2.4 CHALLENGES
                    5.2.4.1 Complexities associated with next-generation batteries
                    5.2.4.2 Technical barriers to trade due to regulatory divergence
                    5.2.4.3 Rise in geopolitical tensions
    5.3 TRENDS/DISRUPTIONS IMPACTING CUSTOMERS’ BUSINESSES 
    5.4 PRICING ANALYSIS 
           5.4.1 INDICATIVE PRICING TREND OF BATTERY CERTIFICATIONS
           5.4.2 INDICATIVE PRICING TREND, BY REGION
    5.5 SUPPLY CHAIN ANALYSIS 
    5.6 ECOSYSTEM ANALYSIS 
    5.7 INVESTMENT AND FUNDING SCENARIO 
    5.8 TECHNOLOGY ANALYSIS 
           5.8.1 KEY TECHNOLOGIES
                    5.8.1.1 High-precision charging and discharging systems
           5.8.2 COMPLEMENTARY TECHNOLOGIES
                    5.8.2.1 Battery packaging and enclosure
           5.8.3 ADJACENT TECHNOLOGIES
                    5.8.3.1 Energy storage and management systems
    5.9 PATENT ANALYSIS 
    5.10 TRADE ANALYSIS 
           5.10.1 EXPORT SCENARIO (HS CODE 8507)
           5.10.2 IMPORT SCENARIO (HS CODE 8507)
    5.11 KEY CONFERENCES AND EVENTS, 2024–2025 
    5.12 CASE STUDY ANALYSIS 
           5.12.1 INTERTEK GROUP PLC DEVELOPS TEST PROTOCOLS AND EVALUATION METHODS TO HELP AUTOMOTIVE OEM CONSORTIUM MEET STRINGENT REGULATORY REQUIREMENTS
           5.12.2 INTERTEK GROUP PLC CONDUCTS BATTERY TESTING AND MATHEMATICAL MODELING TO HELP MILITARY DIVISION IDENTIFY NICD BATTERY ALTERNATIVES
           5.12.3 TRIATHLON GROUP PARTNERS WITH UL LLC TO OBTAIN CERTIFICATIONS FOR LITHIUM-ION BATTERIES
           5.12.4 LABTEST CERTIFICATION INC. TESTS BATTERY PACKS TO ADHERE TO SAFETY AND PERFORMANCE STANDARDS
           5.12.5 LABTEST CERTIFICATION INC. SUBJECTS BATTERY SYSTEMS TO RIGOROUS TESTING TO DEMONSTRATE DURABILITY AND SAFETY
    5.13 REGULATORY LANDSCAPE 
           5.13.1 REGULATORY BODIES, GOVERNMENT AGENCIES, AND OTHER ORGANIZATIONS
    5.14 PORTER’S FIVE FORCES ANALYSIS 
           5.14.1 THREAT OF NEW ENTRANTS
           5.14.2 THREAT OF SUBSTITUTES
           5.14.3 BARGAINING POWER OF SUPPLIERS
           5.14.4 BARGAINING POWER OF BUYERS
           5.14.5 INTENSITY OF COMPETITIVE RIVALRY
    5.15 KEY STAKEHOLDERS AND BUYING CRITERIA 
           5.15.1 KEY STAKEHOLDERS IN BUYING PROCESS
           5.15.2 BUYING CRITERIA
 
6 USERS OF BATTERY TIC SERVICES (Page No. - 86)
    6.1 INTRODUCTION 
    6.2 BATTERY MANUFACTURERS 
    6.3 BATTERY-OPERATED PRODUCT MANUFACTURERS/USERS 
 
7 BATTERY TIC MARKET, BY STANDARD AND CERTIFICATION TYPE (Page No. - 88)
    7.1 INTRODUCTION 
    7.2 SAFETY TESTING 
           7.2.1 INCREASING USE OF SPECIALIZED BATTERY TECHNOLOGIES IN CRITICAL APPLICATIONS TO ACCELERATE SEGMENTAL GROWTH
    7.3 EMC TESTING 
           7.3.1 COMMERCIALIZATION OF VARIETIES OF ELECTRONIC DEVICES TO CONTRIBUTE TO SEGMENTAL GROWTH
    7.4 PERFORMANCE TESTING 
           7.4.1 GROWING DEMAND FOR HIGH-PERFORMANCE AND LONG-LASTING BATTERIES ACROSS INDUSTRIES TO SUPPORT SEGMENTAL GROWTH
    7.5 OTHERS 
 
8 BATTERY TIC MARKET, BY BATTERY TYPE (Page No. - 96)
    8.1 INTRODUCTION 
    8.2 LITHIUM-ION 
           8.2.1 GROWING DEMAND FOR EVS TO DRIVE MARKET
    8.3 LEAD–ACID 
           8.3.1 INCREASING NEED FOR UNINTERRUPTED POWER SUPPLY IN AUTOMOTIVE APPLICATIONS TO FUEL MARKET GROWTH
    8.4 NICKEL–METAL HYDRIDE 
           8.4.1 EXTENSIVE USE OF NIMH BATTERIES IN HYBRID ELECTRIC VEHICLES AND INDUSTRIAL EQUIPMENT TO FOSTER MARKET GROWTH
    8.5 OTHER BATTERY TYPES 
 
9 BATTERY TIC MARKET, BY APPLICATION (Page No. - 121)
    9.1 INTRODUCTION 
    9.2 ELECTRIC VEHICLES (EVS) 
           9.2.1 GOVERNMENT INCENTIVES AND REGULATORY POLICIES PROMOTING ADOPTION OF EVS TO SUPPORT MARKET GROWTH
    9.3 ICE VEHICLES 
           9.3.1 LOWER COST AND WIDESPREAD AVAILABILITY OF FUEL STATIONS TO DRIVE MARKET
    9.4 CONSUMER ELECTRONICS 
           9.4.1 THRIVING PORTABLE ELECTRONICS INDUSTRY TO ACCELERATE MARKET GROWTH
    9.5 INDUSTRIAL EQUIPMENT 
           9.5.1 INCREASING IMPLEMENTATION OF ENERGY STORAGE SYSTEMS TO BOOST DEMAND
    9.6 MEDICAL DEVICES 
           9.6.1 STRINGENT SAFETY AND RELIABILITY STANDARDS TO CONTRIBUTE TO MARKET GROWTH
    9.7 OTHER APPLICATIONS 
 
10 BATTERY TIC MARKET, BY SERVICE TYPE (Page No. - 133)
     10.1 INTRODUCTION 
     10.2 TESTING 
             10.2.1 RISING DEMAND FOR ELECTRIC VEHICLES AND BATTERY-POWERED DEVICES TO AUGMENT SEGMENTAL GROWTH
     10.3 INSPECTION 
             10.3.1 GROWING DEPLOYMENT OF INDUSTRY 4.0 TECHNOLOGIES TO CREATE OPPORTUNITIES FOR INSPECTION SERVICE PROVIDERS
     10.4 CERTIFICATION 
             10.4.1 INCREASING NEED TO COMPLY WITH SAFETY AND REGULATORY STANDARDS TO ACCELERATE DEMAND FOR CERTIFICATION SERVICES
 
11 BATTERY TIC MARKET, BY REGION (Page No. - 138)
     11.1 INTRODUCTION 
     11.2 NORTH AMERICA 
             11.2.1 RECESSION IMPACT ON MARKET IN NORTH AMERICA
             11.2.2 US
                        11.2.2.1 Growing emphasis on cleaner energy adoption to drive market
             11.2.3 CANADA
                        11.2.3.1 Booming electric vehicle industry to fuel market growth
             11.2.4 MEXICO
                        11.2.4.1 Increasing investment in establishing battery manufacturing plants to foster market growth
     11.3 EUROPE 
             11.3.1 RECESSION IMPACT ON MARKET IN EUROPE
             11.3.2 UK
                        11.3.2.1 Government initiatives encouraging adoption of clean energy to accelerate market growth
             11.3.3 GERMANY
                        11.3.3.1 Presence of major battery TIC service providers to support market growth
             11.3.4 FRANCE
                        11.3.4.1 Increasing sales of EV and HEV cars to contribute to market growth
             11.3.5 REST OF EUROPE
     11.4 ASIA PACIFIC 
             11.4.1 RECESSION IMPACT ON MARKET IN ASIA PACIFIC
             11.4.2 CHINA
                        11.4.2.1 Growing partnership agreements of battery manufacturers with TIC service provides to drive market
             11.4.3 JAPAN
                        11.4.3.1 Robust presence of specialist battery material and chemical suppliers to augment market growth
             11.4.4 SOUTH KOREA
                        11.4.4.1 Strong presence of globally competitive battery manufacturers to support market growth
             11.4.5 REST OF ASIA PACIFIC
     11.5 ROW 
             11.5.1 RECESSION IMPACT ON MARKET IN ROW
             11.5.2 SOUTH AMERICA
                        11.5.2.1 Growing demand for emergency power storage systems to create opportunities for TIC service providers
             11.5.3 MIDDLE EAST
                        11.5.3.1 Government initiatives promoting sustainable energy sources and electric vehicle adoption to create growth opportunities
                        11.5.3.2 GCC countries
                        11.5.3.3 Rest of Middle East
             11.5.4 AFRICA
                        11.5.4.1 Growing investments in advanced battery technologies to drive market
 
12 COMPETITIVE LANDSCAPE (Page No. - 167)
     12.1 INTRODUCTION 
     12.2 KEY PLAYER STRATEGIES/RIGHT TO WIN, 2020–2023 
     12.3 MARKET SHARE ANALYSIS, 2023 
     12.4 COMPANY VALUATION AND FINANCIAL METRICS 
     12.5 BRAND/PRODUCT COMPARISON 
     12.6 REVENUE ANALYSIS, 2021–2023 
     12.7 COMPANY EVALUATION MATRIX: KEY PLAYERS, 2023 
             12.7.1 STARS
             12.7.2 EMERGING LEADERS
             12.7.3 PERVASIVE PLAYERS
             12.7.4 PARTICIPANTS
             12.7.5 COMPANY FOOTPRINT: KEY PLAYERS, 2023
                        12.7.5.1 Company footprint
                        12.7.5.2 Standard and certification type footprint
                        12.7.5.3 Battery type footprint
                        12.7.5.4 Service type footprint
                        12.7.5.5 Application footprint
                        12.7.5.6 Region footprint
     12.8 COMPANY EVALUATION MATRIX: START-UPS/SMES, 2023 
             12.8.1 PROGRESSIVE COMPANIES
             12.8.2 RESPONSIVE COMPANIES
             12.8.3 DYNAMIC COMPANIES
             12.8.4 STARTING BLOCKS
             12.8.5 COMPETITIVE BENCHMARKING: START-UPS/SMES, 2023
                        12.8.5.1 Detailed list of key start-ups/SMEs
                        12.8.5.2 Competitive benchmarking of key start-ups/SMEs
     12.9 COMPETITIVE SCENARIO AND TRENDS 
             12.9.1 SERVICE LAUNCHES
             12.9.2 DEALS
             12.9.3 EXPANSIONS
 
13 COMPANY PROFILES (Page No. - 194)
     13.1 INTRODUCTION 
     13.2 KEY PLAYERS 
             13.2.1 UL LLC
                        13.2.1.1 Business overview
                        13.2.1.2 Services offered
                        13.2.1.3 Recent developments
                                     13.2.1.3.1 Service launches
                                     13.2.1.3.2 Deals
                                     13.2.1.3.3 Expansions
                        13.2.1.4 MnM view
                                     13.2.1.4.1 Key strengths/Right to win
                                     13.2.1.4.2 Strategic choices
                                     13.2.1.4.3 Weaknesses/Competitive threats
             13.2.2 SGS SA
                        13.2.2.1 Business overview
                        13.2.2.2 Services offered
                        13.2.2.3 Recent developments
                                     13.2.2.3.1 Deals
                                     13.2.2.3.2 Expansions
                        13.2.2.4 MnM view
                                     13.2.2.4.1 Key strengths/Right to win
                                     13.2.2.4.2 Strategic choices
                                     13.2.2.4.3 Weaknesses/Competitive threats
             13.2.3 INTERTEK GROUP PLC
                        13.2.3.1 Business overview
                        13.2.3.2 Services offered
                        13.2.3.3 Recent developments
                                     13.2.3.3.1 Deals
                                     13.2.3.3.2 Expansions
                        13.2.3.4 MnM view
                                     13.2.3.4.1 Key strengths/Right to win
                                     13.2.3.4.2 Strategic choices
                                     13.2.3.4.3 Weaknesses/Competitive threats
             13.2.4 BUREAU VERITAS
                        13.2.4.1 Business overview
                        13.2.4.2 Services offered
                        13.2.4.3 Recent developments
                                     13.2.4.3.1 Deals
                        13.2.4.4 MnM view
                                     13.2.4.4.1 Key strengths/Right to win
                                     13.2.4.4.2 Strategic choices
                                     13.2.4.4.3 Weaknesses/Competitive threats
             13.2.5 DEKRA
                        13.2.5.1 Business overview
                        13.2.5.2 Services offered
                        13.2.5.3 Recent developments
                                     13.2.5.3.1 Service launches
                                     13.2.5.3.2 Expansions
                        13.2.5.4 MnM view
                                     13.2.5.4.1 Key strengths/Right to win
                                     13.2.5.4.2 Strategic choices
                                     13.2.5.4.3 Weaknesses/Competitive threats
             13.2.6 TÜV NORD GROUP
                        13.2.6.1 Business overview
                        13.2.6.2 Services offered
             13.2.7 DNV GL
                        13.2.7.1 Business overview
                        13.2.7.2 Services offered
             13.2.8 EUROFINS SCIENTIFIC
                        13.2.8.1 Business overview
                        13.2.8.2 Services offered
                        13.2.8.3 Recent developments
                                     13.2.8.3.1 Service launches
                                     13.2.8.3.2 Expansions
             13.2.9 TÜV RHEINLAND
                        13.2.9.1 Business overview
                        13.2.9.2 Services offered
                        13.2.9.3 Recent developments
                                     13.2.9.3.1 Service launches
                                     13.2.9.3.2 Expansions
             13.2.10 TÜV SÜD
                        13.2.10.1 Business overview
                        13.2.10.2 Services offered
                        13.2.10.3 Recent developments
                                     13.2.10.3.1 Deals
                                     13.2.10.3.2 Expansions
     13.3 OTHER PLAYERS 
             13.3.1 CSA GROUP TESTING & CERTIFICATION INC.
             13.3.2 ELEMENT MATERIALS TECHNOLOGY
             13.3.3 APPLUS+
             13.3.4 NEMK0
             13.3.5 VDE RENEWABLES GMBH
             13.3.6 INTL
             13.3.7 DONGGUAN LEPONT TESTING SERVICE CO., LTD.
             13.3.8 CIRS GROUP
             13.3.9 LABTEST CERTIFICATION INC.
             13.3.10 KIWA
             13.3.11 ATIC (GUANGZHOU) CO., LTD.
             13.3.12 APPLIED TECHNICAL SERVICES
             13.3.13 CARELABS
             13.3.14 MCM TECHNOLOGY & SERVICE
             13.3.15 CESI (KEMA LABS)
 
14 APPENDIX (Page No. - 252)
     14.1 INSIGHTS FROM INDUSTRY EXPERTS 
     14.2 DISCUSSION GUIDE 
     14.3 KNOWLEDGESTORE: MARKETSANDMARKETS’ SUBSCRIPTION PORTAL 
     14.4 CUSTOMIZATION OPTIONS 
     14.5 RELATED REPORTS 
     14.6 AUTHOR DETAILS 
 
LIST OF TABLES (192 TABLES)
 
TABLE 1 INCLUSIONS AND EXCLUSIONS: BY COMPANY
TABLE 2 INCLUSIONS AND EXCLUSIONS: BY STANDARD AND CERTIFICATION TYPE
TABLE 3 INCLUSIONS AND EXCLUSIONS: BY BATTERY TYPE
TABLE 4 INCLUSIONS AND EXCLUSIONS: BY APPLICATION
TABLE 5 INCLUSIONS AND EXCLUSIONS: BY SERVICE TYPE
TABLE 6 INCLUSIONS AND EXCLUSIONS: BY REGION
TABLE 7 MARKET GROWTH FORECAST
TABLE 8 RISK ASSESSMENT: BATTERY TIC MARKET
TABLE 9 INDICATIVE PRICING TREND OF BATTERY CERTIFICATIONS, 2021–2023 (USD)
TABLE 10 INDICATIVE PRICING TREND OF IEC BATTERY CERTIFICATIONS, BY REGION, 2021–2023 (USD)
TABLE 11 ROLE OF COMPANIES IN BATTERY TIC ECOSYSTEM
TABLE 12 NUMBERS OF PATENTS GRANTED AND APPLIED, 2014–2023
TABLE 13 LIST OF PATENTS, 2014–2023
TABLE 14 EXPORT DATA FOR HS CODE 8507-COMPLIANT PRODUCTS, BY COUNTRY, 2019–2023 (USD MILLION)
TABLE 15 IMPORT DATA FOR HS CODE 8507-COMPLIANT PRODUCTS, BY COUNTRY, 2019–2023 (USD MILLION)
TABLE 16 LIST OF KEY CONFERENCES AND EVENTS, 2024–2025
TABLE 17 NORTH AMERICA: LIST OF REGULATORY BODIES, GOVERNMENT AGENCIES, AND OTHER ORGANIZATIONS
TABLE 18 EUROPE: LIST OF REGULATORY BODIES, GOVERNMENT AGENCIES, AND OTHER ORGANIZATIONS
TABLE 19 ASIA PACIFIC: LIST OF REGULATORY BODIES, GOVERNMENT AGENCIES, AND OTHER ORGANIZATIONS
TABLE 20 ROW: LIST OF REGULATORY BODIES, GOVERNMENT AGENCIES, AND OTHER ORGANIZATIONS
TABLE 21 PORTER’S FIVE FORCES ANALYSIS
TABLE 22 INFLUENCE OF STAKEHOLDERS ON BUYING PROCESS FOR TOP THREE APPLICATIONS (%)
TABLE 23 KEY BUYING CRITERIA FOR TOP THREE APPLICATIONS
TABLE 24 BATTERY TIC MARKET, BY STANDARD AND CERTIFICATION TYPE, 2020–2023 (USD MILLION)
TABLE 25 BATTERY TIC MARKET, BY STANDARD AND CERTIFICATION TYPE, 2024–2029 (USD MILLION)
TABLE 26 SAFETY TESTING STANDARDS FOR LITHIUM-ION BATTERIES
TABLE 27 SAFETY TESTING STANDARDS FOR LEAD–ACID BATTERIES
TABLE 28 SAFETY TESTING STANDARDS FOR NICKEL–METAL HYDRIDE BATTERIES
TABLE 29 BATTERY TIC MARKET, BY BATTERY TYPE, 2020–2023 (USD MILLION)
TABLE 30 BATTERY TIC MARKET, BY BATTERY TYPE, 2024–2029 (USD MILLION)
TABLE 31 LITHIUM-ION: BATTERY TIC MARKET, BY APPLICATION, 2020–2023 (USD MILLION)
TABLE 32 LITHIUM-ION: BATTERY TIC MARKET, BY APPLICATION, 2024–2029 (USD MILLION)
TABLE 33 LITHIUM-ION: BATTERY TIC MARKET, BY APPLICATION, 2020–2023 (GWH)
TABLE 34 LITHIUM-ION: BATTERY TIC MARKET, BY APPLICATION, 2024–2029 (GWH)
TABLE 35 LITHIUM-ION: BATTERY TIC MARKET, BY REGION, 2020–2023 (USD MILLION)
TABLE 36 LITHIUM-ION: BATTERY TIC MARKET, BY REGION, 2024–2029 (USD MILLION)
TABLE 37 LITHIUM-ION: BATTERY TIC MARKET IN NORTH AMERICA, BY COUNTRY, 2020–2023 (USD MILLION)
TABLE 38 LITHIUM-ION: BATTERY TIC MARKET IN NORTH AMERICA, BY COUNTRY, 2024–2029 (USD MILLION)
TABLE 39 LITHIUM-ION: BATTERY TIC MARKET IN EUROPE, BY COUNTRY, 2020–2023 (USD MILLION)
TABLE 40 LITHIUM-ION: BATTERY TIC MARKET IN EUROPE, BY COUNTRY, 2024–2029 (USD MILLION)
TABLE 41 LITHIUM-ION: BATTERY TIC MARKET IN ASIA PACIFIC, BY COUNTRY, 2020–2023 (USD MILLION)
TABLE 42 LITHIUM-ION: BATTERY TIC MARKET IN ASIA PACIFIC, BY COUNTRY, 2024–2029 (USD MILLION)
TABLE 43 LITHIUM-ION: BATTERY TIC MARKET IN ROW, BY REGION, 2020–2023 (USD MILLION)
TABLE 44 LITHIUM-ION: BATTERY TIC MARKET IN ROW, BY REGION, 2024–2029 (USD MILLION)
TABLE 45 LEAD–ACID: BATTERY TIC MARKET, BY APPLICATION, 2020–2023 (USD MILLION)
TABLE 46 LEAD–ACID: BATTERY TIC MARKET, BY APPLICATION, 2024–2029 (USD MILLION)
TABLE 47 LEAD–ACID: BATTERY TIC MARKET, BY REGION, 2020–2023 (USD MILLION)
TABLE 48 LEAD–ACID: BATTERY TIC MARKET, BY REGION, 2024–2029 (USD MILLION)
TABLE 49 LEAD–ACID: BATTERY TIC MARKET IN NORTH AMERICA, BY COUNTRY, 2020–2023 (USD MILLION)
TABLE 50 LEAD–ACID: BATTERY TIC MARKET IN NORTH AMERICA, BY COUNTRY, 2024–2029 (USD MILLION)
TABLE 51 LEAD–ACID: BATTERY TIC MARKET IN EUROPE, BY COUNTRY, 2020–2023 (USD MILLION)
TABLE 52 LEAD–ACID: BATTERY TIC MARKET IN EUROPE, BY COUNTRY, 2024–2029 (USD MILLION)
TABLE 53 LEAD–ACID: BATTERY TIC MARKET IN ASIA PACIFIC, BY COUNTRY, 2020–2023 (USD MILLION)
TABLE 54 LEAD–ACID: BATTERY TIC MARKET IN ASIA PACIFIC, BY COUNTRY, 2024–2029 (USD MILLION)
TABLE 55 LEAD–ACID: BATTERY TIC MARKET IN ROW, BY REGION, 2020–2023 (USD MILLION)
TABLE 56 LEAD–ACID: BATTERY TIC MARKET IN ROW, BY REGION, 2024–2029 (USD MILLION)
TABLE 57 NICKEL–METAL HYDRIDE: BATTERY TIC MARKET, BY APPLICATION, 2020–2023 (USD MILLION)
TABLE 58 NICKEL–METAL HYDRIDE: BATTERY TIC MARKET, BY APPLICATION, 2024–2029 (USD MILLION)
TABLE 59 NICKEL–METAL HYDRIDE: BATTERY TIC MARKET, BY REGION, 2020–2023 (USD MILLION)
TABLE 60 NICKEL–METAL HYDRIDE: BATTERY TIC MARKET, BY REGION, 2024–2029 (USD MILLION)
TABLE 61 NICKEL–METAL HYDRIDE: BATTERY TIC MARKET IN NORTH AMERICA, BY COUNTRY, 2020–2023 (USD MILLION)
TABLE 62 NICKEL–METAL HYDRIDE: BATTERY TIC MARKET IN NORTH AMERICA, BY COUNTRY, 2024–2029 (USD MILLION)
TABLE 63 NICKEL–METAL HYDRIDE: BATTERY TIC MARKET IN EUROPE, BY COUNTRY, 2020–2023 (USD MILLION)
TABLE 64 NICKEL–METAL HYDRIDE: BATTERY TIC MARKET IN EUROPE, BY COUNTRY, 2024–2029 (USD MILLION)
TABLE 65 NICKEL–METAL HYDRIDE: BATTERY TIC MARKET IN ASIA PACIFIC, BY COUNTRY, 2020–2023 (USD MILLION)
TABLE 66 NICKEL–METAL HYDRIDE: BATTERY TIC MARKET IN ASIA PACIFIC, BY COUNTRY, 2024–2029 (USD MILLION)
TABLE 67 NICKEL–METAL HYDRIDE: BATTERY TIC MARKET IN ROW, BY REGION, 2020–2023 (USD MILLION)
TABLE 68 NICKEL–METAL HYDRIDE: BATTERY TIC MARKET IN ROW, BY REGION, 2024–2029 (USD MILLION)
TABLE 69 OTHER BATTERY TYPES: BATTERY TIC MARKET, BY APPLICATION, 2020–2023, (USD MILLION)
TABLE 70 OTHER BATTERY TYPES: BATTERY TIC MARKET, BY APPLICATION, 2024–2029 (USD MILLION)
TABLE 71 OTHER BATTERY TYPES: BATTERY TIC MARKET, BY REGION, 2020–2023 (USD MILLION)
TABLE 72 OTHER BATTERY TYPES: BATTERY TIC MARKET, BY REGION, 2024–2029 (USD MILLION)
TABLE 73 OTHER BATTERY TYPES: BATTERY TIC MARKET IN NORTH AMERICA, BY COUNTRY, 2020–2023 (USD MILLION)
TABLE 74 OTHER BATTERY TYPES: BATTERY TIC MARKET IN NORTH AMERICA, BY COUNTRY, 2024–2029 (USD MILLION)
TABLE 75 OTHER BATTERY TYPES: BATTERY TIC MARKET IN EUROPE, BY COUNTRY, 2020–2023 (USD MILLION)
TABLE 76 OTHER BATTERY TYPES: BATTERY TIC MARKET IN EUROPE, BY COUNTRY, 2024–2029 (USD MILLION)
TABLE 77 OTHER BATTERY TYPES: BATTERY TIC MARKET IN ASIA PACIFIC, BY COUNTRY, 2020–2023 (USD MILLION)
TABLE 78 OTHER BATTERY TYPES: BATTERY TIC MARKET IN ASIA PACIFIC, BY COUNTRY, 2024–2029 (USD MILLION)
TABLE 79 OTHER BATTERY TYPES: BATTERY TIC MARKET IN ROW, BY REGION, 2020–2023 (USD MILLION)
TABLE 80 OTHER BATTERY TYPES: BATTERY TIC MARKET IN ROW, BY REGION, 2024–2029 (USD MILLION)
TABLE 81 BATTERY TIC MARKET, BY APPLICATION, 2020–2023 (USD MILLION)
TABLE 82 BATTERY TIC MARKET, BY APPLICATION, 2024–2029 (USD MILLION)
TABLE 83 ELECTRIC VEHICLES (EVS): BATTERY TIC MARKET, BY BATTERY TYPE, 2020–2023 (USD MILLION)
TABLE 84 ELECTRIC VEHICLES (EVS): BATTERY TIC MARKET, BY BATTERY TYPE, 2024–2029 (USD MILLION)
TABLE 85 ICE VEHICLES: TIC MARKET, BY BATTERY TYPE, 2020–2023 (USD MILLION)
TABLE 86 ICE VEHICLES: BATTERY TIC MARKET, BY BATTERY TYPE, 2024–2029 (USD MILLION)
TABLE 87 CONSUMER ELECTRONICS: BATTERY TIC MARKET, BY BATTERY TYPE, 2020–2023 (USD MILLION)
TABLE 88 CONSUMER ELECTRONICS: BATTERY TIC MARKET, BY BATTERY TYPE, 2024–2029 (USD MILLION)
TABLE 89 INDUSTRIAL EQUIPMENT: BATTERY TIC MARKET, BY BATTERY TYPE, 2020–2023 (USD MILLION)
TABLE 90 INDUSTRIAL EQUIPMENT: BATTERY TIC MARKET, BY BATTERY TYPE, 2024–2029 (USD MILLION)
TABLE 91 MEDICAL DEVICES: BATTERY TIC MARKET, BY BATTERY TYPE, 2020–2023 (USD MILLION)
TABLE 92 MEDICAL DEVICES: BATTERY TIC MARKET, BY BATTERY TYPE, 2024–2029 (USD MILLION)
TABLE 93 OTHER APPLICATIONS: BATTERY TIC MARKET, BY BATTERY TYPE, 2020–2023 (USD MILLION)
TABLE 94 OTHER APPLICATIONS: BATTERY TIC MARKET, BY BATTERY TYPE, 2024–2029 (USD MILLION)
TABLE 95 BATTERY TIC MARKET, BY SERVICE TYPE, 2020–2023 (USD MILLION)
TABLE 96 BATTERY TIC MARKET, BY SERVICE TYPE, 2024–2029 (USD MILLION)
TABLE 97 BATTERY TIC MARKET, BY REGION, 2020–2023 (USD MILLION)
TABLE 98 BATTERY TIC MARKET, BY REGION, 2024–2029 (USD MILLION)
TABLE 99 NORTH AMERICA: BATTERY TIC MARKET, BY COUNTRY, 2020–2023 (USD MILLION)
TABLE 100 NORTH AMERICA: BATTERY TIC MARKET, BY COUNTRY, 2024–2029 (USD MILLION)
TABLE 101 NORTH AMERICA: BATTERY TIC MARKET, BY BATTERY TYPE, 2020–2023 (USD MILLION)
TABLE 102 NORTH AMERICA: BATTERY TIC MARKET, BY BATTERY TYPE, 2024–2029 (USD MILLION)
TABLE 103 US: BATTERY TIC MARKET, BY BATTERY TYPE, 2020–2023 (USD MILLION)
TABLE 104 US: BATTERY TIC MARKET, BY BATTERY TYPE, 2024–2029 (USD MILLION)
TABLE 105 CANADA: BATTERY TIC MARKET, BY BATTERY TYPE, 2020–2023 (USD MILLION)
TABLE 106 CANADA: BATTERY TIC MARKET, BY BATTERY TYPE, 2024–2029 (USD MILLION)
TABLE 107 MEXICO: BATTERY TIC MARKET, BY BATTERY TYPE, 2020–2023 (USD MILLION )
TABLE 108 MEXICO: BATTERY TIC MARKET, BY BATTERY TYPE, 2024–2029 (USD MILLION)
TABLE 109 EUROPE: BATTERY TIC MARKET, BY COUNTRY, 2020–2023 (USD MILLION)
TABLE 110 EUROPE: BATTERY TIC MARKET, BY COUNTRY, 2024–2029 (USD MILLION)
TABLE 111 EUROPE: BATTERY TIC MARKET, BY BATTERY TYPE, 2020–2023 (USD MILLION)
TABLE 112 EUROPE: BATTERY TIC MARKET, BY BATTERY TYPE, 2024–2029 (USD MILLION)
TABLE 113 UK: BATTERY TIC MARKET, BY BATTERY TYPE, 2020–2023 (USD MILLION)
TABLE 114 UK: BATTERY TIC MARKET, BY BATTERY TYPE, 2024–2029 (USD MILLION)
TABLE 115 GERMANY: BATTERY TIC MARKET, BY BATTERY TYPE, 2020–2023 (USD MILLION)
TABLE 116 GERMANY: BATTERY TIC MARKET, BY BATTERY TYPE, 2024–2029 (USD MILLION)
TABLE 117 FRANCE: BATTERY TIC MARKET, BY BATTERY TYPE, 2020–2023 (USD MILLION)
TABLE 118 FRANCE: BATTERY TIC MARKET, BY BATTERY TYPE, 2024–2029 (USD MILLION)
TABLE 119 REST OF EUROPE: BATTERY TIC MARKET, BY BATTERY TYPE, 2020–2023 (USD MILLION )
TABLE 120 REST OF EUROPE: BATTERY TIC MARKET, BY BATTERY TYPE, 2024–2029 (USD MILLION)
TABLE 121 ASIA PACIFIC: BATTERY TIC MARKET, BY COUNTRY, 2020–2023 (USD MILLION)
TABLE 122 ASIA PACIFIC: BATTERY TIC MARKET, BY COUNTRY, 2024–2029 (USD MILLION)
TABLE 123 ASIA PACIFIC: BATTERY TIC MARKET, BY BATTERY TYPE, 2020–2023 (USD MILLION)
TABLE 124 ASIA PACIFIC: BATTERY TIC MARKET, BY BATTERY TYPE, 2024–2029 (USD MILLION)
TABLE 125 CHINA: BATTERY TIC MARKET, BY BATTERY TYPE, 2020–2023 (USD MILLION)
TABLE 126 CHINA: BATTERY TIC MARKET, BY BATTERY TYPE, 2024–2029 (USD MILLION)
TABLE 127 JAPAN: BATTERY TIC MARKET, BY BATTERY TYPE, 2020–2023 (USD MILLION )
TABLE 128 JAPAN: BATTERY TIC MARKET, BY BATTERY TYPE, 2024–2029 (USD MILLION)
TABLE 129 SOUTH KOREA: BATTERY TIC MARKET, BY BATTERY TYPE, 2020–2023 (USD MILLION )
TABLE 130 SOUTH KOREA: BATTERY TIC MARKET, BY BATTERY TYPE, 2024–2029 (USD MILLION)
TABLE 131 REST OF ASIA PACIFIC: BATTERY TIC MARKET, BY BATTERY TYPE, 2020–2023 (USD MILLION)
TABLE 132 REST OF ASIA PACIFIC: BATTERY TIC MARKET, BY BATTERY TYPE, 2024–2029 (USD MILLION)
TABLE 133 ROW: BATTERY TIC MARKET, BY REGION, 2020–2023 (USD MILLION)
TABLE 134 ROW: BATTERY TIC MARKET, BY REGION, 2024–2029 (USD MILLION)
TABLE 135 ROW: BATTERY TIC MARKET, BY BATTERY TYPE, 2020–2023 (USD MILLION)
TABLE 136 ROW: BATTERY TIC MARKET, BY BATTERY TYPE, 2024–2029 (USD MILLION)
TABLE 137 SOUTH AMERICA: BATTERY TIC MARKET, BY BATTERY TYPE, 2020–2023 (USD MILLION )
TABLE 138 SOUTH AMERICA: BATTERY TIC MARKET, BY BATTERY TYPE, 2024–2029 (USD MILLION)
TABLE 139 MIDDLE EAST: BATTERY TIC MARKET, BY COUNTRY, 2020–2023 (USD MILLION)
TABLE 140 MIDDLE EAST: BATTERY TIC MARKET, BY COUNTRY, 2024–2029 (USD MILLION)
TABLE 141 MIDDLE EAST: BATTERY TIC MARKET, BY BATTERY TYPE, 2020–2023 (USD MILLION)
TABLE 142 MIDDLE EAST: BATTERY TIC MARKET, BY BATTERY TYPE, 2024–2029 (USD MILLION)
TABLE 143 AFRICA: BATTERY TIC MARKET, BY BATTERY TYPE, 2020–2023 (USD MILLION )
TABLE 144 AFRICA: BATTERY TIC MARKET, BY BATTERY TYPE, 2024–2029 (USD MILLION)
TABLE 145 BATTERY TIC MARKET: OVERVIEW OF STRATEGIES ADOPTED BY KEY PLAYERS, 2020–2023
TABLE 146 BATTERY TIC MARKET SHARE ANALYSIS, 2023
TABLE 147 BATTERY TIC MARKET: STANDARD AND CERTIFICATION TYPE FOOTPRINT
TABLE 148 BATTERY TIC MARKET: BATTERY TYPE FOOTPRINT
TABLE 149 BATTERY TIC MARKET: SERVICE TYPE FOOTPRINT
TABLE 150 BATTERY TIC MARKET: APPLICATION FOOTPRINT
TABLE 151 BATTERY TIC MARKET: REGION FOOTPRINT
TABLE 152 BATTERY TIC MARKET: DETAILED LIST OF KEY START-UPS/SMES
TABLE 153 BATTERY TIC MARKET: COMPETITIVE BENCHMARKING OF KEY START-UPS/SMES
TABLE 154 BATTERY TIC MARKET: SERVICE LAUNCHES, JANUARY 2020–MAY 2024
TABLE 155 BATTERY TIC MARKET: DEALS, JANUARY 2020–MAY 2024
TABLE 156 BATTERY TIC MARKET: EXPANSIONS, JANUARY 2020–MAY 2024
TABLE 157 UL LLC: COMPANY OVERVIEW
TABLE 158 UL LLC: SERVICES OFFERED
TABLE 159 UL LCC: SERVICE LAUNCHES
TABLE 160 UL LLC: DEALS
TABLE 161 UL LLC: EXPANSIONS
TABLE 162 SGS SA: COMPANY OVERVIEW
TABLE 163 SGS SA: SERVICES OFFERED
TABLE 164 SGS SA: DEALS
TABLE 165 SGS SA: EXPANSIONS
TABLE 166 INTERTEK GROUP PLC: COMPANY OVERVIEW
TABLE 167 INTERTEK GROUP PLC: SERVICES OFFERED
TABLE 168 INTERTEK GROUP PLC: DEALS
TABLE 169 INTERTEK GROUP PLC: EXPANSIONS
TABLE 170 BUREAU VERITAS: COMPANY OVERVIEW
TABLE 171 BUREAU VERITAS: SERVICES OFFERED
TABLE 172 BUREAU VERITAS: DEALS
TABLE 173 DEKRA: COMPANY OVERVIEW
TABLE 174 DEKRA: SERVICES OFFERED
TABLE 175 DEKRA: SERVICE LAUNCHES
TABLE 176 DEKRA: EXPANSIONS
TABLE 177 TÜV NORD GROUP: COMPANY OVERVIEW
TABLE 178 TÜV NORD GROUP: SERVICES OFFERED
TABLE 179 DNV GL: COMPANY OVERVIEW
TABLE 180 DNV GL: SERVICES OFFERED
TABLE 181 EUROFINS SCIENTIFIC: COMPANY OVERVIEW
TABLE 182 EUROFINS SCIENTIFIC: SERVICES OFFERED
TABLE 183 EUROFINS SCIENTIFIC: SERVICE LAUNCHES
TABLE 184 EUROFINS SCIENTIFIC: EXPANSIONS
TABLE 185 TÜV RHEINLAND: COMPANY OVERVIEW
TABLE 186 TÜV RHEINLAND: SERVICES OFFERED
TABLE 187 TÜV RHEINLAND: SERVICE LAUNCHES
TABLE 188 TÜV RHEINLAND: EXPANSIONS
TABLE 189 TÜV SÜD: COMPANY OVERVIEW
TABLE 190 TÜV SÜD: SERVICES OFFERED
TABLE 191 TÜV SÜD: DEALS
TABLE 192 TÜV SÜD: EXPANSIONS
 
 
LIST OF FIGURES (69 FIGURES)
 
FIGURE 1 BATTERY TIC MARKET SEGMENTATION
FIGURE 2 BATTERY TIC MARKET: RESEARCH DESIGN
FIGURE 3 BOTTOM-UP APPROACH
FIGURE 4 TOP-DOWN APPROACH
FIGURE 5 MARKET SIZE ESTIMATION: DEMAND-SIDE ANALYSIS
FIGURE 6 MARKET SIZE ESTIMATION: SUPPLY-SIDE ANALYSIS
FIGURE 7 DATA TRIANGULATION
FIGURE 8 BATTERY TIC MARKET: GLOBAL SNAPSHOT, 2020–2029
FIGURE 9 SAFETY TESTING SEGMENT TO ACCOUNT FOR MAJORITY OF MARKET SHARE THROUGHOUT FORECAST PERIOD
FIGURE 10 LITHIUM-ION BATTERIES TO COMMAND BATTERY TIC MARKET THROUGHOUT FORECAST PERIOD
FIGURE 11 TESTING SEGMENT TO ACCOUNT FOR LARGEST SHARE OF BATTERY TIC MARKET THROUGHOUT FORECAST PERIOD
FIGURE 12 ELECTRIC VEHICLES TO LEAD BATTERY TIC MARKET THROUGHOUT FORECAST PERIOD
FIGURE 13 ASIA PACIFIC HELD LARGEST SHARE OF GLOBAL BATTERY TIC MARKET IN 2023
FIGURE 14 NEED TO COMPLY WITH STRINGENT REGULATORY REQUIREMENTS AND SAFETY STANDARDS TO DRIVE MARKET
FIGURE 15 SAFETY TESTING SEGMENT TO HOLD LARGEST MARKET SHARE IN 2024
FIGURE 16 LITHIUM-ION SEGMENT TO ACCOUNT FOR LARGEST SHARE OF BATTERY TIC MARKET IN 2024
FIGURE 17 TESTING SEGMENT TO CAPTURE LARGEST MARKET SHARE IN 2024
FIGURE 18 ELECTRIC VEHICLES (EVS) SEGMENT TO ACCOUNT FOR LARGEST SHARE OF BATTERY TIC MARKET IN 2024
FIGURE 19 LITHIUM-ION BATTERIES AND CHINA HELD LARGEST SHARE OF ASIA PACIFIC MARKET IN 2023
FIGURE 20 BATTERY TIC MARKET: DRIVERS, RESTRAINTS, OPPORTUNITIES, AND CHALLENGES
FIGURE 21 GLOBAL ELECTRIC VEHICLE SALES, 2021–2023 (MILLION UNITS)
FIGURE 22 IMPACT ANALYSIS: DRIVERS
FIGURE 23 IMPACT ANALYSIS: RESTRAINTS
FIGURE 24 IMPACT ANALYSIS: OPPORTUNITIES
FIGURE 25 IMPACT ANALYSIS: CHALLENGES
FIGURE 26 TRENDS/DISRUPTIONS IMPACTING CUSTOMERS’ BUSINESSES
FIGURE 27 INDICATIVE PRICING TREND OF BATTERY CERTIFICATIONS (USD)
FIGURE 28 INDICATIVE PRICING TREND OF IEC BATTERY CERTIFICATIONS, BY REGION, 2021–2023 (USD)
FIGURE 29 SUPPLY CHAIN ANALYSIS
FIGURE 30 BATTERY TIC ECOSYSTEM
FIGURE 31 INVESTMENT AND FUNDING SCENARIO, EV BATTERIES
FIGURE 32 PATENTS APPLIED AND GRANTED, 2014–2023
FIGURE 33 EXPORT DATA FOR HS CODE 8507-COMPLIANT PRODUCTS, BY COUNTRY, 2019–2023 (USD MILLION)
FIGURE 34 IMPORT DATA FOR HS CODE 8507-COMPLIANT PRODUCTS, BY COUNTRY, 2019–2023
FIGURE 35 BATTERY TIC MARKET: PORTER’S FIVE FORCES ANALYSIS
FIGURE 36 PORTER’S FIVE FORCES: WEIGHTED AVERAGE
FIGURE 37 INFLUENCE OF STAKEHOLDERS ON BUYING PROCESS FOR TOP THREE APPLICATIONS
FIGURE 38 KEY BUYING CRITERIA FOR TOP THREE APPLICATIONS
FIGURE 39 SAFETY TESTING TO ACCOUNT FOR LARGEST SHARE OF BATTERY TIC MARKET, BY STANDARD AND CERTIFICATION TYPE, IN 2029
FIGURE 40 LITHIUM-ION SEGMENT TO LEAD BATTERY TIC MARKET THROUGHOUT FORECAST PERIOD
FIGURE 41 ELECTRIC VEHICLES (EVS) SEGMENT TO COMMAND TIC MARKET FOR LITHIUM-ION BATTERIES FROM 2024 TO 2029
FIGURE 42 ICE VEHICLES TO ACCOUNT FOR LARGEST SHARE OF LEAD–ACID BATTERY TIC MARKET IN 2029
FIGURE 43 ELECTRIC VEHICLES (EVS) SEGMENT TO CAPTURE LARGEST SHARE OF NICKEL–METAL HYDRIDE TIC MARKET IN 2029
FIGURE 44 INDUSTRIAL EQUIPMENT APPLICATIONS TO HOLD LARGEST MARKET SHARE FOR OTHER BATTERY TYPES IN 2029
FIGURE 45 ELECTRIC VEHICLES (EVS) SEGMENT TO DOMINATE BATTERY TIC MARKET THROUGHOUT FORECAST PERIOD
FIGURE 46 LITHIUM-ION BATTERIES TO ACCOUNT FOR LARGEST MARKET SHARE FOR EVS IN 2029
FIGURE 47 LEAD–ACID BATTERIES TO CAPTURE MOST SIGNIFICANT MARKET SHARE FOR INDUSTRIAL EQUIPMENT APPLICATIONS THROUGHOUT FORECAST PERIOD
FIGURE 48 TESTING SERVICES TO ACCOUNT FOR LARGEST MARKET SHARE THROUGHOUT FORECAST PERIOD
FIGURE 49 GERMANY TO REGISTER HIGHEST CAGR IN GLOBAL BATTERY TIC MARKET DURING FORECAST PERIOD
FIGURE 50 NORTH AMERICA: BATTERY TIC MARKET SNAPSHOT
FIGURE 51 EUROPE: BATTERY TIC MARKET SNAPSHOT
FIGURE 52 ASIA PACIFIC: BATTERY TIC MARKET SNAPSHOT
FIGURE 53 BATTERY TIC MARKET SHARE ANALYSIS, 2023
FIGURE 54 COMPANY VALUATION, 2024 (USD BILLION)
FIGURE 55 FINANCIAL METRICS, 2024
FIGURE 56 BRAND/PRODUCT COMPARISON
FIGURE 57 REVENUE ANALYSIS OF FIVE KEY PLAYERS, 2021–2023 (USD BILLION)
FIGURE 58 BATTERY TIC MARKET: COMPANY EVALUATION MATRIX (KEY PLAYERS), 2023
FIGURE 59 BATTERY TIC MARKET: COMPANY FOOTPRINT
FIGURE 60 BATTERY TIC MARKET: COMPANY EVALUATION MATRIX (START-UPS/SMES), 2023
FIGURE 61 SGS SA: COMPANY SNAPSHOT
FIGURE 62 INTERTEK GROUP PLC: COMPANY SNAPSHOT
FIGURE 63 BUREAU VERITAS: COMPANY SNAPSHOT
FIGURE 64 DEKRA: COMPANY SNAPSHOT
FIGURE 65 TÜV NORD GROUP: COMPANY SNAPSHOT
FIGURE 66 DNV GL: COMPANY SNAPSHOT
FIGURE 67 EUROFINS SCIENTIFIC: COMPANY SNAPSHOT
FIGURE 68 TÜV RHEINLAND: COMPANY SNAPSHOT
FIGURE 69 TÜV SÜD: COMPANY SNAPSHOT


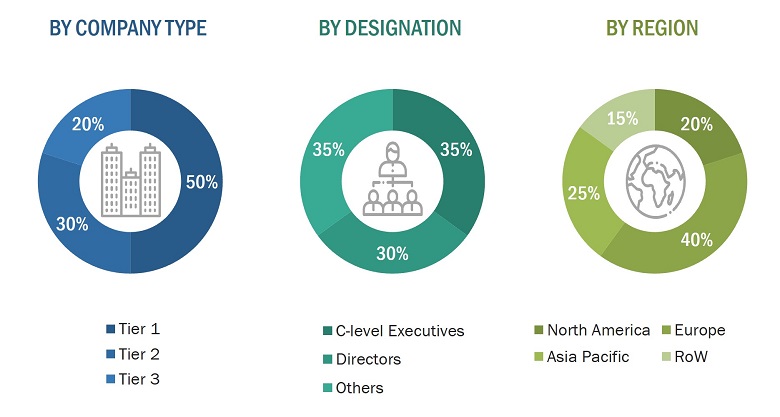
The research study involved 4 major activities in estimating the size of the battery TIC market. Exhaustive secondary research has been done to collect important information about the market and peer markets. The validation of these findings, assumptions, and sizing with the help of primary research with industry experts across the value chain has been the next step. Both top-down and bottom-up approaches have been used to estimate the market size. Post which the market breakdown and data triangulation have been adopted to estimate the market sizes of segments and sub-segments.

Secondary Research

In secondary research, various secondary sources have been referred to for obtaining the information that was needed for the study. Various secondary sources that were used for the research include, corporate filings such as annual reports, press releases, investor presentations, and financial statements, trade, business, and professional associations, whitepapers, journals, certified publications, and articles from recognized authors and databases.

In the battery TIC market report, the top-down as well as the bottom-up approaches have been used for the estimation of the global market size, along with several other dependent submarkets. The major players in the market were identified with the help of extensive secondary research and their presence in the market was determined using secondary and primary research. All the percentage shares, splits, and breakdowns have been determined using secondary sources and verified through primary sources.

Primary Research

Extensive primary research has been conducted after understanding the battery testing, inspection, and certification market scenario through secondary research. Several primary interviews have been conducted with key opinion leaders from both demand- and supply-side vendors across 4 major regions— North America, Europe, Asia Pacific, and the Rest of the World. Approximately 25% of the primary interviews have been conducted with the demand-side vendors and 75% with the supply-side vendors. Primary data has been collected mainly through telephonic interviews, which consist of 80% of the total primary interviews; questionnaires and emails have also been used to collect the data.

After successful interaction with industry experts, brief sessions were conducted with highly experienced independent consultants to reinforce the findings of our primary research. This, along with the in-house subject matter experts’ opinions, has led us to the findings as described in the report.
Battery Testing, Inspection, and Certification Market
 Size, and Share

To know about the assumptions considered for the study, download the pdf brochure

Market Size Estimation

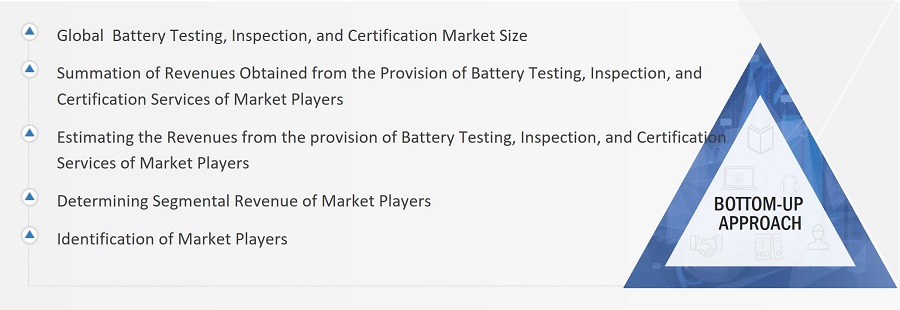
In the market engineering process, both top-down and bottom-up approaches along with data triangulation methods have been used to estimate and validate the size of the battery testing, inspection, and certification market and other dependent submarkets. The research methodology used to estimate the market sizes includes the following:

  • Identifying top-line investments and spending in the ecosystem and considering segment-level splits and major market developments
  • Identifying different stakeholders in the battery testing, inspection, and certification market that influence the entire market, along with participants across the supply chain
  • Analyzing major providers of TIC service providers for battery products, as well as studying their service portfolios
  • Analyzing trends related to the adoption of battery TIC services
  • Tracking recent and upcoming market developments, including investments, R&D activities, product launches, collaborations, mergers and acquisitions, and partnerships, as well as forecasting the market size based on these developments and other critical parameters
  • Carrying out multiple discussions with key opinion leaders to identify the adoption trends of battery testing, inspection, and certification services in different applications
  • Segmenting the overall market into various other market segments
  • Validating the estimates at every level through discussions with key opinion leaders, such as chief executives (CXOs), directors, and operation managers, and finally with the domain experts at MarketsandMarkets

Market Size Estimation Methodology-Bottom-up Approach
Battery Testing, Inspection, and Certification Market
 Size, and Bottom-up Approach

Market Size Estimation Methodology-Top-Down Approach

Battery Testing, Inspection, and Certification Market
 Size, and Top-Down Approach

Data Triangulation

After arriving at the overall market size through the market size estimation process explained in the earlier section, the overall battery testing, inspection, and certification market has been divided into several segments and subsegments. To complete the overall market engineering process and arrive at the exact statistics for all segments, the data triangulation and market breakdown procedures have been used, wherever applicable. The data has been triangulated by studying various factors and trends from both the demand and supply side perspectives. Along with data triangulation and market breakdown, the market has been validated by top-down and bottom-up approaches.

Market Definition

The Battery Testing, Inspection, and Certification (TIC) Market encompasses the range of services and processes involved in evaluating and verifying the performance, safety, and compliance of battery products. This market involves rigorous testing against factors such as electrical performance, safety standards, environmental impact, and lifecycle of batteries, among others. These are important services in the achievement of batteries that are regulatory standard-compliant and benchmarked against industry standards to ensure that they are safe for their reliable performance in applications such as EV, consumer electronics, and ESS.

The TIC market acts as a promoter in technological innovation and consumer safety. TIC services are made use of to provide complete testing and certification so that the growth of the battery industry occurs sustainably. With their accredited and testing-based TIC services, the TIC providers help innovation by battery manufacturers about product development while adhering to strict safety and performance standards. It is therefore expected that the role of robust TIC services will become even more pronounced with surging demand for batteries, especially from rapidly growing electric vehicle (EV) and energy storage systenESS markets, throughout the overall growth and reliability in battery market.

Key Stakeholders

  • Suppliers of Raw Materials and Manufacturing Equipment
  • Battery Manufacturers
  • Battery Testing, Inspection, and Certification Service Providers
  • End-Product Manufacturers
  • Battery Technology Developers
  • Research and Development Organizations
  • Standard Organizations, Forums, and Associations
  • Regulatory Bodies and Government Agencies
  • Governments, financial institutions, and investment communities
  • Analysts and strategic business planners

The main objectives of this study are as follows:

  • To define, describe, and forecast the battery testing, inspection, and certification (TIC) market by standard and certification type, battery type, application, service type, and region, in terms of value
  • To describe and forecast the market size for various segments with respect to four main regions: North America, Europe, Asia Pacific, and Rest of the World (RoW), in terms of value
  • To forecast the market size for lithium-ion batteries, by application, in terms of capacity
  • To provide detailed information regarding the major drivers, restraints, opportunities, and challenges influencing the growth of the battery testing, inspection, and certification market
  • To study the complete supply chain and related industry segments for the battery TIC market
  • To strategically analyze the micromarkets1 with respect to individual growth trends, prospects, and contributions to the total market
  • To provide ecosystem analysis, trade analysis, case study analysis, patent analysis, technology analysis, pricing analysis, Porter’s five forces analysis, key stakeholders and buying criteria, key conferences and events, regulatory bodies, government agencies, and regulations pertaining to the market under study
  • To analyze opportunities in the market for various stakeholders by identifying high-growth segments of the market
  • To strategically profile the key players and comprehensively analyze their market position in terms of ranking and core competencies2, along with detailing the competitive landscape for the market leaders
  • To analyze competitive developments such as service launches, collaborations, mergers and acquisitions, agreements, partnerships, and expansion activities carried out by players in the battery testing, inspection, and certification market

Available Customizations:

With the given market data, MarketsandMarkets offers customizations according to the specific requirements of companies. The following customization options are available for the report:

Country-wise Information:

  • Country-wise breakdown for North America, Europe, Asia Pacific, and Rest of the World

Company Information:

  • Detailed analysis and profiling of additional market players (up to five)
Custom Market Research Services

We will customize the research for you, in case the report listed above does not meet with your exact requirements. Our custom research will comprehensively cover the business information you require to help you arrive at strategic and profitable business decisions.

Request Customization
Report Code
SE 9083
Published ON
Jul, 2024
Choose License Type
BUY NOW
  • SHARE
X
Request Customization
Speak to Analyst
Speak to Analyst
OR FACE-TO-FACE MEETING
PERSONALIZE THIS RESEARCH
  • Triangulate with your Own Data
  • Get Data as per your Format and Definition
  • Gain a Deeper Dive on a Specific Application, Geography, Customer or Competitor
  • Any level of Personalization
REQUEST A FREE CUSTOMIZATION
LET US HELP YOU!
  • What are the Known and Unknown Adjacencies Impacting the Battery Testing, Inspection, and Certification Market
  • What will your New Revenue Sources be?
  • Who will be your Top Customer; what will make them switch?
  • Defend your Market Share or Win Competitors
  • Get a Scorecard for Target Partners
CUSTOMIZED WORKSHOP REQUEST
  • Call Us
  • +1-888-600-6441 (Corporate office hours)
  • +1-888-600-6441 (US/Can toll free)
  • +44-800-368-9399 (UK office hours)
CONNECT WITH US
ABOUT TRUST ONLINE
©2024 MarketsandMarkets Research Private Ltd. All rights reserved
DMCA.com Protection Status
Website Feedback