Bio-Butadiene Market

Bio-Butadiene Market by Type (SBR, SBL, NBR, ABS, PB), Application (Synthetic Rubber, Fine Chemicals, Plastics), Grade (Industrial Grade), End-Use Industry (Automotive And Transportation, Chemical Processing), and Region - Global Forecast to 2029

Report Code: CH 9030 May, 2024, by marketsandmarkets.com

The Bio-butadiene market is projected to reach USD 94 million by 2029, at a CAGR of 10.1% from USD 58 million in 2024. The bio-butadiene market is driven by several key factors, including the growing emphasis on sustainability and environmental responsibility, which fuels demand for renewable and eco-friendly alternatives to petrochemical-based products. Regulatory pressures and government policies aimed at reducing carbon emissions and promoting the use of bio-based chemicals further boost the market. Technological advancements that enhance the efficiency and cost-effectiveness of bio-butadiene production are also crucial, making it a viable competitor to traditional butadiene. Additionally, the automotive industry's increasing demand for sustainable materials, particularly in tire manufacturing, and the volatility of fossil fuel markets prompting a shift towards more stable, renewable sources, significantly contribute to the growth of the bio-butadiene market.

Bio-Butadiene Market

To know about the assumptions considered for the study, Request for Free Sample Report

Attractive Opportunities in the Bio-Butadiene Market

Bio-Butadiene Market

Market Dynamics

Driver: Driving Forces Behind the Global Surge in Bio-Butadiene Demand are Regulatory Impact, Consumer Preferences, and Economic Advantages"

One key driver propelling the global bio-butadiene market is the increasing imposition of stringent environmental regulations and the advancement of sustainability initiatives by governments across the world. These regulations are designed to mitigate climate change impacts by decreasing greenhouse gas emissions and diminishing the dependency on finite fossil resources. Governments are implementing policies that encourage the development and integration of renewable materials, effectively catalyzing a shift away from traditional petrochemical derivatives.

Green Deale, the European Union, under its comprehensive climate strategies, including the European Green Deal, has set ambitious targets to reduce emissions and achieve climate neutrality by 2050. Such policies promote the use of sustainable and renewable resources, including bio-based chemicals like bio-butadiene. This regulatory landscape compels industries to revise their raw material sourcing strategies, transitioning from conventional butadiene, which is derived from crude oil and natural gas to bio-butadiene, which is produced from renewable biomass sources such as non-food crops and agricultural waste.

The automotive industry has been a significant adopter of bio-butadiene, utilizing it primarily in the production of synthetic rubbers for tires and various automotive components. This shift is not solely regulatory driven but is also influenced by consumer preferences. Modern consumers are increasingly environmentally conscious, seeking products that are sustainably sourced and manufactured. This consumer trend is pushing automotive manufacturers to prioritize sustainability across their supply chains, further amplifying the demand for bio-based materials.

Additionally, the inherent volatility in oil and gas markets often affects the price stability of petrochemicals, making the economics of sourcing petrochemically derived butadiene unpredictable. Bio-butadiene offers an attractive alternative due to potentially more stable pricing and supply, not directly tied to oil and gas market fluctuations.

Restraint: Technology and Infrastructure Challenges in Bio-Butadiene Production

Bio-butadiene production faces significant technological and infrastructure challenges that contribute to its high costs and limited scalability. One major issue is that the production processes for bio-butadiene are still in their early stages of development. Unlike petrochemical methods, which have been refined and optimized over decades, bio-butadiene technologies are relatively new and less efficient. For instance, biochemical conversion processes require multiple steps, including pretreatment of biomass, enzymatic hydrolysis, fermentation, and subsequent chemical conversion. Each of these steps is complex, often resulting in lower yields and higher energy consumption compared to the more straightforward process of cracking naphtha to produce butadiene in petrochemical plants.

Moreover, the infrastructure required for bio-butadiene production is not as well-developed as that for conventional petrochemical plants. Large-scale biomass processing and biorefining facilities are needed, but these are currently limited. Building and maintaining such infrastructure demands substantial capital investment. This includes the cost of constructing new facilities, developing supply chains for biomass feedstocks, and implementing technologies that can efficiently convert biomass into butadiene. Additionally, existing infrastructure for petrochemical production benefits from established logistics, economies of scale, and a mature market, which are yet to be realized in the bio-based sector.

The lack of optimized processes and the underdeveloped infrastructure mean that bio-butadiene producers face higher capital and operational expenditures. These costs are passed on to the end products, making bio-butadiene less competitive compared to its petrochemical counterpart. To overcome these challenges, significant investment in research and development is needed to improve process efficiencies and scalability. Additionally, government policies and incentives could help bridge the gap by supporting the development of bio-butadiene infrastructure and technologies.

Opportunity: The Role of Bio-Butadiene in Advancing Sustainable Automotive Manufacturing

The automotive industry is increasingly turning to bio-butadiene as a crucial component in the production of synthetic rubber for tires, driven by the growing demand for electric vehicles (EVs) and sustainable automotive components. As the world transitions towards a greener future, the need for eco-friendly materials in automotive manufacturing is becoming more pronounced. Bio-butadiene, a renewable alternative to traditional petroleum-based butadiene, offers a promising solution to meet these demands. Its application in synthetic rubber production is vital for EV tires, which face unique performance requirements due to higher torque and different weight distributions compared to traditional internal combustion engine vehicles.

The advantages of bio-butadiene extend beyond its environmental benefits. The production of bio-butadiene involves advanced biotechnological processes that convert renewable feedstocks into valuable industrial chemicals. These processes, which include fermentation and catalytic conversion, are becoming more efficient and cost-effective, due to continuous research and development. As a result, the scalability of bio-butadiene production is improving, making it a more viable option for large-scale industrial applications. Companies like Braskem, Genomatica, and Global Bioenergies are at the forefront of this technological innovation, investing heavily in the development and commercialization of bio-butadiene production methods.

Moreover, regulatory support plays a pivotal role in promoting the adoption of bio-based materials in the automotive industry. Governments worldwide are implementing policies that incentivize the use of renewable resources and penalize excessive carbon emissions. For instance, the European Union’s Green Deal and various state-level initiatives in the United States are pushing the automotive industry towards greater sustainability. These regulations create a favorable environment for the adoption of bio-butadiene, encouraging automakers to integrate sustainable practices into their manufacturing processes. The alignment of regulatory frameworks with environmental goals underscores the importance of bio-butadiene in the future of automotive manufacturing.

Challenge: Opportunities in the Bio-Butadiene Market Amid Increasing Demand for Sustainable Alternatives

One significant opportunity in the bio-butadiene market is driven by the increasing global emphasis on sustainability and the transition away from fossil fuels. Bio-butadiene, sourced from renewable materials like biomass or agricultural waste, presents a compelling alternative to its petroleum-based counterpart, commonly used in the production of synthetic rubbers, plastics, and latexes. As environmental regulations tighten and consumer preferences shift towards eco-friendly products, industries such as automotive, which uses synthetic rubber in tires, and construction, which utilizes plastics and adhesives, are under pressure to reduce their environmental footprints.

The transition to bio-butadiene not only helps companies comply with stringent environmental regulations but also aligns with growing consumer demand for sustainable products. Additionally, leveraging bio-based sources can potentially reduce dependency on volatile fossil fuel markets and enhance supply chain sustainability. This shift is bolstered by technological advancements and increased investment in biochemical research, making the production of bio-butadiene more efficient and cost-effective. Hence, companies investing in bio-butadiene production are well-positioned to capture market share in a rapidly evolving market prioritizing sustainability, ultimately driving growth in this sector.

Market Ecosystem

The market ecosystem for Bio-butadiene is composed of a diverse array of entities and stakeholders that collectively contribute to the development, implementation, and advancement of Bio-butadiene materials. At the core of this ecosystem are material providers who focus on research, development, and manufacturing of electronic wet chemicals. They continuously innovate and produce novel materials and their applications to meet the evolving demands of the market.

The key players in this market are SABIC (Saudi Arabia), Michelin (France), Zeon Corporation (Japan), Biokemik (Spain), ETB Catalytic Technologies (Netherlands), Trinseo (US), Genomatica (US), Braskem (Brazil), Versalis (Italy), Synthos (Poland), Lummus Technology (US), INVISTA (US), LanzaTech (US), Michelin (France), IFPEN (France), Zeon Corporation (Japan), Global Bioenergies (France), Evonik Industries (Germany), Axens (France) etc.

Bio-Butadiene Market: Ecosystem

Bio-Butadiene Market Ecosystem

Source: Secondary Research, Interviews with Experts, and MarketsandMarkets Analysis

"Styrene-butadiene rubber is the largest sub-segment amongst the type segment in the Bio-butadiene market in 2024, in terms of value."

Styrene Butadiene Rubber (SBR) holds the position as the largest segment in the bio-butadiene market due to several key factors. Firstly, SBR is widely used in various industries such as automotive, construction, and consumer goods for its versatile properties, including high durability, abrasion resistance, and flexibility. These properties make SBR a preferred material for manufacturing tires, conveyor belts, shoe soles, and other rubber products. Additionally, the transition to bio-based SBR offers significant environmental benefits over its petroleum-based counterpart. As consumers and industries increasingly prioritize sustainability, bio-based SBR presents an attractive alternative that reduces reliance on finite fossil fuel resources and decreases carbon emissions. This aligns with global efforts to combat climate change and reduce environmental impact. Moreover, advancements in technology and manufacturing processes have made the production of biobased SBR more cost-effective and scalable. This has encouraged greater adoption among manufacturers looking to meet sustainability goals while maintaining product performance and quality.

“Industrial grade accounted for the largest by material share of the Bio-butadiene market in 2024” in terms of value.

The industrial grade segment is the largest market for bio-butadiene due to several key reasons. Firstly, bio-butadiene finds extensive use in industrial applications, such as the production of synthetic rubbers, plastics, adhesives, and coatings. These industries require large volumes of butadiene-derived materials for various manufacturing processes, making the industrial grade segment a significant consumer of bio-butadiene.

Moreover, the demand for bio-based alternatives in industrial applications is growing rapidly as companies seek to reduce their environmental footprint and meet sustainability targets. Bio-butadiene, derived from renewable sources such as biomass or agricultural waste, offers a greener alternative to petroleum-based butadiene, aligning with the increasing global emphasis on sustainability.

Furthermore, advancements in technology and manufacturing processes have made the production of bio-butadiene more efficient and cost-effective, driving its adoption in industrial applications. As a result, manufacturers are increasingly incorporating bio-butadiene into their products to enhance their environmental credentials and appeal to environmentally conscious consumers.

"Europe is the largest market for Bio-butadiene Market in 2024, in terms of value."

Europe's prominence as the largest segment in the bio-butadiene market can be attributed to several factors. Firstly, Europe has been at the forefront of environmental sustainability initiatives, with stringent regulations aimed at reducing carbon emissions and promoting the use of renewable resources. This regulatory environment has created a favorable market landscape for bio-based products like bio-butadiene. Additionally, European industries, particularly automotive and construction, have shown a strong commitment to sustainability and reducing their environmental footprint. As a result, there is significant demand for bio-based materials, including bio-butadiene, to meet the requirements of eco-conscious consumers and comply with regulatory standards. Moreover, Europe has made substantial investments in research and development aimed at advancing bio-based technologies and improving the efficiency of bio-butadiene production processes. This has helped drive down costs and increase the competitiveness of bio-based products in the market.

Bio-Butadiene Market by Region

To know about the assumptions considered for the study, download the pdf brochure

Key Market Players

The key players in this market are SABIC (Saudi Arabia), Michelin (France), Zeon Corporation (Japan), Biokemik (Spain), ETB Catalytic Technologies (Netherlands), Trinseo (US), Genomatica (US), Braskem (Brazil), Versalis (Italy), Synthos (Poland), Lummus Technology (US), INVISTA (US), LanzaTech (US), IFPEN (France), Global Bioenergies (France), Evonik Industries (Germany), Axens (France). etc. Continuous developments in the market—including new product launches, mergers & acquisitions, agreements, and expansions—are expected to help the market grow. Leading manufacturers of Bio-butadiene have opted for new product launches to sustain their market position.

Get online access to the report on the World's First Market Intelligence Cloud

  • Easy to Download Historical Data & Forecast Numbers
  • Company Analysis Dashboard for high growth potential opportunities
  • Research Analyst Access for customization & queries
  • Competitor Analysis with Interactive dashboard
  • Latest News, Updates & Trend analysis
Request Sample

Scope of the Report

Report Metric

Details

Years considered for the study

2020-2029

Base Year

2023

Forecast period

2024–2029

Units considered

Value (USD Billion/Million), Volume (Tons)

Segments

Type, end-use industry, application, grade and region.


Regions

Asia Pacific, North America, Europe, Middle East & Africa, and South America

Companies

SABIC (Saudi Arabia), Michelin (France), Zeon Corporation (Japan), Biokemik (Spain), ETB Catalytic Technologies (Netherlands), Trinseo (US), Genomatica (US), Braskem (Brazil), Versalis (Italy), Synthos (Poland), Lummus Technology (US), INVISTA (US), LanzaTech (US), IFPEN (France), Global Bioenergies (France), Evonik Industries (Germany), Axens (France).

Segmentation

This report categorizes the global bio-butadiene market based on type, end-use, application, grade and region.

On the basis of type, the market has been segmented as follows:
  • Styrene-Butadiene Rubber (SBR)
  • Styrene-Butadiene Latex (SBL)
  • Polybutadiene (PB)
  • Acrylonitrile-Butadiene-Styrene (ABS) Resins
  • Styrene-Butadiene Block Copolymers (SBS & SEBS)
  • Nitrile Butadiene Rubber (NBR)
On the basis of application, the market has been segmented as follows:
  • Synthetic Rubber
  • Fine Chemicals
  • Thermoplastic Elastomers
  • Plastics
  • Others
On the basis of end-use industry, the market has been segmented as follows:
  • Automotive And Transportation
  • Consumer Goods  (Footwear)
  • Chemical Processing
  • Building And Construction
  • Medical
  • Textile
On the basis of grade, the market has been segmented as follows:
  • Laboratory Grade
  • Industrial Grade
On the basis of region, the market has been segmented as follows:
  • North America
  • Europe
  • Asia Pacific
  • Middle East & Africa
  • South America

Recent Developments

  • In March 2022 SABIC, a leading player in the chemicals industry, is providing certified renewable butadiene sourced from its TRUCIRCLE portfolio to Kraton, a manufacturer of engineering plastics. Kraton utilizes this renewable butadiene in its certified renewable styrenic block copolymers.
  • In April 2021 Trinseo and ETB have entered into a letter of intent to collaborate on advancing the development of purified bio-based 1,3-butadiene. This collaboration will leverage the combined technology and process expertise of both companies to expedite the creation of sustainable material solutions.
  • In December 2023 ETB Global secured a subsidy exceeding 4.4 million euros (4.761 USD Million) from the European Just Transition Fund.
  • In December 2022 Genomatica Inc., a frontrunner in sustainability, secured $118 million USD in Series C funding to expedite the worldwide commercialization and growth of sustainable materials, aiming to potentially decrease greenhouse gas emissions by 100 million tons annually.
  • In December 2023 OMV and Synthos have entered into a Memorandum of Understanding (MoU) to collaborate on sustainability initiatives, particularly concerning the provision of sustainable butadiene for synthetic rubber. This partnership extends until 2030 and underscores the commitment of both companies to sustainability. Initially, the raw materials for producing sustainable butadiene will include palm fatty acid distillate (PFAD) and used cooking oil. The production of sustainable butadiene will take place at the Burghausen refinery in Germany, which obtained full ISCC PLUS certification in March 2022. The successful delivery of the first batch of sustainable butadiene to Synthos occurred in 2023.

Frequently Asked Questions (FAQ):

To speak to our analyst for a discussion on the above findings, click Speak to Analyst

TABLE OF CONTENTS
 
1 INTRODUCTION (Page No. - 32)
    1.1 STUDY OBJECTIVES 
    1.2 MARKET DEFINITION 
    1.3 INCLUSIONS AND EXCLUSIONS 
    1.4 STUDY SCOPE 
           1.4.1 BIO-BUTADIENE MARKET SEGMENTATION
                    FIGURE 1 BIO-BUTADIENE MARKET SEGMENTATION
           1.4.2 REGIONS COVERED
           1.4.3 YEARS CONSIDERED
    1.5 CURRENCY CONSIDERED 
    1.6 UNITS CONSIDERED 
    1.7 LIMITATIONS 
    1.8 STAKEHOLDERS 
 
2 RESEARCH METHODOLOGY (Page No. - 37)
    2.1 RESEARCH DATA 
          FIGURE 2 BIO-BUTADIENE MARKET: RESEARCH DESIGN
           2.1.1 SECONDARY DATA
                    2.1.1.1 Key data from secondary sources
           2.1.2 PRIMARY DATA
                    2.1.2.1 Key data from primary sources
                    2.1.2.2 Primary data sources
                    2.1.2.3 Key primary participants
                    2.1.2.4 Breakdown of interviews with experts
                    2.1.2.5 Key industry insights
    2.2 BASE NUMBER CALCULATION 
           2.2.1 SUPPLY-SIDE APPROACH
                    FIGURE 3 MARKET SIZE ESTIMATION METHODOLOGY: SUPPLY-SIDE APPROACH
           2.2.2 DEMAND-SIDE APPROACH
                    FIGURE 4 MARKET SIZE ESTIMATION METHODOLOGY: DEMAND-SIDE APPROACH
    2.3 FORECAST NUMBER CALCULATION 
           2.3.1 SUPPLY SIDE
           2.3.2 DEMAND SIDE
    2.4 MARKET SIZE ESTIMATION 
          FIGURE 5 MARKET SIZE ESTIMATION METHODOLOGY: REVENUE OF MARKET PLAYERS
           2.4.1 BOTTOM-UP APPROACH
                    FIGURE 6 MARKET SIZE ESTIMATION METHODOLOGY: BOTTOM-UP APPROACH
           2.4.2 TOP-DOWN APPROACH
                    FIGURE 7 MARKET SIZE ESTIMATION METHODOLOGY: TOP-DOWN APPROACH
    2.5 DATA TRIANGULATION 
          FIGURE 8 BIO-BUTADIENE MARKET: DATA TRIANGULATION
    2.6 RESEARCH ASSUMPTIONS 
    2.7 IMPACT OF RECESSION 
    2.8 GROWTH FORECAST 
    2.9 RISK ASSESSMENT 
 
3 EXECUTIVE SUMMARY (Page No. - 48)
    FIGURE 9 STYRENE BUTADIENE RUBBER SEGMENT TO DOMINATE MARKET BETWEEN 2024 AND 2029
    FIGURE 10 SYNTHETIC RUBBER APPLICATION TO LEAD MARKET BETWEEN  2024 AND 2029
    FIGURE 11 INDUSTRIAL GRADE SEGMENT TO LEAD MARKET BETWEEN 2024 AND 2029
    FIGURE 12 AUTOMOTIVE & TRANSPORTATION END-USE INDUSTRY TO LEAD MARKET BETWEEN 2024 AND 2029
    FIGURE 13 EUROPE TO DOMINATE MARKET DURING FORECAST PERIOD
 
4 PREMIUM INSIGHTS (Page No. - 53)
    4.1 ATTRACTIVE OPPORTUNITIES FOR PLAYERS IN BIO-BUTADIENE MARKET 
          FIGURE 14 GROWING DEMAND FROM AUTOMOTIVE & TRANSPORTATION SECTOR TO DRIVE MARKET
    4.2 BIO-BUTADIENE MARKET, BY TYPE 
          FIGURE 15 STYRENE BUTADIENE RUBBER TO BE FASTEST-GROWING SEGMENT DURING  FORECAST PERIOD
    4.3 BIO-BUTADIENE MARKET, BY COUNTRY 
          FIGURE 16 GERMANY TO BE FASTEST-GROWING MARKET DURING FORECAST PERIOD
 
5 MARKET OVERVIEW (Page No. - 55)
    5.1 INTRODUCTION 
    5.2 MARKET DYNAMICS 
          FIGURE 17 BIO-BUTADIENE MARKET: DRIVERS, RESTRAINTS, OPPORTUNITIES,  AND CHALLENGES
           5.2.1 DRIVERS
                    5.2.1.1 Growing emphasis on sustainable development and government support
                    5.2.1.2 Stringent environmental regulations and shifting consumer trends and preferences
                    5.2.1.3 Technological advancements and reduced dependence on fossil fuels
           5.2.2 RESTRAINTS
                    5.2.2.1 Limited feedstock availability
           5.2.3 OPPORTUNITIES
                    5.2.3.1 Growing demand for sustainable products for various end-use industries
                    5.2.3.2 Scarcity of butadiene for use in rubber market
           5.2.4 CHALLENGES
                    5.2.4.1 Competition from natural petroleum butadiene
                    5.2.4.2 High initial investments
 
6 INDUSTRY TRENDS (Page No. - 61)
    6.1 INTRODUCTION 
    6.2 TRENDS/DISRUPTIONS IMPACTING CUSTOMER BUSINESS 
           6.2.1 REVENUE SHIFT AND NEW REVENUE POCKETS FOR BIO-BUTADIENE MANUFACTURERS
                    FIGURE 18 REVENUE SHIFT IN BIO-BUTADIENE MARKET
    6.3 VALUE CHAIN ANALYSIS 
          FIGURE 19 OVERVIEW OF BIO-BUTADIENE MARKET VALUE CHAIN
           6.3.1 FEEDSTOCK SOURCING
           6.3.2 BIO-BUTADIENE PROCESSING AND PRODUCING
           6.3.3 DISTRIBUTORS
           6.3.4 END USERS
    6.4 PRICING ANALYSIS 
           6.4.1 AVERAGE SELLING PRICE TREND BY REGION
                    TABLE 1 AVERAGE SELLING PRICE OF BIO-BUTADIENE, BY REGION,  2020–2028 (USD/METRIC TON)
                    FIGURE 20 BIO-BUTADIENE MATERIALS MARKET: AVERAGE SELLING PRICE TREND OF  BIO-BUTADIENE, BY REGION
           6.4.2 AVERAGE SELLING PRICE TREND, BY APPLICATION
                    TABLE 2 AVERAGE SELLING PRICE, BY APPLICATION, 2020–2028 (USD/METRIC TON)
                    FIGURE 21 BIO-BUTADIENE MATERIALS MARKET: AVERAGE SELLING PRICE TREND,  BY APPLICATION
           6.4.3 AVERAGE SELLING PRICE TREND, BY TYPE
                    TABLE 3 AVERAGE SELLING PRICE, BY TYPE, 2020–2028 (USD/METRIC TON)
                    FIGURE 22 BIO-BUTADIENE MATERIALS MARKET: AVERAGE SELLING PRICE TREND, BY TYPE
           6.4.4 AVERAGE SELLING PRICE TREND, BY END-USE INDUSTRY
                    TABLE 4 AVERAGE SELLING PRICE, BY END-USE INDUSTRY 2020–2028 (USD/METRIC TON)
                    FIGURE 23 BIO-BUTADIENE MATERIALS MARKET: AVERAGE SELLING PRICE,  BY END-USE INDUSTRY
    6.5 ECOSYSTEM/MARKET MAP 
          TABLE 5 BIO-BUTADIENE MARKET: ECOSYSTEM
    6.6 TECHNOLOGY ANALYSIS 
          TABLE 6 KEY TECHNOLOGIES IN BIO-BUTADIENE MARKET
          TABLE 7 COMPLEMENTARY TECHNOLOGIES IN BIO-BUTADIENE MARKET
          TABLE 8 ADJACENT TECHNOLOGIES IN BIO-BUTADIENE MARKET
    6.7 PATENT ANALYSIS 
           6.7.1 METHODOLOGY
           6.7.2 PATENTS GRANTED WORLDWIDE, 2014–2023
                    TABLE 9 BIO-BUTADIENE MARKET: TOTAL NUMBER OF PATENTS
           6.7.3 PATENT PUBLICATION TRENDS
                    FIGURE 24 NUMBER OF PATENTS GRANTED (2014−2023)
           6.7.4 INSIGHTS
           6.7.5 LEGAL STATUS OF PATENTS
                    FIGURE 25 LEGAL STATUS OF PATENTS
           6.7.6 JURISDICTION ANALYSIS
                    FIGURE 26 PATENT ANALYSIS, BY JURISDICTION, 2014−2023
           6.7.7 TOP COMPANIES/APPLICANTS
                    FIGURE 27 TOP 10 COMPANIES WITH HIGHEST NUMBER OF PATENTS IN LAST 10 YEARS
                    TABLE 10 LIST OF MAJOR PATENT OWNERS FOR BIO-BUTADIENE
           6.7.8 LIST OF MAJOR PATENTS
                    TABLE 11 MAJOR PATENTS FOR BIO-BUTADIENE
    6.8 TRADE ANALYSIS 
           6.8.1 IMPORT SCENARIO
                    FIGURE 28 IMPORTS OF BIO-BUTADIENE, BY COUNTRY, 2020–2023 (USD THOUSAND)
           6.8.2 EXPORT SCENARIO
                    FIGURE 29 EXPORTS OF BIO- BUTADIENE, BY COUNTRY, 2020–2023 (USD THOUSAND)
    6.9 KEY CONFERENCES AND EVENTS, 2024–2025 
          TABLE 12 BIO-BUTADIENE MARKET: DETAILED LIST OF CONFERENCES AND EVENTS, 2024–2025
    6.10 REGULATORY LANDSCAPE 
           6.10.1 REGULATORY BODIES, GOVERNMENT AGENCIES, AND OTHER ORGANIZATIONS
                     TABLE 13 NORTH AMERICA: LIST OF REGULATORY BODIES, GOVERNMENT AGENCIES, AND OTHER ORGANIZATIONS
                     TABLE 14 EUROPE: LIST OF REGULATORY BODIES, GOVERNMENT AGENCIES,  AND OTHER ORGANIZATIONS
                     TABLE 15 ASIA PACIFIC: LIST OF REGULATORY BODIES, GOVERNMENT AGENCIES,  AND OTHER ORGANIZATIONS
                     TABLE 16 MIDDLE EAST & AFRICA: LIST OF REGULATORY BODIES, GOVERNMENT AGENCIES,  AND OTHER ORGANIZATIONS
                     TABLE 17 SOUTH AMERICA: LIST OF REGULATORY BODIES, GOVERNMENT AGENCIES,  AND OTHER ORGANIZATIONS
           6.10.2 REGULATIONS RELATED TO BIO-BUTADIENE MARKET
                     TABLE 18 LIST OF REGULATIONS FOR BIO-BUTADIENE MARKET
    6.11 PORTER’S FIVE FORCES ANALYSIS 
           TABLE 19 BIO-BUTADIENE MARKET: PORTER'S FIVE FORCES ANALYSIS
           FIGURE 30 PORTER’S FIVE FORCES ANALYSIS: BIO-BUTADIENE MARKET
           6.11.1 THREAT OF SUBSTITUTES
           6.11.2 THREAT OF NEW ENTRANTS
           6.11.3 BARGAINING POWER OF SUPPLIERS
           6.11.4 BARGAINING POWER OF BUYERS
           6.11.5 INTENSITY OF COMPETITIVE RIVALRY
    6.12 RAW MATERIAL ANALYSIS 
           6.12.1 CORN
           6.12.2 SUGARCANE
           6.12.3 LIGNOCELLULOSE BIOMASS
           6.12.4 WASTE-TO-ENERGY FEEDSTOCK
    6.13 KEY STAKEHOLDERS AND BUYING CRITERIA 
           6.13.1 KEY STAKEHOLDERS IN BUYING PROCESS
                     FIGURE 31 INFLUENCE OF STAKEHOLDERS ON BUYING PROCESS FOR TOP THREE  END USERS
                     TABLE 20 INFLUENCE OF BUYERS ON BUYING PROCESS FOR TOP THREE END USERS
           6.13.2 BUYING CRITERIA
                     FIGURE 32 KEY BUYING CRITERIA FOR END USERS
                     TABLE 21 KEY BUYING CRITERIA FOR END USERS
    6.14 MACROECONOMIC INDICATORS 
           6.14.1 GDP TRENDS AND FORECASTS OF MAJOR ECONOMIES
                     TABLE 22 PROJECTED REAL GDP GROWTH (ANNUAL PERCENTAGE CHANGE) OF KEY COUNTRIES, 2018–2025
    6.15 CASE STUDIES 
           6.15.1 RENEWABLE BUTADIENE: CASE FOR HYBRID PROCESSING VIA BIO- AND CHEMO-CATALYSIS
           6.15.2 ASSESSING ECONOMIC AND ENVIRONMENTAL SUSTAINABILITY OF BIO-OLEFINS: CASE FOR 1,3-BUTADIENE PRODUCTION FROM BIOETHANOL
 
7 BIO-BUTADIENE MARKET, BY GRADE (Page No. - 95)
    7.1 INTRODUCTION 
          FIGURE 33 INDUSTRIAL GRADE SEGMENT TO LEAD MARKET DURING FORECAST PERIOD
          TABLE 23 BIO-BUTADIENE MARKET, BY GRADE, 2020–2023 (USD MILLION)
          TABLE 24 BIO-BUTADIENE MARKET, BY GRADE, 2024–2029 (USD MILLION)
    7.2 LABORATORY GRADE 
           7.2.1 CRUCIAL ROLE IN SCIENTIFIC ADVANCEMENT TO DRIVE MARKET
    7.3 INDUSTRIAL GRADE 
           7.3.1 PRODUCTION OF SUSTAINABLE SYNTHETIC RUBBERS, PLASTICS, RESINS, AND OTHER CHEMICAL PRODUCTS TO DRIVE MARKET
 
8 BIO-BUTADIENE MARKET, BY TYPE (Page No. - 98)
    8.1 INTRODUCTION 
          FIGURE 34 STYRENE-BUTADIENE RUBBER SEGMENT TO LEAD MARKET DURING  FORECAST PERIOD
          TABLE 25 BIO-BUTADIENE MARKET, BY TYPE, 2020–2023 (USD MILLION)
          TABLE 26 BIO-BUTADIENE MARKET, BY TYPE, 2024–2029 (USD MILLION)
          TABLE 27 BIO-BUTADIENE MARKET, BY TYPE, 2020–2023 (TON)
          TABLE 28 BIO-BUTADIENE MARKET, BY TYPE, 2024–2029 (TON)
    8.2 SBR (STYRENE-BUTADIENE RUBBER) 
           8.2.1 ABRASION RESISTANCE AND AGING STABILITY OF STYRENE, FLEXIBILITY AND RESILIENCE OF BUTADIENE TO DRIVE MARKET
    8.3 SBL (STYRENE-BUTADIENE LATEX) 
           8.3.1 DEMAND FROM ADHESIVES, COATINGS, CONSTRUCTION, AND PAPER INDUSTRIES TO DRIVE MARKET
    8.4 PB (POLYBUTADIENE) 
           8.4.1 EXCEPTIONAL RESILIENCE, ABRASION RESISTANCE, AND LOW-TEMPERATURE FLEXIBILITY TO DRIVE MARKET
    8.5 ABS (ACRYLONITRILE-BUTADIENE-STYRENE) 
           8.5.1 DEMAND FOR AUTOMOTIVE PARTS, CONSUMER PRODUCTS, AND INDUSTRIAL EQUIPMENT TO DRIVE MARKET
    8.6 NBR (NITRILE-BUTADIENE RUBBER) 
           8.6.1 SUPERIOR CHEMICAL RESISTANCE AND DURABILITY TO DRIVE MARKET
    8.7 SBS AND SEBS (STYRENE-BUTADIENE BLOCK COPOLYMERS) 
           8.7.1 EXCELLENT WEATHERABILITY AND RESISTANCE TO OIL AND CHEMICALS TO DRIVE MARKET
    8.8 OTHERS 
           8.8.1 EPDM (ETHYLENE PROPYLENE DIENE MONOMER)
                    8.8.1.1 Offers durability and resistance to environmental factors
           8.8.2 CHLOROPRENE RUBBER (CR)
                    8.8.2.1 Resistant to oils, chemicals, heat, and weathering
           8.8.3 CHLOROPRENE RUBBER (CR)
                    8.8.3.1 Enables excellent elasticity, high tensile strength, and superior abrasion resistance
 
9 BIO-BUTADIENE MARKET, BY APPLICATION (Page No. - 105)
    9.1 INTRODUCTION 
          FIGURE 35 SYNTHETIC RUBBER SEGMENT TO LEAD MARKET DURING FORECAST  PERIOD 2024
          TABLE 29 BIO-BUTADIENE MARKET, BY APPLICATION, 2020–2023 (USD MILLION)
          TABLE 30 BIO-BUTADIENE MARKET, BY APPLICATION, 2024–2029 (USD MILLION)
    9.2 SYNTHETIC RUBBER 
           9.2.1 ENHANCED DURABILITY, RESILIENCE, AND CHEMICAL RESISTANCE OVER NATURAL RUBBER TO DRIVE MARKET
    9.3 FINE CHEMICALS 
           9.3.1 HIGH PROCESS EFFICIENCY AND MINIMIZED ENVIRONMENTAL FOOTPRINT TO DRIVE MARKET
    9.4 THERMOPLASTIC ELASTOMERS 
           9.4.1 RESILIENCE AND ELASTICITY OF ELASTOMERS AND PROCESSABILITY AND RECYCLABILITY OF THERMOPLASTICS TO DRIVE MARKET
    9.5 PLASTICS 
           9.5.1 DEMAND FROM PACKAGING, CONSTRUCTION, AUTOMOTIVE, AND CONSUMER GOODS INDUSTRIES TO DRIVE MARKET
    9.6 OTHER APPLICATIONS b
 
10 BIO-BUTADIENE MARKET, BY END-USE INDUSTRY (Page No. - 110)
     10.1 INTRODUCTION 
             FIGURE 36 AUTOMOTIVE AND TRANSPORTATION SEGMENT TO LEAD MARKET DURING FORECAST PERIOD
             TABLE 31 BIO-BUTADIENE MARKET, BY END-USE INDUSTRY, 2020–2023 (USD MILLION)
             TABLE 32 BIO-BUTADIENE MARKET, BY END-USE INDUSTRY, 2024–2029 (USD MILLION)
     10.2 AUTOMOTIVE AND TRANSPORTATION 
             10.2.1 TIGHTENING EMISSION REGULATIONS, DEMAND FOR ECO-FRIENDLY VEHICLES, AND SUPPLY CHAIN RESILIENCE TO DRIVE MARKET
     10.3 CONSUMER GOODS 
             10.3.1 DURABLE, HIGH-PERFORMING, AND ECO-FRIENDLY PRODUCTS MEETING ENVIRONMENTAL REGULATIONS TO DRIVE MARKET
     10.4 CHEMICAL PROCESSING 
             10.4.1 CREATION OF BIO-BASED ALTERNATIVES TO CONVENTIONAL PETROCHEMICAL-DERIVED PRODUCTS TO DRIVE MARKET
     10.5 BUILDING AND CONSTRUCTION 
             10.5.1 ENHANCED STRUCTURAL INTEGRITY AND DURABILITY OF CONSTRUCTION MATERIALS TO DRIVE MARKET
     10.6 TEXTILE 
             10.6.1 ELASTICITY, STRENGTH, AND RESISTANCE TO WRINKLING, ALONG WITH ENVIRONMENTAL SUSTAINABILITY TO DRIVE MARKET
     10.7 MEDICAL 
             10.7.1 HIGH ELASTICITY, DURABILITY, AND RESISTANCE TO CONTAMINANTS TO DRIVE MARKET
     10.8 OTHER END-USE INDUSTRIES 
             10.8.1 ELECTRONICS
             10.8.2 PACKAGING
             10.8.3 RENEWABLE ENERGY
 
11 BIO-BUTADIENE MARKET, BY REGION (Page No. - 116)
     11.1 INTRODUCTION 
             FIGURE 37 EUROPE TO BE FASTEST-GROWING MARKET DURING FORECAST PERIOD
             TABLE 33 BIO-BUTADIENE MARKET, BY REGION, 2020–2023 (USD MILLION)
             TABLE 34 BIO-BUTADIENE MARKET, BY REGION, 2024–2029 (USD MILLION)
             TABLE 35 BIO-BUTADIENE MARKET, BY REGION , 2020–2023 (TON)
             TABLE 36 BIO-BUTADIENE MARKET, BY REGION, 2024–2029 (TON)
     11.2 ASIA PACIFIC 
             11.2.1 IMPACT OF RECESSION
                        FIGURE 38 ASIA PACIFIC: BIO-BUTADIENE MARKET SNAPSHOT
                        TABLE 37 ASIA PACIFIC: BIO-BUTADIENE MARKET, BY COUNTRY, 2020–2023 (USD MILLION)
                        TABLE 38 ASIA PACIFIC: BIO-BUTADIENE MARKET, BY COUNTRY, 2024–2029 (USD MILLION)
                        TABLE 39 ASIA PACIFIC: BIO-BUTADIENE MARKET, BY COUNTRY, 2020–2023 (TON)
                        TABLE 40 ASIA PACIFIC: BIO-BUTADIENE MARKET, BY COUNTRY, 2024–2029 (TON)
                        TABLE 41 ASIA PACIFIC: BIO-BUTADIENE MARKET, BY TYPE, 2020–2023 (USD MILLION)
                        TABLE 42 ASIA PACIFIC: BIO-BUTADIENE MARKET, BY TYPE, 2024–2029 (USD MILLION)
                        TABLE 43 ASIA PACIFIC: BIO-BUTADIENE MARKET, BY TYPE, 2020–2023 (TON)
                        TABLE 44 ASIA PACIFIC: BIO-BUTADIENE MARKET, BY TYPE, 2024–2029 (TON)
                        TABLE 45 ASIA PACIFIC: BIO-BUTADIENE MARKET, BY GRADE, 2020–2023 (USD MILLION)
                        TABLE 46 ASIA PACIFIC: BIO-BUTADIENE MARKET, BY GRADE, 2024–2029 (USD MILLION)
                        TABLE 47 ASIA PACIFIC: BIO-BUTADIENE MARKET, BY APPLICATION, 2020–2023 (USD MILLION)
                        TABLE 48 ASIA PACIFIC: BIO-BUTADIENE MARKET, BY APPLICATION, 2024–2029 (USD MILLION)
                        TABLE 49 ASIA PACIFIC: BIO-BUTADIENE MARKET, BY END-USE INDUSTRY,  2020–2023 (USD MILLION)
                        TABLE 50 ASIA PACIFIC: BIO-BUTADIENE MARKET, BY END-USE INDUSTRY,  2024–2029 (USD MILLION)
                        11.2.1.1 China
                                     11.2.1.1.1 Significant capital investments toward sustainability to drive market
                                                     TABLE 51 CHINA: BIO-BUTADIENE MARKET, BY END-USE INDUSTRY, 2020–2023 (USD MILLION)
                                                     TABLE 52 CHINA: BIO-BUTADIENE MARKET, BY END-USE INDUSTRY, 2024–2029 (USD MILLION)
                        11.2.1.2 Japan
                                     11.2.1.2.1 Government support, industry participation, and technological advancements to drive market
                                                     TABLE 53 JAPAN: BIO-BUTADIENE MARKET, BY END-USE INDUSTRY, 2020–2023 (USD MILLION)
                                                     TABLE 54 JAPAN: BIO-BUTADIENE MARKET, BY END-USE INDUSTRY, 2024–2029 (USD MILLION)
                        11.2.1.3 South Korea
                                     11.2.1.3.1 High share of global synthetic rubber production to drive market
                                                     TABLE 55 SOUTH KOREA: BIO-BUTADIENE MARKET, BY END-USE INDUSTRY,  2020–2023 (USD MILLION)
                                                     TABLE 56 SOUTH KOREA: BIO-BUTADIENE MARKET, BY END-USE INDUSTRY,  2024–2029 (USD MILLION)
                        11.2.1.4 India
                                     11.2.1.4.1 Significant economic growth and development to drive market
                                                     TABLE 57 INDIA: BIO-BUTADIENE MARKET, BY END-USE INDUSTRY, 2020–2023 (USD MILLION)
                                                     TABLE 58 INDIA: BIO-BUTADIENE MARKET, BY END-USE INDUSTRY, 2024–2029 (USD MILLION)
                        11.2.1.5 Rest of Asia Pacific
                                      TABLE 59 REST OF ASIA PACIFIC BIO-BUTADIENE MARKET, BY END-USE INDUSTRY,  2020–2023 (USD MILLION)
                                      TABLE 60 REST OF ASIA PACIFIC: BIO-BUTADIENE MARKET, BY END-USE INDUSTRY,  2024–2029 (USD MILLION)
     11.3 NORTH AMERICA 
             11.3.1 IMPACT OF RECESSION
                        FIGURE 39 NORTH AMERICA: BIO-BUTADIENE MARKET SNAPSHOT
                        TABLE 61 NORTH AMERICA: BIO-BUTADIENE MARKET, BY COUNTRY, 2020–2023 (USD MILLION)
                        TABLE 62 NORTH AMERICA: BIO-BUTADIENE MARKET, BY COUNTRY, 2024–2029 (USD MILLION)
                        TABLE 63 NORTH AMERICA: BIO-BUTADIENE MARKET, BY COUNTRY, 2020–2023 (TON)
                        TABLE 64 NORTH AMERICA: BIO-BUTADIENE MARKET, BY COUNTRY, 2024–2029 (TON)
                        TABLE 65 NORTH AMERICA: BIO-BUTADIENE MARKET, BY TYPE, 2020–2023 (USD MILLION)
                        TABLE 66 NORTH AMERICA: BIO-BUTADIENE MARKET, BY TYPE, 2024–2029 (USD MILLION)
                        TABLE 67 NORTH AMERICA: BIO-BUTADIENE MARKET, BY TYPE, 2020–2023 (TON)
                        TABLE 68 NORTH AMERICA: BIO-BUTADIENE MARKET, BY TYPE, 2024–2029 (TON)
                        TABLE 69 NORTH AMERICA: BIO-BUTADIENE MARKET, BY GRADE, 2020–2023 (USD MILLION)
                        TABLE 70 NORTH AMERICA: BIO-BUTADIENE MARKET, BY GRADE, 2024–2029 (USD MILLION)
                        TABLE 71 NORTH AMERICA: BIO-BUTADIENE MARKET, BY APPLICATION,  2020–2023 (USD MILLION)
                        TABLE 72 NORTH AMERICA: BIO-BUTADIENE MARKET, BY APPLICATION,  2024–2029 (USD MILLION)
                        TABLE 73 NORTH AMERICA: BIO-BUTADIENE MARKET, BY END-USE INDUSTRY,  2020–2023 (USD MILLION)
                        TABLE 74 NORTH AMERICA: BIO-BUTADIENE MARKET, BY END-USE INDUSTRY,  2024–2029 (USD MILLION)
                        11.3.1.1 US
                                     11.3.1.1.1 Bioeconomy Initiative and Farm Bill to drive market
                                                     TABLE 75 US: BIO-BUTADIENE MARKET, BY END-USE INDUSTRY, 2020–2023 (USD MILLION)
                                                     TABLE 76 US: BIO-BUTADIENE MARKET, BY END-USE INDUSTRY, 2024–2029 (USD MILLION)
                        11.3.1.2 Canada
                                     11.3.1.2.1 Initiatives fostering clean growth and reducing greenhouse gas emissions to drive market
                                                     TABLE 77 CANADA: BIO-BUTADIENE MARKET, BY END-USE INDUSTRY, 2020–2023 (USD MILLION)
                                                     TABLE 78 CANADA: BIO-BUTADIENE MARKET, BY END-USE INDUSTRY, 2024–2029 (USD MILLION)
                        11.3.1.3 Mexico
                                     11.3.1.3.1 Government initiatives to drive bio-butadiene and synthetic rubber industries
                                                     TABLE 79 MEXICO: BIO-BUTADIENE MARKET, BY END-USE INDUSTRY, 2020–2023 (USD MILLION)
                                                     TABLE 80 MEXICO: BIO-BUTADIENE MARKET, BY END-USE INDUSTRY, 2024–2029 (USD MILLION)
     11.4 EUROPE 
             FIGURE 40 EUROPE: BIO-BUTADIENE MARKET SNAPSHOT
             11.4.1 IMPACT OF RECESSION
                        TABLE 81 EUROPE: BIO-BUTADIENE MARKET, BY COUNTRY, 2020–2023 (USD MILLION)
                        TABLE 82 EUROPE: BIO-BUTADIENE MARKET, BY COUNTRY, 2024–2029 (USD MILLION)
                        TABLE 83 EUROPE: BIO-BUTADIENE MARKET, BY COUNTRY, 2020–2023 (TON)
                        TABLE 84 EUROPE: BIO-BUTADIENE MARKET, BY COUNTRY, 2024–2029 (TON)
                        TABLE 85 EUROPE: BIO-BUTADIENE MARKET, BY TYPE, 2020–2023 (USD MILLION)
                        TABLE 86 EUROPE: BIO-BUTADIENE MARKET, BY TYPE, 2024–2029 (USD MILLION)
                        TABLE 87 EUROPE: BIO-BUTADIENE MARKET, BY TYPE, 2020–2023 (TON)
                        TABLE 88 EUROPE: BIO-BUTADIENE MARKET, BY TYPE, 2024–2029 (TON)
                        TABLE 89 EUROPE: BIO-BUTADIENE MARKET, BY GRADE, 2020–2023 (USD MILLION)
                        TABLE 90 EUROPE: BIO-BUTADIENE MARKET, BY GRADE, 2024–2029 (USD MILLION)
                        TABLE 91 EUROPE BIO-BUTADIENE MARKET, BY APPLICATION, 2020–2023 (USD MILLION)
                        TABLE 92 EUROPE: BIO-BUTADIENE MARKET, BY APPLICATION, 2024–2029 (USD MILLION)
                        TABLE 93 EUROPE: BIO-BUTADIENE MARKET, BY END-USE INDUSTRY, 2020–2023 (USD MILLION)
                        TABLE 94 EUROPE: BIO-BUTADIENE MARKET, BY END-USE INDUSTRY, 2024–2029 (USD MILLION)
                        11.4.1.1 Germany
                                     11.4.1.1.1 Ambitious environmental regulations aimed at reducing greenhouse gas emissions to drive market
                                                     TABLE 95 GERMANY: BIO-BUTADIENE MARKET, BY END-USE INDUSTRY,  2020–2023 (USD MILLION)
                                                     TABLE 96 GERMANY: BIO-BUTADIENE MARKET, BY END-USE INDUSTRY,  2024–2029 (USD MILLION)
                        11.4.1.2 UK
                                     11.4.1.2.1 Adoption of sustainable practices in automotive and construction industries to drive market
                                                     TABLE 97 UK: BIO-BUTADIENE MARKET, BY END-USE INDUSTRY, 2020–2023 (USD MILLION)
                                                     TABLE 98 UK: BIO-BUTADIENE MARKET, BY END-USE INDUSTRY, 2024–2029 (USD MILLION)
                        11.4.1.3 France
                                     11.4.1.3.1 Stringent environmental regulations and promotion of bio-based economy to drive market
                                                     TABLE 99 FRANCE: BIO-BUTADIENE MARKET, BY END-USE INDUSTRY, 2020–2023 (USD MILLION)
                                                     TABLE 100 FRANCE: BIO-BUTADIENE MARKET, BY END-USE INDUSTRY, 2024–2029 (USD MILLION)
                        11.4.1.4 Italy
                                     11.4.1.4.1 Growing environmental consciousness among consumers and industries to drive market
                                                     TABLE 101 ITALY: BIO-BUTADIENE MARKET, BY END-USE INDUSTRY, 2020–2023 (USD MILLION)
                                                     TABLE 102 ITALY: BIO-BUTADIENE MARKET, BY END-USE INDUSTRY, 2024–2029 (USD MILLION)
                        11.4.1.5 Spain
                                     11.4.1.5.1 Well-established automotive industry and demand for environmentally friendly building materials to drive market
                                                     TABLE 103 SPAIN: BIO-BUTADIENE MARKET, BY END-USE INDUSTRY, 2020–2023 (USD MILLION)
                                                     TABLE 104 SPAIN: BIO-BUTADIENE MARKET, BY END-USE INDUSTRY, 2024–2029 (USD MILLION)
                        11.4.1.6 Russia
                                     11.4.1.6.1 Expanding automotive and construction sectors to drive market
                                                     TABLE 105 RUSSIA: BIO-BUTADIENE MARKET, BY END-USE INDUSTRY, 2020–2023 (USD MILLION)
                                                     TABLE 106 RUSSIA: BIO-BUTADIENE MARKET, BY END-USE INDUSTRY, 2024–2029 (USD MILLION)
                        11.4.1.7 Rest of Europe
                                     TABLE 107 REST OF EUROPE: BIO-BUTADIENE MARKET, BY END-USE INDUSTRY,  2020–2023 (USD MILLION)
                                     TABLE 108 REST OF EUROPE: BIO-BUTADIENE MARKET, BY END-USE INDUSTRY,  2024–2029 (USD MILLION)
     11.5 SOUTH AMERICA 
             11.5.1 IMPACT OF RECESSION
                        TABLE 109 SOUTH AMERICA: BIO-BUTADIENE MARKET, BY COUNTRY, 2020–2023 (USD MILLION)
                        TABLE 110 SOUTH AMERICA: BIO-BUTADIENE MARKET, BY COUNTRY, 2024–2029 (USD MILLION)
                        TABLE 111 SOUTH AMERICA: BIO-BUTADIENE MARKET, BY COUNTRY, 2020–2023 (TON)
                        TABLE 112 SOUTH AMERICA: BIO-BUTADIENE MARKET, BY COUNTRY, 2024–2029 (TON)
                        TABLE 113 SOUTH AMERICA: BIO-BUTADIENE MARKET, BY TYPE, 2020–2023 (USD MILLION)
                        TABLE 114 SOUTH AMERICA :BIO-BUTADIENE MARKET, BY TYPE, 2024–2029 (USD MILLION)
                        TABLE 115 SOUTH AMERICA: BIO-BUTADIENE MARKET, BY TYPE, 2020–2023 (TON)
                        TABLE 116 SOUTH AMERICA: BIO-BUTADIENE MARKET, BY TYPE, 2024–2029 (TON)
                        TABLE 117 SOUTH AMERICA: BIO-BUTADIENE MARKET, BY GRADE, 2020–2023 (USD MILLION)
                        TABLE 118 SOUTH AMERICA: BIO-BUTADIENE MARKET, BY GRADE, 2024–2029 (USD MILLION)
                        TABLE 119 SOUTH AMERICA: BIO-BUTADIENE MARKET, BY APPLICATION,  2020–2023 (USD MILLION)
                        TABLE 120 SOUTH AMERICA: BIO-BUTADIENE MARKET, BY APPLICATION,  2024–2029 (USD MILLION)
                        TABLE 121 SOUTH AMERICA: BIO-BUTADIENE MARKET, BY END-USE INDUSTRY,  2020–2023 (USD MILLION)
                        TABLE 122 SOUTH AMERICA: BIO-BUTADIENE MARKET, BY END-USE INDUSTRY,  2024–2029 (USD MILLION)
                        11.5.1.1 Brazil
                                     11.5.1.1.1 Significant production of ethanol and large automotive industry to drive market
                                                     TABLE 123 BRAZIL: BIO-BUTADIENE MARKET, BY END-USE INDUSTRY, 2020–2023 (USD MILLION)
                                                     TABLE 124 BRAZIL: BIO-BUTADIENE MARKET, BY END-USE INDUSTRY, 2024–2029 (USD MILLION)
                        11.5.1.2 Argentina
                                     11.5.1.2.1 Large agricultural sector and increase in vehicle production to drive market
                                                     TABLE 125 ARGENTINA: BIO-BUTADIENE MARKET, BY END-USE INDUSTRY,  2020–2023 (USD MILLION)
                                                     TABLE 126 ARGENTINA: BIO-BUTADIENE MARKET, BY END-USE INDUSTRY,  2024–2029 (USD MILLION)
                        11.5.1.3 Rest of South America
                                      TABLE 127 REST OF SOUTH AMERICA: BIO-BUTADIENE MARKET, BY END-USE INDUSTRY,  2020–2023 (USD MILLION)
                                      TABLE 128 REST OF SOUTH AMERICA :BIO-BUTADIENE MARKET, BY END-USE INDUSTRY,  2024–2029 (USD MILLION)
     11.6 MIDDLE EAST & AFRICA 
             11.6.1 IMPACT OF RECESSION
                        TABLE 129 MIDDLE EAST & AFRICA: BIO-BUTADIENE MARKET, BY COUNTRY,  2020–2023 (USD MILLION)
                        TABLE 130 MIDDLE EAST & AFRICA: BIO-BUTADIENE MARKET, BY COUNTRY,  2024–2029 (USD MILLION)
                        TABLE 131 MIDDLE EAST & AFRICA: BIO-BUTADIENE MARKET, BY COUNTRY, 2020–2023 (TON)
                        TABLE 132 MIDDLE EAST & AFRICA: BIO-BUTADIENE MARKET, BY COUNTRY, 2024–2029 (TON)
                        TABLE 133 MIDDLE EAST & AFRICA: BIO-BUTADIENE MARKET, BY TYPE, 2020–2023 (USD MILLION)
                        TABLE 134 MIDDLE EAST & AFRICA: BIO-BUTADIENE MARKET, BY TYPE, 2024–2029 (USD MILLION)
                        TABLE 135 MIDDLE EAST & AFRICA: BIO-BUTADIENE MARKET, BY TYPE, 2020–2023 (TON)
                        TABLE 136 MIDDLE EAST & AFRICA: BIO-BUTADIENE MARKET, BY TYPE, 2024–2029 (TON)
                        TABLE 137 MIDDLE EAST & AFRICA: BIO-BUTADIENE MARKET, BY GRADE,  2020–2023 (USD MILLION)
                        TABLE 138 MIDDLE EAST & AFRICA: BIO-BUTADIENE MARKET, BY GRADE,  2024–2029 (USD MILLION)
                        TABLE 139 MIDDLE EAST & AFRICA: BIO-BUTADIENE MARKET, BY APPLICATION,  2020–2023 (USD MILLION)
                        TABLE 140 MIDDLE EAST & AFRICA: BIO-BUTADIENE MARKET, BY APPLICATION,  2024–2029 (USD MILLION)
                        TABLE 141 MIDDLE EAST & AFRICA: BIO-BUTADIENE MARKET, BY END-USE INDUSTRY,  2020–2023 (USD MILLION)
                        TABLE 142 MIDDLE EAST & AFRICA: BIO-BUTADIENE MARKET, BY END-USE INDUSTRY,  2024–2029 (USD MILLION)
                        11.6.1.1 GCC
                                     11.6.1.1.1 Saudi Arabia
                                                    11.6.1.1.1.1 Sustainable manufacturing, strategic collaborations, and growing construction sector to drive market
                                                                       TABLE 143 SAUDI ARABIA: BIO-BUTADIENE MARKET, BY END-USE INDUSTRY,  2020–2023 (USD MILLION)
                                                                       TABLE 144 SAUDI ARABIA: BIO-BUTADIENE MARKET, BY END-USE INDUSTRY,  2024–2029 (USD MILLION)
                                     11.6.1.1.2 UAE
                                                    11.6.1.1.2.1 Robust growth of construction sector, sustainable development, and substantial investments in chemical production to drive market
                                                                       TABLE 145 UAE: BIO-BUTADIENE MARKET, BY END-USE INDUSTRY, 2020–2023 (USD MILLION)
                                                                       TABLE 146 UAE: BIO-BUTADIENE MARKET, BY END-USE INDUSTRY, 2024–2029 (USD MILLION)
                        11.6.1.2 Rest of GCC
                                      TABLE 147 REST OF GCC: BIO-BUTADIENE MARKET, BY END-USE INDUSTRY,  2020–2023 (USD MILLION)
                                      TABLE 148 REST OF GCC: BIO-BUTADIENE MARKET, BY END-USE INDUSTRY,  2024–2029 (USD MILLION)
                                     11.6.1.2.1 South Africa
                                                    11.6.1.2.1.1 Significant chemical production and increasing focus on environmentally conscious development to drive market
                                                                       TABLE 149 SOUTH AFRICA: BIO-BUTADIENE MARKET, BY END-USE INDUSTRY,  2020–2023 (USD MILLION)
                                                                       TABLE 150 SOUTH AFRICA: BIO-BUTADIENE MARKET, BY END-USE INDUSTRY,  2024–2029 (USD MILLION)
                        11.6.1.3 Rest of Middle East & Africa
                                      TABLE 151 REST OF MIDDLE EAST & AFRICA: BIO-BUTADIENE MARKET, BY END-USE INDUSTRY, 2020–2023 (USD MILLION)
                                      TABLE 152 REST MIDDLE EAST & AFRICA: BIO-BUTADIENE MARKET, BY END-USE INDUSTRY,  2024–2029 (USD MILLION)
 
12 COMPETITIVE LANDSCAPE (Page No. - 176)
     12.1 INTRODUCTION 
     12.2 KEY PLAYER STRATEGIES/ RIGHT TO WIN 
             TABLE 153 OVERVIEW OF STRATEGIES ADOPTED BY KEY BIO-BUTADIENE PLAYERS
     12.3 MARKET SHARE ANALYSIS 
             12.3.1 RANKING OF KEY MARKET PLAYERS, 2023
                        FIGURE 41 RANKING OF TOP THREE PLAYERS IN BIO-BUTADIENE MARKET, 2023
             12.3.2 MARKET SHARE OF KEY PLAYERS
                        TABLE 154 BIO-BUTADIENE MARKET: DEGREE OF COMPETITION
                        FIGURE 42 SHARE OF KEY PLAYERS IN BIO-BUTADIENE MARKET, 2023
     12.4 REVENUE ANALYSIS 
             FIGURE 43 REVENUE ANALYSIS OF TOP 3 PLAYERS, 2020–2024
     12.5 COMPANY EVALUATION MATRIX: KEY PLAYERS, 2023 
             12.5.1 STARS
             12.5.2 EMERGING LEADERS
             12.5.3 PERVASIVE PLAYERS
             12.5.4 PARTICIPANTS
                        FIGURE 44 BIO-BUTADIENE MARKET: COMPANY EVALUATION MATRIX, 2023
             12.5.5 COMPETITIVE BENCHMARKING: KEY PLAYERS, 2023
                        TABLE 155 TYPE: COMPANY FOOTPRINT (11 COMPANIES)
                        TABLE 156 APPLICATION: COMPANY FOOTPRINT (11 COMPANIES)
                        TABLE 157 END-USE INDUSTRY: COMPANY FOOTPRINT (11 COMPANIES)
                        TABLE 158 REGION: COMPANY FOOTPRINT (11 COMPANIES)
                        FIGURE 45 BIO-BUTADIENE MARKET: OVERALL COMPANY FOOTPRINT
     12.6 COMPANY VALUATION AND FINANCIAL METRICS 
            FIGURE 46 EV/EBITDA OF KEY VENDORS
            FIGURE 47 YEAR-TO-DATE (YTD) PRICE TOTAL RETURN
     12.7 COMPETITIVE SCENARIO AND TRENDS 
             12.7.1 PRODUCT LAUNCHES
                        TABLE 159 BIO-BUTADIENE MARKET: PRODUCT LAUNCHES (JANUARY 2014–MAY 2024)
             12.7.2 DEALS
                        TABLE 160 BIO-BUTADIENE MARKET: DEALS (JANUARY 2014–MAY 2024)
             12.7.3 OTHER DEVELOPMENTS
                        TABLE 161 BIO-BUTADIENE MARKET: OTHER DEVELOPMENTS (JANUARY 2014–MAY 2024)
 
13 COMPANY PROFILES (Page No. - 190)
(Business Overview, Products Offered, Recent Developments, MnM View Right to win, Strategic choices made, Weaknesses and competitive threats) *
     13.1 KEY PLAYERS 
             13.1.1 SABIC
                        TABLE 162 SABIC: COMPANY OVERVIEW
                        FIGURE 48 SABIC: COMPANY SNAPSHOT
                        TABLE 163 SABIC: PRODUCTS/SOLUTIONS/SERVICES OFFERED
                        TABLE 164 SABIC: DEALS (JANUARY 2014–MAY 2024)
                        TABLE 165 SABIC: EXPANSIONS (JANUARY 2014–MAY 2024)
                        TABLE 166 SABIC: OTHER DEVELOPMENTS (JANUARY 2014–MAY 2024)
             13.1.2 ETB CATALYTIC TECHNOLOGIES & TRINSEO
                        TABLE 167 ETB CATALYTIC TECHNOLOGIES: COMPANY OVERVIEW
                        TABLE 168 ETB CATALYTIC TECHNOLOGIES: PRODUCTS/SOLUTIONS/SERVICES OFFERED
                        TABLE 169 ETB CATALYTIC TECHNOLOGIES: DEALS (JANUARY 2014–MAY 2024)
                        TABLE 170 ETB CATALYTIC TECHNOLOGIES: OTHER DEVELOPMENTS (JANUARY 2014–MAY 2024)
             13.1.3 GENOMATICA, INC. & VERSALIS
                        TABLE 171 GENOMATICA, INC.: COMPANY OVERVIEW
                        TABLE 172 GENOMATICA, INC.: PRODUCTS/SOLUTIONS/SERVICES OFFERED
                        TABLE 173 GENOMATICA, INC.: OTHER DEVELOPMENTS (JANUARY 2014–MAY 2024)
             13.1.4 SYNTHOS & LIMMUS TECHNOLOGY, LLC.
                        TABLE 174 SYNTHOS: COMPANY OVERVIEW
                        TABLE 175 SYNTHOS: PRODUCTS/SOLUTIONS/SERVICES OFFERED
                        TABLE 176 SYNTHOS: DEALS (JANUARY 2014–MAY 2024)
                        TABLE 177 SYNTHOS: EXPANSIONS (JANUARY 2014–MAY 2024)
                        TABLE 178 SYNTHOS: OTHER DEVELOPMENTS (JANUARY 2014–MAY 2024)
             13.1.5 INVISTA & LANZATECH
                        TABLE 179 INVISTA: COMPANY OVERVIEW
                        TABLE 180 INVISTA: PRODUCTS/SOLUTIONS/SERVICES OFFERED
                        TABLE 181 INVISTA: OTHER DEVELOPMENTS (JANUARY 2014–MAY 2024)
             13.1.6 BRASKEM S.A.
                        TABLE 182 BRASKEM S.A.: COMPANY OVERVIEW
                        FIGURE 49 BRASKEM S.A.: COMPANY SNAPSHOT
                        TABLE 183 BRASKEM S.A.: PRODUCTS/SOLUTIONS/SERVICES OFFERED
                        TABLE 184 BRASKEM S.A.: OTHER DEVELOPMENTS (JANUARY 2014–MAY 2024)
             13.1.7 EVONIK INDUSTRIES
                        TABLE 185 EVONIK INDUSTRIES: COMPANY OVERVIEW
                        FIGURE 50 EVONIK INDUSTRIES: COMPANY SNAPSHOT
                        TABLE 186 EVONIK INDUSTRIES: PRODUCTS/SOLUTIONS/SERVICES OFFERED
                        TABLE 187 EVONIK INDUSTRIES: PRODUCT LAUNCHES (JANUARY 2014–MAY 2024)
                        TABLE 188 EVONIK INDUSTRIES: DEALS (JANUARY 2014–MAY 2024)
                        TABLE 189 EVONIK INDUSTRIES: OTHER DEVELOPMENTS (JANUARY 2014–MAY 2024)
             13.1.8 BIOKEMIK
                        TABLE 190 BIOKEMIK: COMPANY OVERVIEW
                        TABLE 191 BIOKEMIK: PRODUCTS/SOLUTIONS/SERVICES OFFERED
                        TABLE 192 BIOKEMIK: DEALS (JANUARY 2014–MAY 2024)
                        TABLE 193 BIOKEMIK: OTHER DEVELOPMENTS (JANUARY 2014–MAY 2024)
             13.1.9 MICHELIN & IFPENS & AXENS
                        TABLE 194 MICHELIN: COMPANY OVERVIEW
                        FIGURE 51 MICHELIN: COMPANY SNAPSHOT
                        TABLE 195 MICHELIN: PRODUCTS/SOLUTIONS/SERVICES OFFERED
                        TABLE 196 MICHELIN: DEALS (JANUARY 2014–MAY 2024)
                        TABLE 197 MICHELIN: EXPANSIONS (JANUARY 2014–MAY 2024)
                        TABLE 198 MICHELIN: OTHER DEVELOPMENTS (JANUARY 2014–MAY 2024)
             13.1.10 ZEON CORPORATION
                        TABLE 199 ZEON CORPORATION: COMPANY OVERVIEW
                        FIGURE 52 ZEON CORPORATION: COMPANY SNAPSHOT
                        TABLE 200 ZEON CORPORATION: PRODUCTS/SOLUTIONS/SERVICES OFFERED
                        TABLE 201 ZEON CORPORATION: OTHER DEVELOPMENTS (JANUARY 2014–MAY 2024)
             13.1.11 GLOBAL BIOENERGIES
                        TABLE 202 GLOBAL BIOENERGIES: COMPANY OVERVIEW
                        FIGURE 53 GLOBAL BIOENERGIES: COMPANY SNAPSHOT
                        TABLE 203 GLOBAL BIOENERGIES: PRODUCTS/SOLUTIONS/SERVICES OFFERED
                        TABLE 204 GLOBAL BIOENERGIES: EXPANSIONS (JANUARY 2014–MAY 2024)
 
*Details on Business Overview, Products Offered, Recent Developments, MnM View, Right to win, Strategic choices made, Weaknesses and competitive threats might not be captured in case of unlisted companies.
 
14 APPENDIX (Page No. - 227)
     14.1 DISCUSSION GUIDE 
     14.2 KNOWLEDGESTORE: MARKETSANDMARKETS’  SUBSCRIPTION PORTAL 
     14.3 CUSTOMIZATION OPTIONS 
     14.4 RELATED REPORTS 
     14.5 AUTHOR DETAILS 
 

The study involved four major activities in estimating the market size of the Bio-butadiene market. Exhaustive secondary research was done to collect information on the market, the peer market, and the parent market. The next step was to validate these findings, assumptions, and sizing with industry experts across the value chain through primary research. Both top-down and bottom-up approaches were employed to estimate the complete market size. Thereafter, the market breakdown and data triangulation procedures were used to estimate the market size of the segments and subsegments.

Secondary Research

In the secondary research process, various secondary sources have been referred to for identifying and collecting information for this study. These secondary sources include annual reports, press releases, investor presentations of companies, white papers, certified publications, trade directories, articles from recognized authors, the gold standard and silver standard websites, and databases.

Secondary research has been used to obtain key information about the value chain of the industry, the monetary chain of the market, the total pool of key players, market classification, and segmentation according to industry trends to the bottom-most level and regional markets. It was also used to obtain information about the key developments from a market-oriented perspective.

Primary Research

The bio-butadienemarket comprises several stakeholders in the value chain, which include feedstock providers,  bio-butadiene manufacturers, distribution and end users. Various primary sources from the supply and demand sides of the Bio-butadiene market have been interviewed to obtain qualitative and quantitative information. The primary interviewees from the demand side include key opinion leaders in end-use sectors. The primary sources from the supply side include manufacturers, associations, and institutions involved in the bio-butadiene industry.

Primary interviews were conducted to gather insights such as market statistics, data on revenue collected from the products and services, market breakdowns, market size estimations, market forecasting, and data triangulation. Primary research also helped in understanding the various trends related to type, application, end-use, grade and region. Stakeholders from the demand side, such as CIOs, CTOs, and CSOs, were interviewed to understand the buyer’s perspective on the suppliers, products, fabricators, and their current usage of bio-butadiene material and the outlook of their business, which will affect the overall market.

The breakdown of profiles of the primary interviewees is illustrated in the figure below:

Bio-Butadiene Market Size, and Share

Note: Tier 1, Tier 2, and Tier 3 companies are classified based on their market revenue in 2023, available in the public domain, product portfolios, and geographical presence.

Other designations include consultants and sales, marketing, and procurement managers.

To know about the assumptions considered for the study, download the pdf brochure

Company name

Designation

Lummus Technology (US)

Piping & Layout Engineer

Genomatica Inc,

Polymer Expert

Michelin (France)

R&D Manager

Biokemik (Spain)

Sales Manager

ETB Catalytic Technologies (Netherlands)

Technology Expert

Market Size Estimation

The top-down and bottom-up approaches have been used to estimate and validate the size of the bio-butadiene market.

  • The key players in the industry have been identified through extensive secondary research.
  • The industry's supply chain has been determined through primary and secondary research.
  • All percentage shares, splits, and breakdowns have been determined using secondary sources and verified through primary sources.
  • All possible parameters that affect the markets covered in this research study have been accounted for, viewed in extensive detail, verified through primary research, and analyzed to obtain the final quantitative and qualitative data.
  • The research includes the study of reports, reviews, and newsletters of the key market players, along with extensive interviews for opinions with leaders such as directors and marketing executives.

Bio-Butadienemarket: Bottum-Up Approach

Bio-Butadiene Market Size, and Share

Note: All the shares are based on the global market size.

Source: Secondary Research, Interviews with Experts, and MarketsandMarkets Analysis

To know about the assumptions considered for the study, Request for Free Sample Report

Bio-Butadienemarket: Top-Down Approach

Bio-Butadiene Market Size, and Share

Data Triangulation

After arriving at the total market size from the estimation process explained above, the overall market has been split into several segments and sub-segments. To complete the overall market engineering process and arrive at the exact statistics for all the segments and sub-segments, the data triangulation and market breakdown procedures have been employed, wherever applicable. The data has been triangulated by studying various factors and trends from both the demand and supply sides. Along with this, the market size has been validated by using both the top-down and bottom-up approaches and primary interviews. Hence, for every data segment, there have been three sources—top-down approach, bottom-up approach, and expert interviews. The data was assumed correct when the values arrived from the three sources matched.

Market Definition

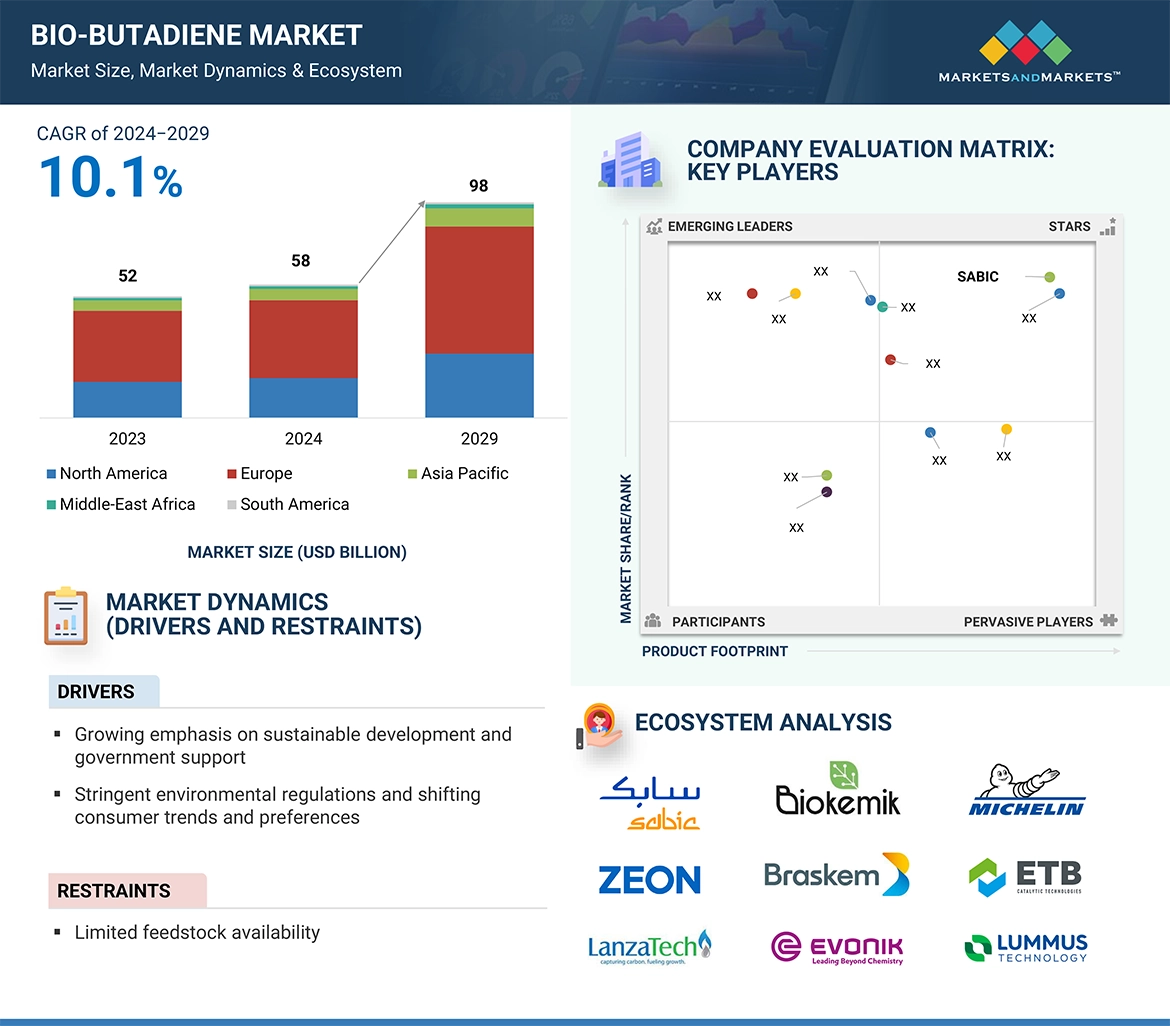
The bio-butadiene market refers to the commercial landscape encompassing the production, distribution, and application of bio-butadiene, a sustainable alternative to conventional butadiene derived from fossil fuels. Bio-butadiene is produced from renewable resources such as biomass, including agricultural residues, sugarcane, and corn. This market represents an essential segment of the broader bio-based chemicals industry, which aims to reduce the environmental footprint associated with traditional petrochemicals by leveraging renewable feedstocks.

The bio-butadiene market is driven by several factors, including the growing global emphasis on sustainability and environmental stewardship. Governments worldwide are implementing stringent regulations to curb carbon emissions and promote the use of eco-friendly materials, thereby creating a favorable regulatory environment for bio-based products. In response, numerous industries such as automotive, construction, and consumer goods are increasingly adopting bio-butadiene to meet their sustainability goals and reduce dependency on fossil-based raw materials.

Overall, the bio-butadiene market is poised for significant growth, driven by environmental regulations, technological innovations, and the increasing demand for sustainable alternatives across various industries. As the market matures, it is expected to play a pivotal role in the transition towards a more sustainable and circular economy.

Key Stakeholders

  • Bio-butadiene suppliers
  • Manufacturing Facilities
  • Environment friendly product manufacturers
  • Research organizations
  • Governments and research organizations
  • Regulatory bodies
  • Environment support agencies
  • End-users

Report Objectives

  • To define, describe, and forecast the size of the bio-butadiene market, in terms of value and volume.
  • To provide detailed information regarding the major factors (drivers, opportunities, restraints, and challenges) influencing the growth of the market
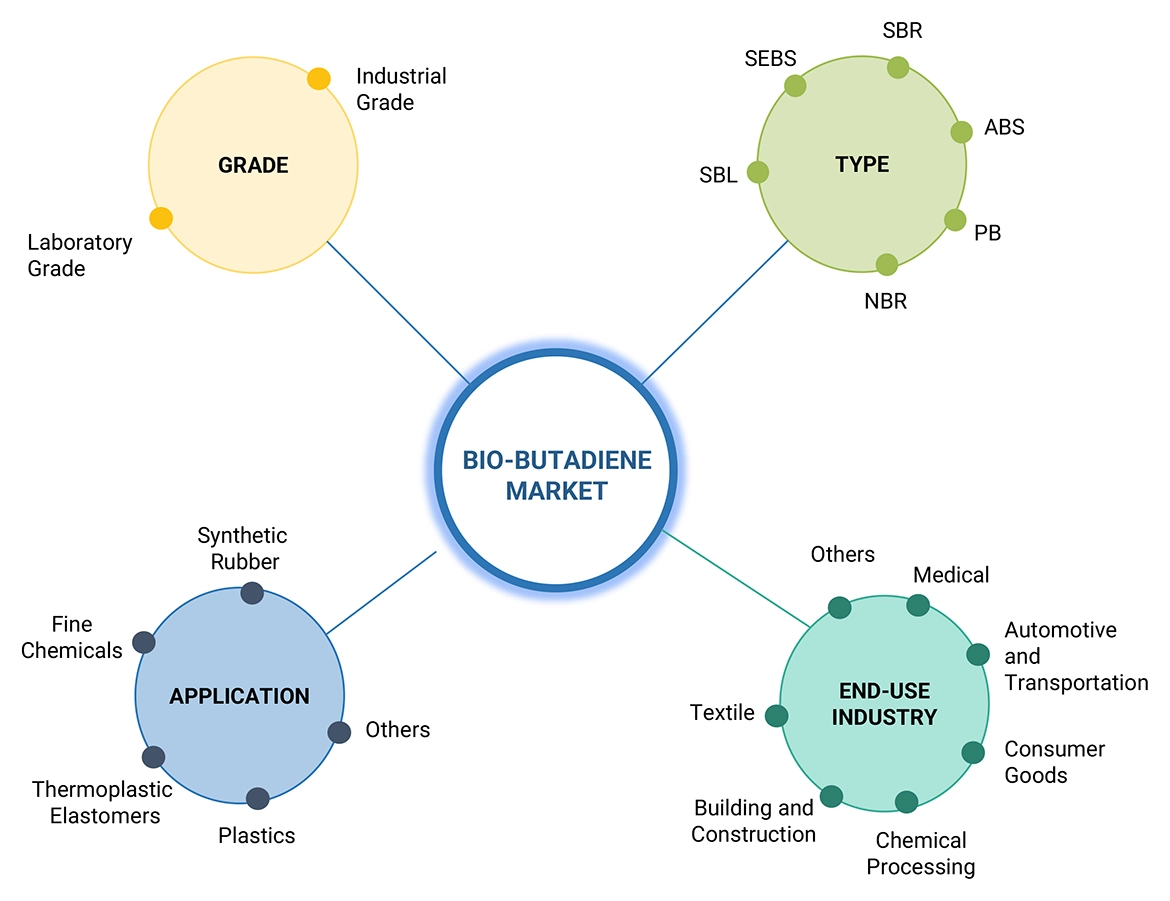
  • To estimate and forecast the market size based on product type, end-use, application, grade and region.
  • To forecast the size of the market with respect to major regions, namely, Europe, North America, Asia Pacific, Middle East & Africa, and South America, along with their key countries.
  • To strategically analyze micromarkets1 with respect to individual growth trends, prospects, and their contribution to the overall market.
  • To analyze opportunities in the market for stakeholders and provide a competitive landscape of market leaders.
  • To track and analyze recent developments such as expansions, new product launches, partnerships & agreements, and acquisitions in the market.
  • To strategically profile key market players and comprehensively analyze their core competencies.

Available Customizations

Along with the given market data, MarketsandMarkets offers customizations according to the company’s specific needs. The following customization options are available for the report:

Regional Analysis

  • Further breakdown of a region with respect to a particular country or additional application

Company Information

  • Detailed analysis and profiles of additional market players
Custom Market Research Services

We will customize the research for you, in case the report listed above does not meet with your exact requirements. Our custom research will comprehensively cover the business information you require to help you arrive at strategic and profitable business decisions.

Request Customization
Report Code
CH 9030
Published ON
May, 2024
Choose License Type
BUY NOW
  • SHARE
X
Request Customization
Speak to Analyst
Speak to Analyst
OR FACE-TO-FACE MEETING
PERSONALIZE THIS RESEARCH
  • Triangulate with your Own Data
  • Get Data as per your Format and Definition
  • Gain a Deeper Dive on a Specific Application, Geography, Customer or Competitor
  • Any level of Personalization
REQUEST A FREE CUSTOMIZATION
LET US HELP YOU!
  • What are the Known and Unknown Adjacencies Impacting the Bio-Butadiene Market
  • What will your New Revenue Sources be?
  • Who will be your Top Customer; what will make them switch?
  • Defend your Market Share or Win Competitors
  • Get a Scorecard for Target Partners
CUSTOMIZED WORKSHOP REQUEST
  • Call Us
  • +1-888-600-6441 (Corporate office hours)
  • +1-888-600-6441 (US/Can toll free)
  • +44-800-368-9399 (UK office hours)
CONNECT WITH US
ABOUT TRUST ONLINE
©2024 MarketsandMarkets Research Private Ltd. All rights reserved
DMCA.com Protection Status Website Feedback